

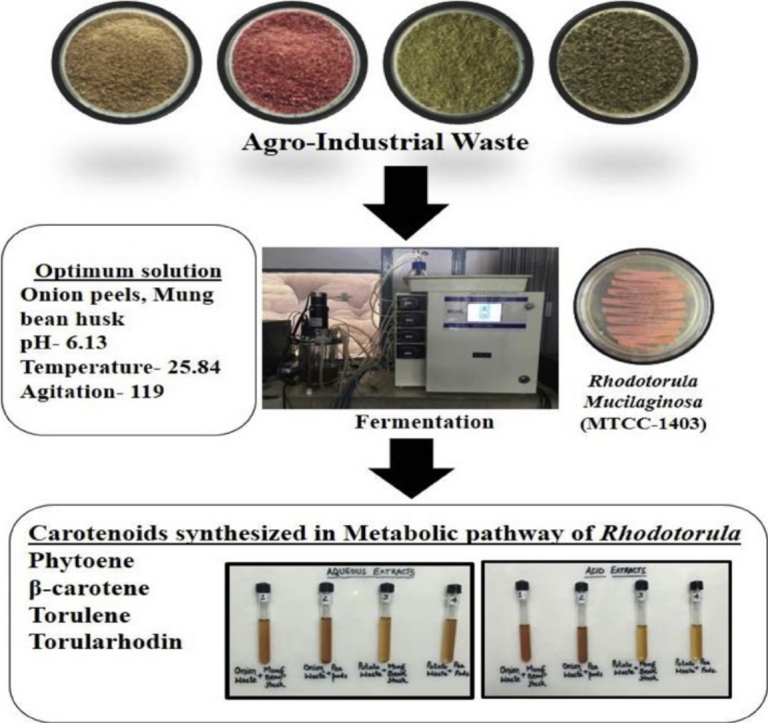
Graphical abstract
Keywords: Rhodotorula mucilaginosa, Agro-industrial waste, β-carotene, Torularhodin, Torulene, Antioxidant activity
Highlights
-
•
Agro wastes were used as carbon, nitrogen source to produce pigments (Carotenoids) by Rhodotorula mucilaginosa.
-
•
Response Surface Methodology was used to optimize the pH, temperature and agitation in shake flask.
-
•
Impact of aeration was studied in Fermenter.
-
•
LC-MS confirmed the extracted pigment was mixture of Phytoene, Toluene, Torularhodin, and β-carotene.
Abstract
Bio-colorants are preferred over synthetic colors as bio-colorants not only impart characteristic color to the food also contain harmless bio-active antioxidant nutrients. The present study was undertaken to investigate the potential of agro-industrial waste (Onion peels, potato skin, mung bean husk and pea pods) for carotenoid production from Rhodotorula mucilaginosa. After screening of appropriate carbon, nitrogen sources from agro-industrial waste, the fermentation conditions (pH, temperature, agitation) were optimized using Response Surface Methodology and optimum conditions were pH 6.1, temperature 25.8 ᴼC and agitation 119.6 rpm. Further, to evaluate the effect of aeration on carotenoids synthesis, fermentation was carried out in 3 L bio-reactor under optimum conditions with an air input of 1.0 vvm. Aeration causes elevation of more than 100 μg carotenoids per g of dry biomass. LC-MS of extracted pigment confirmed the presence of some other carotenoids along with β-carotene. The major carotenoid compounds were found from the investigation were torularhodin, β-carotene, and torulene.
1. Introduction
Carotenoids are highly unsaturated isoprene derivatives under the category of tetraterpenoids consisting of eight isoprene units. They contain large C35-C40 polyene chains also known as the backbone of the molecule which is the most crucial feature for the chemical reactivity of the carotenoids towards the free radicals and singlet oxygen molecules [1]. The long carbon chain of alternating single and double bonds is the characteristic feature of carotenoids allowing them to absorb light in the visible range of the spectrum [2]. This feature of carotenoids has significant relevance to eyes with respect to the protection of vision from photo-induced oxidative damage [3]. Along with the use of carotenoids as food colorants, they have also been integrated into nutraceutical bloom especially the β-carotene due to the proven claim of antioxidant properties [4]. Carotenoids, Pro-vitamin A, are one of the most important micronutrients for the proper functioning of eyes and other metabolic processes because their dietary deficiency can result in xerophthalmia, blindness, keratomalacia or in certain cases, death [5].
Most of the natural colors have biologically active chemical compounds known as bioactive compounds or phytochemicals which are categorized as antioxidants. These antioxidants play a very crucial role in the human health as they prevent several types of modern lifestyle diseases such as cancer and cardiovascular diseases (CVDs). This is due to their ability to quench singlet oxygen molecules and scavenge free radicals such as Reactive Oxygen Species (ROS) and Reactive Nitrogen Species (RNS) [6]. These free radicals in our body cause oxidative damage of the cells and are responsible for the onset of several degenerative diseases [[7], [8], [9], [10]].
Higher cost of production of natural pigments can be reduced by the use of microorganisms in the synthesis of bio colorants. Among the natural sources, pigment-producing microorganisms are the most efficient candidates to meet the challenges related to the cost and stability. According to Joshi et al. microbial pigments are beneficial over plant pigments due to their availability, higher yield, cost efficiency and convenient down streaming [11]. Similar to plant pigments, colors from microbial sources also possesses anti-inflammatory, antioxidant, anticancer and antimicrobial properties [12].
Carotenoids are primarily produced by several species of yeasts and filamentous fungi. Few bacterial strains along with algae and lichens also produce carotenoids. The variety of colors obtained from microbial sources is far beyond the limits of chemical synthesis and conventional extraction. The important microorganisms in the synthesis of natural pigments are Monascusroseus producing canthaxanthin (orange, red), Blakesleatrispora, Dunaliella salina, Mucor, Neurospora crassa producing β-carotene (orange-yellow), Rhodotorula glutinis, Rhodotorula mucilaginosa producing variety of carotenoids (orange), Fusarium sporotrichioides producing lycopene (red), Asbhya gossypi producing riboflavin (yellow), Agrobacterium aurantiacum producing astaxanthin (pink-red) etc.
Carotenoids producing yeasts are unicellular eukaryotes generally found in soil, water bodies, or on plants, animals, and manmade habitats [13,14]. These yeasts are well known for synthesis of commercially valued carotenoids such as astaxanthin, β-carotene, torulene, and torularhodin. Advancements in the fermentation technologies have made the pigment synthesis easier and convenient. Rhodotorula species are known for higher yield of carotenoids due to unicellular nature and higher growth rate. Rhodotorula mucilaginosa have been found to synthesize torulene, β-carotene and torularhodin which are of industrial interest. The advanced biotechnological processes aim to increase the yield of carotenoids by using low cost agro-industrial waste rich in balanced nutritional composition. Current research was undertaken to explore the potential of four agro-industrial waste materials (Onion Peels = OP, Potato Skin = PS, Mung Bean Husk = MBH and Pea Pods = PP) for carotenoids production and to optimize the fermentation parameters to further improve the yield by using yeast strain Rhodotorula mucilaginosa (MTCC-1403).
2. Material and methods
2.1. Microbial culture
The yeast strain Rhodotorula mucilaginosa MTCC-1403 was procured from Institute of Microbial Technology (IMTECH), Chandigarh. The microorganism was cultured on Yeast Malt Extract (YME) agar plates and incubated for 48 h at 25 °C. Plates were stored at 4 °C and thereafter subculturing was done after every 15 days. Among agro wastes mung bean husk was purchased from local dhal mill, other wastes were collected from Panjab University canteen and hostel kitchens. All the analytical grade chemicals were purchased from Himedia, Mumbai, India.
2.2. Optimization of carbon and nitrogen sources from agro-industrial waste origin
To elucidate the potential of agro-industrial waste for carotenoids production by yeast strain Rhodotorula mucilaginosa, onion peels and potato skin as carbon sources, because of high concentration of sugar, and mung bean husk and pea pods as nitrogen sources, because of high nitrogen concentration (presented in Table 2), were used for investigation. The optimization was done to obtain the maximum yield of carotenoids and biomass content. All the raw materials except mung bean husk were washed and dried at 65 °C for 48 h followed by grinding and sieving to obtain uniform particle size. Mung bean husk was ground without giving washing treatment. Different combinations of carbon and nitrogen sources (OP + MBH, OP + PP, PS + MBH, PS + PP) were made using agricultural wastes in 1:1 ratio. These wastes were prepared by two methods, aqueous extraction and acidic extraction according to the method described by Nancib et al. with little modifications [15]. The prepared powders of carbon and nitrogen sources from agricultural waste materials were taken in equal amounts and aqueous extracts were prepared using distilled water at a ratio of 5:1 (Distilled water: Agricultural waste powder mix). After sterilization (121 °C, 15 psig pressure for 15 min), the mixture was filtered through a muslin cloth and centrifugation was carried out at 10,000 rpm for 15 min. Acidic extracts, were prepared by degrading the cellulose content to obtain more available sugars and hydrolyzed proteins by chemical treatments. In this case, the extraction was done in a similar method as that of aqueous extract except by replacing the distilled water with 1 M HCl solution at a ratio of 5:1 (1 M HCl: Agricultural waste powder mix). The clear supernatant was used as substrate for fermentation. Required pH (design shown in Table 1) of prepared extracts was adjusted with 1 M HCl and 1 M NaOH solution. Fermentation was carried out in shake flask in Refrigerated incubator shaker (Model Innova 4230, New Brunswick) Total reducing sugars and protein content were analyzed before fermentation.
Table 2.
Total sugars and protein content of agro-industrial wastes.
| Agro-Industrial waste | Sugar Content (mg/g) | Protein Content (mg/g) |
|---|---|---|
| Onion peel powder | 851.33 ± 4.62a | 165.10 ± 5.13b |
| Potato skin powder | 845.10 ± 3.87a | 111.87 ± 2.22d |
| Mung bean Husk | 327.78 ± 2.08c | 262.23 ± 3.59a |
| Pea pods powder | 414.30 ± 3.60b | 144.77 ± 2.60c |
| CD (p < 0.05) | 6.891 | 6.719 |
| CV (%) | 0.6 | 2.087 |
Results are represented as mean ± standard deviation. Means with different superscripts in a column differ significantly (p<0.05).
Table 1.
Process variables used in the central composite design for three independent variables.
| Process variables | Code | Variable level codes |
||||
|---|---|---|---|---|---|---|
| −1.682 (-α) | −1 | 0 | 1 | +1.682 (+α) | ||
| pH | A | 4.32 | 5 | 6 | 7 | 7.68 |
| Temperature (ᴼC) | B | 16.59 | 20 | 25 | 30 | 33.41 |
| Agitation (rpm) | C | 59.54 | 80 | 110 | 140 | 160.45 |
2.3. Optimization of pH, temperature, and agitation using Response Surface Methodology (RSM)
Once the critical variables were screened, Response Surface Methodology (RSM) was considered to design the experiments using Statistical Package Design-Expert version 1.0 (Statese Inc., Minneapolis, MN, USA). The objective was to optimize the independent factors (pH, temperature, and agitation) to maximize the yield of carotenoids and biomass using Central Composite Design (CCD). The independent variables and the variation levels are shown in Table 1. The dependent responses estimated in the study were total Carotenoids (μg/g), dry cell weight (g/L) and color of pigment produced in terms of L*(black to white), a*(red to green), and b*(yellow to blue).
The experiments were carried out in triplicates, which was necessary to estimate the variability of the measurements. The relationship between the independent factors and dependent responses was calculated by using quadratic polynomial Eq. (1) as shown below
| (1) |
Where X0 represents the value for the fixed response at the central level of the experiment and βi, βii, and βij are the linear, quadratic and cross product coefficients respectively. Total of 20 runs were obtained from CCD model and the experimental data were statistically analyzed using multiple linear regression method. Three-dimensional graphs and contour plots were generated using response surface methodology. The models were fitted with experimental data and regression coefficients were obtained. Analysis of Variance (ANOVA) tables were generated for each of the response functions.
2.4. CHNS analysis
In the elemental analyzer of Thermofinnigan Surveyor Instrument, estimation of Carbon, Hydrogen, Nitrogen, and Sulphur was done for carbon and nitrogen sources from agricultural waste origin i.e. Onion Peel (OP) Powder and Mung Bean Husk (MBH). The particle size of the raw material was less than 1 mm and 1 mg sample was used for estimation. The results were expressed as percentage or g/100 g.
2.5. Estimation of reducing sugars
Reducing sugar content of media was estimated according to the method suggested by Miller. 0.5 mL media was diluted with an equal amount of distilled water followed by the addition of 1 mL of 3, 5-dinitrosalicylic acid (DNSA) reagent. The mixture was incubated in a boiling water bath at 100 °C for 10 min followed by cooling at room temperature. The samples were further diluted with 2.5 mL of distilled water and the contents were thoroughly mixed by vortexing. Absorbance was measured at 540 nm using an UV-Vis Spectrophotometer (UV-2401 PC, Shimadzu, Kyoto, Japan) [16]. Reducing sugar content was expressed as g/L and was estimated from the standard curve of dextrose prepared in the range of 0–1.0 mg/mL.
2.6. Estimation of total soluble protein
Protein content of media was analyzed by Lowry's method according to Lowry (1951). 1 mL of media was added to 5 mL working solution (98 mL of 2% NaCO3 in 1 N NaOH+ 1 mL 1% CuSO4 + 1 mL of 1% Na-K tartarate). The mixture was incubated for 10 min at 37C then 1 mL of 1:1 Folin Cio-calteau reagent was added and incubated at 37°C for 30 min then absorbance was measured at 680 nm using an UV-visible spectrophotometer (UV- 2401 PC, Shimadzu, Kyoto Japan) [17]. The protein content was expressed as g/L and was estimated using a standard curve made with Bovine Serum Albumin (BSA) in the range of 0−200 μg/mL.
2.7. Extraction of carotenoids
Carotenoids extraction was carried out in accordance with the method suggested by Yadav and Prabha with slight modification [18]. 50 mL culture media was taken and centrifuged at 10,000 rpm for 10 min. The cells were washed with distilled water twice. Collected cell pellets were disintegrated in 1 M HCl solution (1:10) in a water bath at 60 °C for 10 min. The mixture was cooled at 4 °C for 10 min. Then cells in the acidic medium were centrifuged at 10,000 rpm for 10 min. Extraction was carried out with 10 mL acetone added to the disintegrated cells. The process was repeated until the cells were grey in color. The solvent was pooled and further analysis was carried out for estimation of the total carotenoids.
2.8. Dry cell mass
After the complete process of carotenoids extraction, the dry cell weight was determined by washing the cells thoroughly with distilled water (twice) and then drying at 50 °C till constant weight was achieved. After drying, the weight of the cells was calculated and was expressed as g/L.
2.9. Estimation of total carotenoids
2.9.1. UV-Visible Spectrophotometer spectrophotometer
The analysis was done in accordance with the equation used by Cheng and Yang, [19]. Full wavelength scan was carried out to determine the maximum absorbance (λmax). The scanning wavelength range was 300–800 nm. Peaks were observed in the fingerprint region of carotenoids. The maximum absorbance was observed at 490 nm and estimation of total carotenoids was done using following Eq. (2):
| (2) |
Amax - the absorbance at 490 nm.
D - Sample dilution ratio.
V - Volume of extraction solvent (mL).
E - Extinction coefficient of total carotenoids (0.16).
W - Dry weight of yeast (g).
2.9.2. Liquid chromatography-mass spectrometry (LCMS)
Liquid Chromatography-Mass Spectrometry was performed to obtain the mass spectrum of the pigment. Initially, the sample was run for HPLC (Shimadzu Japan) using a C18 reverse phase column [20]. 10 μL of the sample was injected into the column with the aid of a microsyringe and eluted by mobile phase constituting methanol, acetonitrile, and ethyl acetate (76:12:12, v/v). The flow rate was kept constant at 2 mL/min. The PDA detector was set at a wavelength corresponding to the β-carotene (450 nm).
The outflow of LC was connected to thermo LTQ Deca MAX Mass Spectrometer instrument with electrons spray ionization source operated in a positive mode. Mass spectrometry was done using positive and spray mode and mass spectra were recorded under electron impact ionization at 70 eV electron energy with a mass range from 100 to1000 μg at a rate of one scan/second. Liquid Chromatography was performed using C18 column using methanol, acetonitrile and ethyl acetate (76:12:12, v/v) using positive electro spray by time of flight (9.10 kV) technique and mass spectra were recorded under electron impact ionization 70 eV electron energy and mass was recorded in the range of 100−1000 μg [21].
2.10. Color analysis
The color of extracted pigment was analyzed using a Hunterlab colorimeter (Colorflex Hunter Associate Lab, Reston, Virginia USA). The color was determined in terms of L*, a*, and b* values proposed by the International Commission on Illumination (CIE). The Spectrophotometer uses an illuminant D65 at a 10° observer as references [22].
2.11. Bioreactor study
To elucidate the effect of aeration on carotenoids production and biomass, the fermentation was carried out in 3 L stirred tank bioreactor (Biospin 3A Fermenter Bioage Equipments, Mohali, India). To evaluate the effect of aeration, aqueous extract of OP and MBH was used in the bioreactor study.1 M HCl and 1 M NaOH solution were filled in the reagent bottles to maintain the optimum pH throughout the fermentation. Coconut oil was used as an anti-foaming agent and was filled in the similar reagent bottle. To avoid any air particulates entering into the fermenter vessel, the clamp attached to the silicon tubing at the end of the vent of the filter of 0.22 microns was tightened. 3% inoculum was added manually through the inoculum port provided at top of the flange of the vessel under flame. The fermentation was carried out for 120 h and the sample was taken out after every 12 h from the vessel for further analysis. For evaluation of the effect of aeration, the fermentation was carried out at optimum conditions generated by Response Surface Methodology for pH, temperature, and agitation. The pH was kept constant throughout the fermentation at 6.2 at a temperature of 26 ᴼC. The agitation was kept fixed at 120 rpm. The level of aeration provided was constant at 1.0 vvm [23].
2.12. Statistical analysis
The values are represented as the mean of three replications. The results are illustrated as the mean ± standard deviation (SD). The Analysis of Variance (ANOVA) was performed whenever required with the statistical package for the social sciences (SPSS, Inc. USA). Different superscripts were added to the values to elaborate the differences. Means with different superscripts in a column differ significantly at p < 0.05. Critical difference (CD) and Coefficient of Variance (CV) were also determined.
3. Results
3.1. Identification of color by UV–vis spectrophotometer
Identification of the extracted pigment from Rhodotorula mucilaginosa was done by UV–vis spectrophotometric wavelength scan. The sample was run for a scan of wavelength to find the value of λmax in the region 200−800 nm. The typical peaks confirmed the presence of carotenoids in the region of 400−500 nm [21,24]. The wavelength scan of extracted pigment in the region 200−800 nm is shown in Fig. 1.
Fig. 1.

Wavelength scans of extracted pigment by spectrophotometry.
3.2. Composition of agro-industrial waste substrates
It can be clearly observed from the Table 2 that onion peel powder produced the highest sugar content of 851.33 mg/g followed by potato skin powder insignificantly different from onion peel powder. A lower sugar content was seen in mung bean husk and pea pod powder with a significant difference (p < 0.05).
Highest protein content was present in mung bean husk with 262.23 mg/g followed by onion peel powder with 165.10 mg/g. Potato skin powder showed the lowest protein content of 111.87 mg/g. The results obtained for both sugars and protein content of all four agro-industrial waste were found statistically significant at p < 0.05.
Further characterization of selected carbon and nitrogen sources was carried out with CHNS estimation and the results revealed that mung bean husk was composed of 38.508% carbon and 1.218% nitrogen while dried onion peel constituted 41.421% carbon and 1.786% nitrogen. According to the literature published, the adequate carbon to nitrogen ratio is required for the successful fermentation process. Both the lower and higher concentrations of nitrogen affect the fermentation process in one or the other way.
3.3. Optimization of carbon and nitrogen sources
In order to obtain optimum carbon and nitrogen sources, eight combinations of agro-industrial wastes were made. Acidic extract of onion peel and mung bean husk exhibited highest initial sugar concentration of 79.99 g/L followed by aqueous extract of the same combination. From Table 3, it is clearly visible that initial sugar and protein contents of aqueous and acidic extracts were found to be significantly different when tested statistically (p < 0.05). The acidic extracts were found to contain significantly higher sugar contents than aqueous extracts. Aqueous extract of potato skin and mung bean husk depicted the lowest sugar content of 23.81 g/L while acidic extract of this combination depicted higher sugar content of 44.58 g/L. The protein content of acidic extracts was also higher than those of aqueous extract. The highest protein content of 33.54 g/L was observed in the acidic extract of onion peel and mung bean husk followed by their aqueous extract with 28.54 g/L.
Table 3.
Effect of aqueous and acidic extracts of agro-industrial wastes on Total Carotenoids and Dry cell weight after 5-days fermentation.
| Agro-Industrial wastes | Initial Sugar Content (g/L) | Sugar utilization (g/L) | Initial Protein content (g/L) |
Protein utilization (g/L) | Total Carotenoids (μg/g) | Dry Cell Weight (g/L) | L* | a* | b* |
|---|---|---|---|---|---|---|---|---|---|
| Aqueous Extracts | |||||||||
| Onion peel + Mung Bean Husk | 70.70 ± 0.56b | 47.46 ± 3.25b | 28.54 ± 0.83b | 17.81 ± 1.60bc | 710.33 ± 27.87a | 7.22 ± 0.29a | 3.25 ± 0.15bcd | 0.58 ± 0.17a | 1.50 ± 0.31b |
| Onion Peel + Pea Pods | 58.75 ± 0.24d | 41.92 ± 3.33c | 22.04 ± 0.50c | 13.30 ± 0.94d | 583.43 ± 28.21bc | 6.05 ± 0.19bc | 2.62 ± 0.30e | 0.47 ± 0.20ab | 2.26 ± 0.17a |
| Potato Skin + Mung Bean Husk | 23.81 ± 0.54g | 22.55 ± 0.97e | 14.61 ± 1.22e | 8.73 ± 1.02e | 526.77 ± 29.00d | 5.46 ± 0.35d | 3.57 ± 0.06ab | 0.16 ± 0.15bc | 1.32 ± 0.11bc |
| Potato Skin + Pea Pods | 30.80 ± 0.40f | 29.79 ± 1.62d | 18.22 ± 1.56d | 12.47 ± 1.70d | 538.81 ± 18.36cd | 5.66 ± 0.26cd | 3.88 ± 0.30a | 0.01 ± 0.36c | 1.16 ± 0.13bc |
| Acidic Extracts | |||||||||
| Onion peel + Mung Bean Husk | 79.99 ± 1.57a | 54.95 ± 2.09a | 33.54 ± 1.96a | 22.87 ± 1.51a | 717.82 ± 27.64a | 7.34 ± 0.31a | 2.94 ± 0.18de | 0.04 ± 0.28c | 0.98 ± 0.12c |
| Onion Peel + Pea Pods | 70.27 ± 0.73b | 47.33 ± 2.24b | 26.23 ± 2.03b | 20.10 ± 2.33b | 602.45 ± 31.70b | 6.52 ± 0.37b | 3.24 ± 0.12cd | 0.04 ± 0.15c | 1.45 ± 0.27b |
| Potato Skin + Mung Bean Husk | 44.58 ± 0.34e | 30.66 ± 2.18d | 19.84 ± 0.90cd | 16.78 ± 0.84c | 535.19 ± 24.70d | 5.94 ± 0.26cd | 3.81 ± 0.13a | 0.07 ± 0.12c | 1.40 ± 0.26bc |
| Potato Skin + Pea Pods | 62.10 ± 0.72c | 38.72 ± 2.27c | 21.24 ± 1.18c | 17.67 ± 0.69bc | 545.13 ± 28.77cd | 6.10 ± 0.27bc | 3.28 ± 0.12bc | 0.26 ± 0.27abc | 1.40 ± 0.46bc |
| CD (p < 0.05) | 1.296 | 4.082 | 2.37 | 2.468 | 47.238 | 0.502 | 0.325 | 0.391 | 0.441 |
| CV (%) | 1.358 | 6.021 | 5.945 | 8.793 | 4.587 | 4.615 | 5.654 | 110.481 | 17.772 |
Results are represented as mean ± standard deviation.
Means with different superscripts in a column differ significantly (p<0.05).
Similar to sugar content, the lowest protein concentration was seen in the case of potato skin and mung bean husk. Both the aqueous and acidic extract of this combination exhibited lower protein and sugar contents although significantly different from each other. The fermentation of all these combinations was carried out at pH 6 at 25 ᴼC with agitation of 110 rpm.
The maximum carotenoid content was obtained for an acidic extract of onion peel and mung bean husk with 717.82 μg/g followed by its aqueous extract (710.33 μg/g) with an insignificant difference. Similarly, in case of dry cell weight, acidic extract of onion peel and mung been husk exhibited a higher value of 7.34 g/L from aqueous extract with 7.22 g/L but was found insignificantly different during statistical analysis (p < 0.05). The variation in color parameters (L*, a*, and b*) concluded that with an increase in carotenoids content of the extracted pigment, the lightness and intensity also increased. Positive a* represents redness of the sample and positive b* is an indication of yellowness of the extracted color. The increase in b* value reflects lightening of the pigment hindering the effect of a* i.e. redness of the color.
3.4. Effect of fermentation conditions (pH, temperature, and agitation) on dependent factors using Central Composite Design (CCD)
3.4.1. Impact of independent variables on total carotenoids and dry cell weight
The combined effect of three independent variables on carotenoids production and dry cell weight was determined using quadratic polynomial equation under Central Composite Design of Response Surface Methodology (RSM). The results were analyzed using ANOVA i.e. Analysis of Variance (Table 4). The p-values were used as a tool to confirm the significance of the model and other fermentation variables.
Table 4.
RSM model interpretations of different variables.
| Total Carotenoids |
Dry Cell mass |
L* |
a* |
b* |
|||||||||||
|---|---|---|---|---|---|---|---|---|---|---|---|---|---|---|---|
| Coeff. | F value | p value | Coeff. | F value | p value | Coeff. | F value | p value | Coeff. | F value | p value | Coeff. | F value | p value | |
| Model | 708.46 | 114.12 | 0.000 | 7.26 | 56.82 | 0.000 | 0.55 | 76.76 | 0.000 | 1.75 | 31.75 | 0.000 | 0.96 | 46.92 | 0.000 |
| A | 14.50 | 17.82 | 0.002 | 0.14 | 6.93 | 0.025 | 0.00 | 0.00 | 0.998 | −0.13 | 8.95 | 0.014 | 0.02 | 2.92 | 0.118 |
| B | 19.66 | 32.76 | 0.000 | 0.19 | 13.03 | 0.005 | 0.23 | 15.18 | 0.003 | −0.05 | 1.29 | 0.283 | −0.03 | 6.47 | 0.029 |
| C | 36.94 | 115.71 | 0.000 | 0.31 | 36.21 | 0.000 | 0.17 | 8.63 | 0.015 | −0.09 | 4.42 | 0.062 | 0.13 | 159.77 | 0.000 |
| AB | −6.37 | 2.02 | 0.186 | −0.13 | 3.39 | 0.095 | −0.07 | 0.89 | 0.368 | 0.16 | 7.79 | 0.019 | −0.14 | 106.84 | 0.000 |
| AC | 4.45 | 0.98 | 0.345 | 0.10 | 2.28 | 0.162 | 0.11 | 1.87 | 0.202 | 0.00 | 0.00 | 0.950 | 0.05 | 15.02 | 0.003 |
| BC | 20.36 | 20.59 | 0.001 | 0.19 | 7.44 | 0.021 | 0.09 | 1.45 | 0.256 | −0.03 | 0.29 | 0.600 | −0.11 | 62.99 | 0.000 |
| A2 | −56.29 | 283.46 | 0.000 | −0.59 | 134.73 | 0.000 | 0.92 | 260.06 | 0.000 | −0.38 | 76.76 | 0.000 | 0.07 | 52.66 | 0.000 |
| B2 | −63.01 | 355.21 | 0.000 | −0.81 | 259.82 | 0.000 | 0.63 | 123.04 | 0.000 | −0.34 | 63.69 | 0.000 | 0.03 | 7.30 | 0.022 |
| C2 | −63.77 | 363.79 | 0.000 | −0.58 | 130.70 | 0.000 | 1.14 | 398.25 | 0.000 | −0.56 | 169.88 | 0.000 | 0.04 | 18.31 | 0.002 |
The regression analysis conducted for the fitting of experimental data.
The quadratic design fitted on total carotenoids was found to be significant from F-test and p-value. The total carotenoids content was observed to be varying between 457.17 μg/g and 719.69 μg/g (Fig. 2). The Model F-value of 114.12 implies that the model is significant. There is only a 0.01% chance that an F-value this large could occur due to noise. The regression analysis conducted for befitting of experimental data resulted in an appraising value of the coefficient of determination, R2 = 0.9904. The "Predicted R-Squared" of 0.9425 was in reasonable agreement with the "Adjusted R-Squared" of 0.9817; i.e. the difference is less than 0.2.
Fig. 2.

Response surface plots for yield of total carotenoids (a) temp-pH, (b) agitation-pH, & (c) agitation-temp and dry cell weight (d) temp-pH, (e) agitation-pH, & (f) agitation-temp and actual vs predicted response plots for (g) total carotenoids (h) dry cell weight.
Non-significant lack of fit is good as the target is a model to be fitted. Eq. (3) represents the effect of fermentation variables in the anticipated design of total carotenoids and is coded with A = pH, B = temperature, and C = agitation.
| Total Carotenoids = 708.456 + 14.4973*A + 19.6567*B + 36.9422*C -6.37378*AB + 4.44628*AC + 20.3588*BC + -56.2862*A2-63.009*B2-63.7656*C2 | (3) |
Environmental conditions significantly affected the carotenoid production (Fig. 2a-c). The results were found maximum near the coded ‘0’ level i.e. central points of pH and temperature. The concentration of carotenoids increased from ‘-1’ to ‘0’ levels and then declined was noted while reaching to ‘+1’ coded level. However, agitation was observed optimum between ‘0’ and ‘+1’ levels. Responses at different independent variables are shown in Table 5.
Table 5.
Effect of fermentation conditions on responses of extracted pigment after 5 days of fermentation.
| Fermentation variables |
Responses |
|||||||
|---|---|---|---|---|---|---|---|---|
| Run | A: pH | B: Temperature | C: Agitation | Total carotenoids (μg/g) | Dry Cell Weight (g/L) | L* | a* | b* |
| 1 | 6 | 25 | 110 | 703.79 | 7.06 | 0.54 | 1.72 | 0.96 |
| 2 | 7.681 | 25 | 110 | 564.68 | 6.01 | 3.01 | 0.24 | 1.23 |
| 3 | 5 | 20 | 80 | 476.39 | 5.03 | 2.78 | 0.91 | 0.81 |
| 4 | 6 | 25 | 110 | 713.74 | 7.24 | 0.65 | 1.91 | 0.94 |
| 5 | 5 | 20 | 140 | 503.30 | 4.91 | 2.67 | 0.6 | 1.21 |
| 6 | 6 | 25 | 110 | 693.58 | 7.51 | 0.38 | 1.72 | 0.96 |
| 7 | 6 | 16.591 | 110 | 493.46 | 4.59 | 2.15 | 0.82 | 1.04 |
| 8 | 7 | 30 | 80 | 499.49 | 4.91 | 3.13 | 0.75 | 0.84 |
| 9 | 5 | 30 | 140 | 600.00 | 6.05 | 3.57 | 0.23 | 1.17 |
| 10 | 7 | 20 | 140 | 551.43 | 5.59 | 3.28 | 0.31 | 1.59 |
| 11 | 6 | 25 | 110 | 712.92 | 7.18 | 0.66 | 1.62 | 0.98 |
| 12 | 6 | 25 | 160.453 | 578.71 | 6.13 | 4.20 | 0.04 | 1.29 |
| 13 | 6 | 25 | 110 | 719.69 | 7.30 | 0.66 | 1.62 | 1.01 |
| 14 | 5 | 30 | 80 | 494.64 | 5.14 | 3.23 | 0.41 | 1.23 |
| 15 | 6 | 25 | 59.546 | 457.17 | 5.02 | 3.57 | 0.23 | 0.88 |
| 16 | 4.318 | 25 | 110 | 513.51 | 5.09 | 3.52 | 1.07 | 1.11 |
| 17 | 7 | 30 | 140 | 625.63 | 5.94 | 3.81 | 0.33 | 1.02 |
| 18 | 7 | 20 | 80 | 509.73 | 5.01 | 2.89 | 0.35 | 1.01 |
| 19 | 6 | 33.408 | 110 | 546.70 | 5.22 | 2.75 | 0.68 | 1.04 |
| 20 | 6 | 25 | 110 | 710.50 | 7.31 | 0.35 | 1.91 | 0.94 |
The model F-value of 56.82 for dry cell weight implies that the model is significant. There is only a 0.01% chance that large F-value could occur due to noise. The dry cell weight was found to be in the range from 4.49 to 7.51 g/L (Fig. 2d-f).
Eq. (4) explains the result of regression model design for the combined effect of independent variables on dry cell weight
| Dry Cell Weight = 7.26357 + 0.136726*A + 0.187417*B + 0.312428*C -0.125*AB + 0.1025*AC + 0.185*BC -0.58671*A2-0.814751*B2-0.577871*C2 | (4) |
The interaction of pH and temperature have shown negative but non-significant (p > 0.05) effect on the dry cell weight of microorganism (Fig. 2d). Adequate precision measures the signal to noise ratio. Since a ratio greater than 4 is considered desirable for better fitting of the model, thus, in this case, the ratio of 19.307 indicates an adequate signal. Actual vs predicted response plots are shown in Fig. 2g and h for total carotenoids and dry cell weight respectively. Both the graphs following a pattern indicating non-significant value of model
3.4.2. Impact of independent variables on Color parameters (L*, a*, and b*)
The regression analysis was performed for L*. The mathematical fitting of the experimental data resulted in a remarkably significant value of model with p < 0.0001. The quadratic design fitted was found to be significant from the F-value of 76.76.The chance of such high F-value occurring due to noise was only 0.01%. Among the independent variables, the effect of pH on L* value of extracted pigment was not significant (p < 0.05). Fig. 3a to i showed interactions among each pair of independent fermentation condition i.e. AB, AC, BC on color responses (L*. a* and b*) were also observed as not significant with p-value higher than 0.05 (Table 4). The a* value is representative of green to the red index of the color to be measured. Negative a* corresponds to green color which moves towards reddish color as the value increases after zero towards the positive end (Fig. 3). Carotenoids have a high correlation with positive a* value as the majority of them display orange, red and yellow color (Fig. 3d-f). The model was found to be significant from F-test and p-value for a*. The p < 0.0001 for model illustrates remarkable significance.
Fig. 3.

Response surface plots for effect on L* (a) temp-pH, (b) agitation-pH, & (c) agitation-temp, a* (d) temp-pH, (e) agitation-pH, & (f) agitation-temp and b* (g) temp-pH, (h) agitation-pH, & (i) agitation-temp.
3.4.3. Effect of aeration on fermentation
Rhodotorula mucilaginosa is aerobic yeast and thus provision of oxygen during the fermentation process is a mandatory requirement. The demand for oxygen during fermentation can be satisfied with the combined effect of aeration and agitation. As agitation is important for adequate mixing and heat and mass transfer, similarly aeration is necessary to maintain the appropriate oxygen level to fulfill the oxygen demand of the microorganism. Effect of aeration and agitation keeps the homogeneous chemical and physical composition throughout the bioreactor. The initial sugar content in the agro-industrial waste media was 70.28 g/L. A gradual decrease was seen in the sugar content during the fermentation process. There was only 3.78 g/L sugar left behind at the end of 120 h of fermentation. The utilization of sugar after intervals of every 12 h is shown in Fig. 4a. It was observed that the rate of sugar consumption was slower in the first 12 h (lag phase) which increased significantly afterward to 84 h (log phase). The change in the sugar content after 84 h was not very significant. The utilization of protein content during the fermentation process followed a similar trend to that of sugar content. However, there was no complete depletion of a protein at the end of the fermentation. The objective of carrying out fermentation in the batch fermenter was to evaluate the effect of aeration. The maximum amount of carotenoids obtained in aerobic fermentation conditions was 819.23 μg/g in comparison to 717.35 μg/g in shake flask under similar conditions. The rate of production of carotenoids was slower in the first few hours of fermentation when the organism was in lag phase which afterward increased linearly upto 84 h (log phase). After 84 h, the change in carotenoid content and cellular mass became almost negligible. The results revealed that aeration is a crucial factor for the growth of Rhodotorula mucilaginosa as there was the elevation of approximately 100 μg/g when the air was introduced in the system. This was due to the improvement in the mass transfer characteristics in terms of the substrate (agro-industrial waste), product (carotenoids) and oxygen. Aeration resulted in the better mixing of the fermentation broth which helped to maintain a concentration gradient between the inner and outer environment of the cell. This concentration gradient played very significant role i.e. it improved the diffusion process which facilitated the intake of sugars and other nutrients by the cells and removal of gases and other by-products from the cells.
Fig. 4.

(a) Time course of carotenoids production by Rhodotorula mucilaginosa using agro-industrial waste. (b) Mass spectrum of Extracted pigment i) 50−500 m/z and ii) 100−1400 m/z.
3.4.4. Liquid chromatography-mass spectrometry (LC–MS)
The results of liquid chromatography revealed the presence of β-carotene at a retention time of 3.48 min. Mass spectrum of extracted pigment confirmed the presence of some other carotenoids along with β-carotene. The peak present at 546.52 m/z was in resemblance to phytoene, a carotenoid under the category of carotenes. Another peak at 379 m/z illustrated the presence of 10´-apo-beta-caroten-10´-ol (Fig. 4 b).
4. Discussion
According to the previous report, this region of 400−500 nm is considered as the fingerprint region of Carotenoids [21]. The major sharp peaks were observed at 450 nm and 480−490 nm. Molline et al. reported the presence of three major carotenoids in the pigment extracted from Rhodotorula mucilaginosa [24]. These carotenoids exhibited λmax at 490 nm (Torularhodin), 484 nm (Torulene) and 450 nm (β-carotene). As the major carotenoid in extracted pigment was found to be torularhodin evident from the sharp peak at 490 nm, the entire further estimations for calculation of total carotenoid content were made by measuring absorbance at 490 nm. Cheng et al. have also reported the λmax at 490 nm for estimation of carotenoid content in pigment extracted from Rhodotorula mucilaginosa [19].
Lower nitrogen content may result in nutritional deficiency leading to a decline in the product yield while higher concentration results in higher cellular mass causing a disturbance in microbial pathways [25].
The pH of aqueous extracts was in the range of 5–5.4 while the pH of acidic extracts was varying between 4 and 4.5. In order to set the pH to 6, more quantity of alkali was added to the acidic extracts which upon heating during autoclaving resulted in the precipitation of proteins.
In order to remove the precipitates from the media to avoid error in biomass calculation, the prepared medium was filtered and precipitates were discarded. Therefore in case of acidic extracts of the agro-industrial waste medium, an additional autoclaving process was required which is economically inefficient in comparison to an increase in insignificant carotenoid content from aqueous extracts. Both the sugars and the proteins were utilized more from the acidic extracts as compared to the aqueous extracts because of difference in initial concentrations. The maximum sugar content (54.95 g/L) and protein content (22.87 g/L) was utilized from the acidic extract of onion peel and mung bean husk.
Aksu and Eren investigated the effect of molasses sucrose and whey lactose on carotenoids production by Rhodotorula mucilaginosa and reported that the use of such agricultural waste as carbon source proven to be the cheap substrate. 89.0 mg/L carotenoids were produced using 20 g/L of molasses sucrose [26]. They also reported that an increase in sugar concentration resulted in an increment in the growth of yeast and the formation of carotenoids. The effect of various fermentation conditions such as temperature, pH, aeration rate, initial sugar, ammonium sulphate concentration, and activators (cottonseed oil and tween 80) was also evaluated on the growth of carotenoids. It was reported in the results that pH value not only influenced the biosynthesis activity of microorganism but it also showed a significant effect on growth rate.
The effect of aqueous and acidic extracts on carotenoids content and biomass was found similar to the report of Bagy et al. who argued that carotenoid production by Rhodotorula glutinis was slightly higher in case of acidic extracts than aqueous extracts. Onion waste represented the most efficient carbon source for β-carotene production (27.4 mg/L) among ten plant wastes investigated [27]. Under the optimum conditions of pH 5.91, temperature 30.3 ᴼC, agitation 258 rpm, the yeast was able to produce a cell mass of 10.35 g/L with the carotenoid content of 3.48 mg/L.
Malisorm and Suntornsuk optimized the cultivation conditions by face-centered central composite design by Rhodotorula glutinis using fermented radish brine as the sole substrate. Under the optimum conditions (pH 6, temperature 30 ᴼC and DO 80%), the yeast produced 2.7 g/L biomass and maximum β-carotene after 24 h of fermentation [28].
CCD design was adopted to optimize the β-carotene production by Serratiamar cescens reporting sucrose (2.5 g/L), peptone (7.8 g/L) at pH-6.7 to be the optimum conditions [29]. Cheng and Yang (2016) investigated the effect of fermentation variables on the yield of carotenoids. The optimum conditions for the production of β-carotene, torularhodin and torulene by Rhodotorula mucilaginosa using waste ketchup, sugar cane molasses and health drink were found to be 25 ᴼC temperature at pH of 5.0. Cell growth of 8.06 g/L was maximum at 22ᴼC and presented no significant difference till 28 ᴼC [19]. On the contrary, Aksu and Eren, observed that specific cell growth rate increased to 30ᴼC followed by a sharp decline afterward [26].
The insignificant “Lack of fit” is clear from F-vale of 2.07 with p = 0.221 (p > 0.05). The coefficient of variation during regression analysis was calculated by the model as 18.70%. The effect of temperature and agitation on a* value was found to be insignificant (p > 0.05), while pH has illustrated the remarkable significant effect. b* value of the CIELab system indicates the blue to the yellow region in the three-dimensional color space cube. The suggested quadratic model for b* was found significant by F-test and p-value. The model p-value of <0.0001 at F value of 46.92 indicates that the model was statistically significant. The effect of concentration of carotenoids on b* values was found significant. Higher concentration of carotenoids increased the positive a* and b* values of extracted pigment. However, the relationship between a* and b* values is rather complex to explain from the model.
The results obtained from aerobic fermentation process were found to be similar to the report of Mantzouridou et al. [30]. They also reported that low impeller speed with a high ratio of aeration enhanced the concentration of β-carotene from Blakeslea trispora. The higher cell mass with the effect of air incorporation was also confirmed in the same study. Garcia et al. have reported that consumption of oxygen by microorganism and oxygen mass transfer from gas to the aqueous phase of the medium has a decisive significance [31]. The oxygen transfer is the controlling step in many processes for adequate growth of the strain and production of the target compound. For aerobic organisms like Rhodotorula mucilaginosa, oxygen is the key substrate for growth and other metabolic processes like synthesis of target compounds.
The peak at 3.02 min in LC spectrum of extracted microbial pigment indicated the probability of the presence of lutein. Rivera et al. have summarized the m/z values for different carotenoids and according to that data, peak at 339 m/z was due to phytoene, 346 m/z corresponded to β-Apo-8’-carotenal, 475 m/z and 550 m/z confirmed the presence of lutein, and peaks at 467 m/z and 549 m/z were due to α-carotene and canthaxanthin respectively.
Molline et al. reported that major carotenoid produced by Rhodotorula mucilaginosa was torularhodin contributing about 60–80 % of total carotenoids followed by β-carotene (10–20 %) and torulene [24]. Thin layer chromatography of extracted pigment revealed the presence of three major carotenoids as β-carotene, torulene and torularhodin out of which the highest concentration was of torulene [19].
From LCMS result of extracted pigment, it can be clearly concluded that it consisted of a mixture of several carotenoids. This can be explained on the basis of synthesis of pigment as pigments from Rhodotorula species are synthesized by the mevalonate pathway. Mevalonic acid gets transformed in phytoene leading to the further synthesis of individual carotenoids like β-carotene, torulene, and torularhodin. The proportion of each carotene varies with minor changes in strain and culture conditions [32].
Sporobolomyces roseus responded to the effect of aeration by shifting from predominant β-carotene to torularhodin and torulene. The impact of air incorporation during fermentation resulted in the biosynthetic switch at the γ-carotene branch point of carotenoid biosynthesis [32].
5. Conclusion
From the optimization results it was found that Onion peels and mung bean husk (Agro-Industrial by-products) are potential cheap substrates for production of carotenoids using Rhodotorula mucilaginosa (MTCC-1403) and synthesized more than one carotenoids in pigment i.e. β-carotene, phytoene, torulene and torularhodin. The optimum conditions to obtain maximum carotenoids from agro-industrial waste sources were found pH of 6.1 at an incubation temperature of 25.8 °C with agitation of 119.6 rpm for 84 h and produced 717.35 μg/g of β-carotene, 7.33 g/L cell mass, L*, a* and b* values were 0.799, 1.622, 1.004 respectively. Aeration plays a significant role in carotenogenesis from Rhodotorula mucilaginosa using agro-industrial waste as substrate. The maximum amount of carotenoids obtained in aerobic fermentation conditions was 819.23 μg/g in comparison to 717.35 μg/g in shake flask under similar conditions.
Author statement
This is to certify that first author Mr. Rajan Sharma has done experiment and written first draft and corresponding author modified and edited the text.
Ethical statement
This article does not contain any studies with human participants or animals performed by any of the authors.
Declaration of Competing Interest
None.
Acknowledgement
Authors are thankful to DST Promotion of University Research and Scientific Excellence (PURSE) II, Panjab University, Chandigarh and Technical Education Quality Improvement Programme (TEQIP) II & III, Dr. S.S. BUICET, Panjab University, Chandigarh for financial support.
References
- 1.Corol D.I., Dorobantu I.I., Toma N., Nitu R. Diversity of biological functions of Carotenoids. Rom. Biotechnol. Lett. 2002;8:1067–1074. [Google Scholar]
- 2.Halliwell B., Gutteridge J.M. Oxford University Press; USA: 2015. Free Radicals in Biology and Medicine. [Google Scholar]
- 3.Krinsky N.I., Landrum J.T., Bone R.A. Biologic mechanisms of the protective role of lutein and zeaxanthin in the eye. Annu. Rev. Nutr. 2003;23(1):171–201. doi: 10.1146/annurev.nutr.23.011702.073307. [DOI] [PubMed] [Google Scholar]
- 4.Del Campo J.A., García-González M., Guerrero M.G. Outdoor cultivation of microalgae for carotenoid production: current state and perspectives. Appl. Biochem. Microbiol. 2007;74(6):1163–1174. doi: 10.1007/s00253-007-0844-9. [DOI] [PubMed] [Google Scholar]
- 5.Olson J.A. Biological actions of carotenoids: introduction. J. Nutr. 1989;119(1):94–95. doi: 10.1093/jn/119.1.94. [DOI] [PubMed] [Google Scholar]
- 6.Choe E., Min D.B. Chemistry and reactions of reactive oxygen species in foods. Crit. Rev. Food Sci. Nutr. 2006;46(1):1–22. doi: 10.1080/10408390500455474. [DOI] [PubMed] [Google Scholar]
- 7.Guaadaoui A., Benaicha S., Elmajdoub N., Bellaoui M., Hamal A. What is a bioactive compound? A combined definition for a preliminary consensus. Int. J. Nutr. Food Sci. 2014;3(3):174–179. [Google Scholar]
- 8.Kaur C., Kapoor H.C. Antioxidants in fruits and vegetables–the millennium’s health. Int. J. Food Sci. Technol. 2001;36(7):703–725. [Google Scholar]
- 9.Rabeta M.S., Chan S., Neda G.D., Lam K.L., Ong M.T. Anticancer effect of underutilized fruits. Int. Food Res. J. 2013;20(2) [Google Scholar]
- 10.Wang S., Melnyk J.P., Tsao R., Marcone M.F. How natural dietary antioxidants in fruits, vegetables and legumes promote vascular health. Food Res. Int. 2011;44(1):14–22. [Google Scholar]
- 11.Joshi V.K., Attri D., Anju B., Bhushan S. Micr pigments. Indian J. Biotechnol. 2003;2:362–369. [Google Scholar]
- 12.Venil C.K., Lakshmanaperumalsamy P. An insightful overview on microbial pigment, prodigiosin. Electronic Journal of Biology. 2009;5(3):49–61. [Google Scholar]
- 13.Rosa C., Peter G. Springer; Berlin: 2006. Biodiversity and Ecophysiology of Yeasts; pp. 370–417. [Google Scholar]
- 14.Casullo de Araújo H.W., Fukushima K., Takaki G.M.C. Prodigiosin production by Serratia marcescens UCP 1549 using renewable-resources as a low cost substrate. Molecules. 2010;15(10):6931–6940. doi: 10.3390/molecules15106931. [DOI] [PMC free article] [PubMed] [Google Scholar]
- 15.Nancib A., Nancib N., Boubendir A., Boudrant J. The use of date waste for lactic acid production by a fed-batch culture using Lactobacillus casei subsp. Rhamnosus. Braz. J. Microbiol. 2015;46(3):893–902. doi: 10.1590/S1517-838246320131067. [DOI] [PMC free article] [PubMed] [Google Scholar]
- 16.Miller G.L. Use of dinitrosalicylic acid reagent for determination of reducing sugar. Anal. Chem. 1959;31(3):426–428. [Google Scholar]
- 17.Lowry O.H., Rosebrough N.J., Farr A.L., Randall R.J. Protein measurement with the Folin phenol reagent. J. Biol. Chem. 1951;193(1):265–275. [PubMed] [Google Scholar]
- 18.Yadav K.S., Prabha R. Production of intracellular carotenoid pigment from wild strains of Rhodotorula. Int. J. Current Microbiol. App. Sci. 2017;6(5):679–683. [Google Scholar]
- 19.Cheng Y.T., Yang C.F. Using strain Rhodotorula mucilaginosa to produce carotenoids using food wastes. J. Taiwan Inst. Chem. Eng. 2016;61:270–275. [Google Scholar]
- 20.Jain A., Thakur D., Ghoshal G., Katare O.P., Shivhare U.S. Microencapsulation by complex coacervation using whey protein isolates and gum Acacia: an approach to preserve the functionality and controlled release of β-Carotene. Food Bioproc. Tech. 2015;8:1635–1644. [Google Scholar]
- 21.Kaur P., Ghoshal G., Jain A. Bio-utilization of fruits and vegetables waste to produce β-carotene in solid state fermentation: characterization and antioxidant activity. Process. Biochem. 2019;76:155–164. [Google Scholar]
- 22.Ghoshal G., Shivhare U.S., Banerjee U.C. Effect of xylanase on quality attributes of whole‐wheat bread. J. Food Qual. 2013;36(3):172–180. [Google Scholar]
- 23.Ghoshal G., Banerjee U.C., Shivhare U.S. Xylanase production by Penicillium citrinum in laboratory-scale stirred tank reactor. Chem. Biochem. Eng. Q. 2014;28(3):399–408. [Google Scholar]
- 24.Moliné M., Libkind D., van M. Microbial Carotenoids From Fungi. Humana Press; Totowa,NJ: 2012. Broock production of torularhodin, torulene, and β-carotene by rhodotorula yeasts; pp. 275–283. [DOI] [PubMed] [Google Scholar]
- 25.del Pilar Anzola-Rojas M., da Fonseca S.G., da Silva C.C., de Oliveira V.M., Zaiat M. The use of the carbon/nitrogen ratio and specific organic loading rate as tools for improving biohydrogen production in fixed-bed reactors. Biotechnol. Rep. 2015;5:46–54. doi: 10.1016/j.btre.2014.10.010. [DOI] [PMC free article] [PubMed] [Google Scholar]
- 26.Aksu Z., Eren A.T. Carotenoids production by the yeast Rhodotorula mucilaginosa: use of agricultural wastes as a carbon source. Process. Biochem. 2005;40(9):2985–2991. [Google Scholar]
- 27.Bagy M.M.K., Abd-Alla M.H., Nafady N.A., Morsy F.M., Mahmoud G.A.E. Bioconversion of plant wastes to β-carotene by Rhodotorula glutinis KU550702. Eur. J. Biol. Res. 2016;6(4):226–241. [Google Scholar]
- 28.Malisorn C., Suntornsuk W. Optimization of β-carotene production by Rhodotorula glutinis DM28 in fermented radish brine. Bioresour. Technol. Rep. 2008;99(7):2281–2287. doi: 10.1016/j.biortech.2007.05.019. [DOI] [PubMed] [Google Scholar]
- 29.Abdelhafez A.A., Husseiny S.M., Ali A.A.A., Sanad H.M. Optimization of β-carotene production from agro-industrial by-products by Serratia marcescens ATCC 27117 using Plackett–Burman design and central composite design. Ann. Agric. Sci. 2016;61(1):87–96. [Google Scholar]
- 30.Mantzouridou F., Roukas T., Kotzekidou P. Effect of the aeration rate and agitation speed on β-carotene production and morphology of Blakeslea trispora in a stirred tank reactor: mathematical modeling. Biochem. Eng. J. 2002;10(2):123–135. [Google Scholar]
- 31.Garcia-Ochoa F., Gomez E., Santos V.E., Merchuk J.C. Oxygen uptake rate in microbial processes: an overview. Biochem. Eng. J. 2010;49(3):289–307. [Google Scholar]
- 32.Buzzini P., Innocenti M., Turchetti B., Libkind D., van Broock M., Mulinacci N. Carotenoid profiles of yeasts belonging to the genera Rhodotorula, Rhodosporidium, Sporobolomyces, and Sporidiobolus. Can. J. Microbiol. 2007;53(8):1024–1031. doi: 10.1139/W07-068. [DOI] [PubMed] [Google Scholar]