Abstract
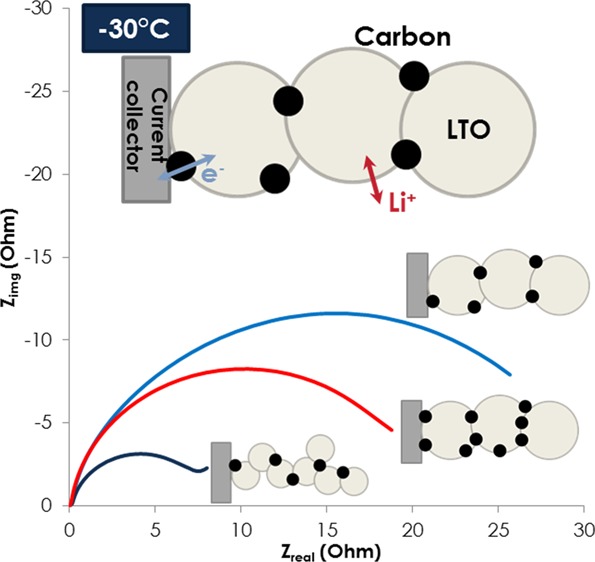
The effect of particle size and electronic percolation on low-temperature power performance in the lithium titanate (LTO) cell is reported. Particle size and carbon contents in negative electrodes are systematically controlled to understand ionic and electronic contribution. The LTO cell with a small particle size, that is, high surface area, showed superior power performance, while additional electronic percolation did not improve the performance at −30 °C when coupled with a lithium manganese spinel cathode. The results are supported by electrochemical impedance spectroscopy measurements, which indicate that smaller LTO particles exhibit lower charge transfer-related impedance and guide rational design and fabrication of electrode architectures at low temperature.
1. Introduction
Lithium-ion batteries based on spinel-structured lithium titanium oxide, Li4Ti5O12 (LTO), have been of significant interest for an alternative anode material especially for high power applications because of operation voltage (1.55 V vs Li/Li+) above electrolyte reduction potentials and lithium plating potential.1,2 Furthermore, intrinsic structural stability and negligible volume change during lithiation and delithiation process enable extremely long cycle life compared to batteries with graphitic anodes.3−5 Fast charging/discharging ability makes LTO attractive for low voltage and high power batteries including 12 V start–stop batteries for vehicle application.
One of the challenges associated with 12 V start–stop application is the ability to start the engine at −30 °C, cold cranking capability,6 as lithium-ion batteries suffer drastic power loss at temperatures below 0 °C. According to United States Automotive Battery Consortium (USABC), battery pack voltage should be higher than 8 V during three 4.5 s pulses (6 kW for 0.5 s followed by 4 kW for 4 s) at −30 °C, simulating the start of cold engine. Research to improve performance of lithium-ion batteries at low temperature has focused on development of highly conductive electrolytes and the use of nanostructured electrodes to facilitate transport of lithium ions between and/or within the electrodes.4,7,8 For example, Amine et al. demonstrated high-power battery with lithium manganese oxide (LMO)/nanostructured LTO (∼10 nm primary nanoparticles on micron size secondary particle) electrodes that outperformed their LMO/graphite counterparts. In addition, LMO/nanostructured LTO cells showed excellent 5 kW cold cranking power performance at −30 °C, where voltage drop after 5 kW 2 s pulse was 0.75 and 1.5 V for LTO and graphite based cells, respectively. The LTO-based cells in the report indeed have attracted attention for potential battery systems for hybrid electric vehicles.4 Pohjalainen et al. also reported the effect of LTO particle size on low-temperature performance, and LTO with high surface area showed improved power capability at −20 °C.8
Despite promising developments of lithium-ion batteries based on LTO anodes, there is limited information in terms of rational design of LTO-based cells such as which electrodes (anode or cathode) limit power capability and rate-limiting processes (either electrons or ions transport) at low temperature. For instance, it is reported that smaller particle size indeed improves low-temperature performance in lithium half-cell, and characterization under full cell configuration is required to fully optimize cell designs.8−10 As such, it is imperative to understand power and energy fading mechanism at low temperature. In general, the poor performance at low temperature is attributed to various factors including increased viscosity and reduced lithium ion mobility in nonaqueous electrolyte, increased charge-transfer related resistance at the electrode and electrolyte interface, and slow diffusion within active material particles. Abraham et al. studied low-temperature behavior of binder and carbon-free cathode materials including LiMn2O4 and LiNi1/3Mn1/3Co1/3O2 when coupled with LTO and reported increase of impedance at low temperature mainly due to sluggish processes at electrode and electrolyte interface where the lithium ions move across the active material and electrolyte interface.11
It is well known that electrode structure and relative concentration of active materials and conductive additives have significant impacts on cell performances because electrochemical reactions involve the transport of lithium ions between the electrodes and the electrolyte, and the transfer of electrons between the current collector and the electrode active materials.12−14 In particular, most of titanium oxides including LTO are electronic insulators with band gaps of around 3–4.0 eV because of the presence of Ti4+ where there is no electron in 3d bands. Doping, carbon-coated on LTO surface or nanostructured LTO allows improved rate capabilities.15−17 Interestingly, it is reported that LTO without any conductive additives outperformed its counterpart, where the formation of highly conductive mixed Ti4+/Ti3+ surface oxidation states at the early state of charge (SOC) allows facile electron transport within electrodes.14,18,19 This example illustrates the importance of electrode formulation along with fundamental understanding of ionic and electronic distribution during electrochemical reactions.
With these in mind, we report herein the effects of physical properties of LTO material (particle size and surface area) and the electronic percolation network on low-temperature performance of LMO/LTO-based cells. We find that LTO with small particle size, in other words, high surface area is crucial to enable high power, while addition of more carbon additive in electrode formulation has only marginal improvement at low temperature. Electrochemical impedance spectroscopic (EIS) results showed significant reduction in charge transfer-related process with smaller LTO particles. This result reveals the importance of charge transport considerations in the vicinity of electrode and electrolyte interface when designing high performance LTO-based batteries.
2. Results and Discussion
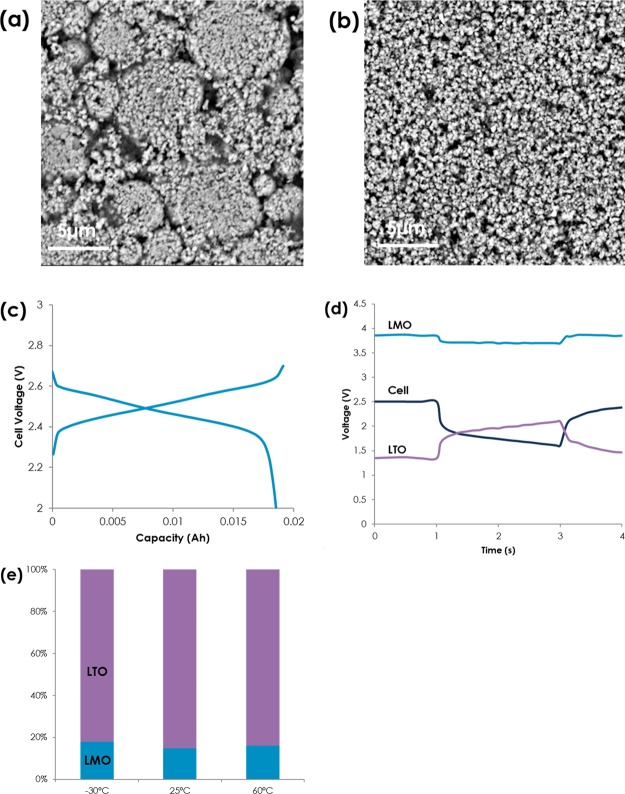
Two different types of commercially available LTO, namely LTO A and LTO B, were used to investigate the effect of physical properties on electrochemical performance. Capacities of LTO A and B are similar, while surface area (4 vs 6.5 m2 g–1) and D50, which means a cumulative 50% point of diameter, (7.1 vs 1.3 μm), are different. Scanning electron microscopy (SEM) of LTO A and LTO B, Figure 1a, confirms physical property of two LTOs. It is worthwhile to note that LTO A is an agglomerate with 100–200 nm primary particles, while LTO B is not; a size of a primary particle is smaller than D50 of LTO B. However, primary particles not in contact with electrolyte are not regarded as electrochemical active area; therefore, LTO B has more reaction sites than LTO A. Single layer pouch cells with 18 mA h LMO/LTO were fabricated, and voltage profiles of the cell (LMO/LTO A) were shown in Figure 1c when cycled between 2.7 and 2.0 V with C/10 current rate. Electrolyte is chosen to be 1.2 M LiPF6 in ester and carbonate mixture that has about three times higher conductivity (∼6 mS cm–1) than conventional carbonate-based electrolyte at −30 °C to ensure that a change in physical properties such as viscosity of liquid electrolyte is ruled out. Area specific resistance (ASR) was calculated via hybrid pulse power capability (HPPC) to deconvolute contribution of cathode and anode during pulsing at various SOCs; a piece of lithium metal was inserted between two electrodes to record the potential of each electrode during the test.20Figure 1d shows voltage response of LMO, LTO, and the cell during 10 C 2 s pulse at about 50% SOC at −30 °C. We found that the contribution of LTO electrode is dominant during the HPPC test, and the impedance is around 80% at wide temperature windows (−30 to 60 °C), as shown in Figure 1e. This result is of particular interest as contribution of LTO was reported to be around 50% when coupled with NMC.21 As such, it stands to reason to optimize LTO electrode to enhance power capability of LMO/LTO-based cell.
Figure 1.
(a,b) SEM images of the electrode made from LTO A and B, (c) voltage profiles of the LMO/LTO cell, (d) voltage responses (cell, LMO, and LTO) at −30 °C during 2 s and 10 C pulse, and (e) impedance contribution of LMO and LTO at −30, 25, and 60 °C.
Cold crank performance of LMO/LTO A at −30 °C are shown in Figure 2a at 50% SOC. The cold crank test is composed of three pulses of ∼16 C for 0.5 s and ∼10.5 C for 4 s with 10 s of rest between pulses, as the inset indicates. These repeated pulses were similar to 6 and 4 kW pulses at the battery level outlined by USABC. The end of voltages at each pulse (V1, V2, and V3) represents power capability of cells, and the higher the end of voltages suggests lower voltage drop, that is, lower impedance. The cells need to maintain a minimum specific potential to be characterized as “passing” cold crank performance test outlined by USABC. Figure 2b,c shows the end of voltages at three pulses with different LTO designs at −30 and 25 °C (Figure S1 contains voltage response as a function of time).
Figure 2.
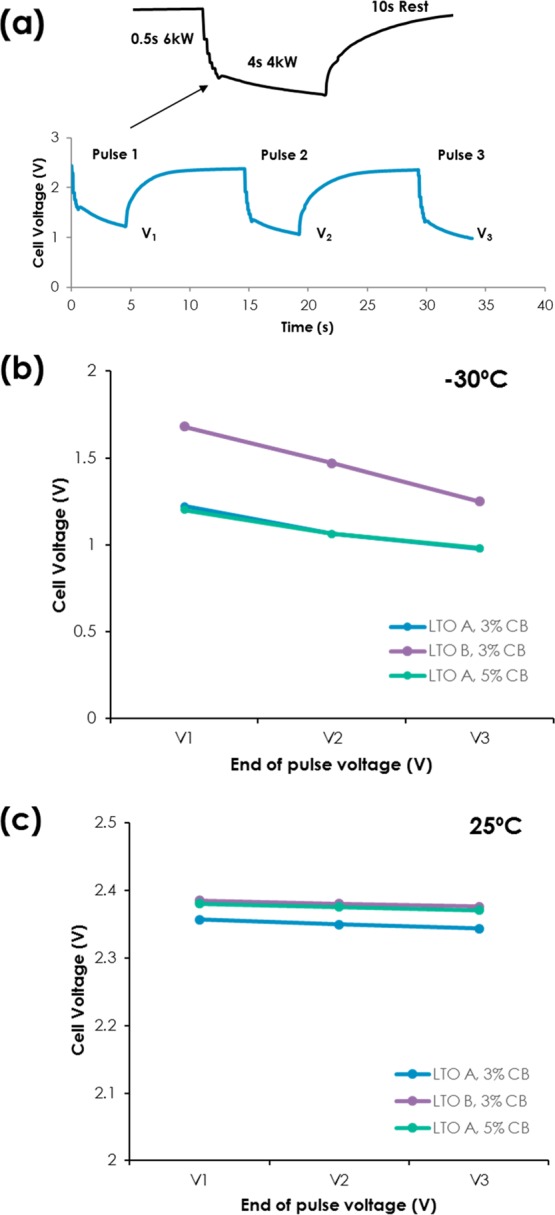
(a) Cold crank response of the LMO/LTO A cell at −30 °C; (inset) one pulse that consists of 0.5 s of scaled 6 kW (∼16 C) and 4 s of scaled 4 kW (∼10.5 C), (b) end of voltages after each pulse of LMO/LTO A 3 wt % carbon black, LTO B 3 wt % carbon black, and LTO A 5 wt % carbon black at −30 °C, and (c) at 25 °C.
It is clear that LTO B outperformed LTO A, and voltage difference during the first 16 C pulse ranges 0.25–0.5 V. The only difference between LTO A and LTO B electrodes is the type of LTO; therefore, enhanced cold crank performance can be attributed to smaller D50 and higher surface area of LTO B. This suggests that shortening the ionic diffusion path is one of the reasons for enhanced low-temperature performance, in particular, lower charge transfer related impedance, which will be discussed further later. To correlate the electronic percolation network with cold crank performance, LTO A with two different carbon additive concentrations (3 and 5 wt %) were prepared. Cold crank results, Figure 2b, showed no significant difference between two samples elucidating that the additional electronic percolation network does not improve rate capabilities at low temperature.
It is worthwhile to note that the trend does not hold at room temperature. Both LTO B with 3% carbon additive and LTO A with 5% carbon additive have less than 10 mV higher end of pulse voltages during three pulses than baseline LTO A with 3% carbon additive, as seen Figure 2c. The fact that smaller particle and more carbon additive have better pulse power capabilities points out that both ionic and electronic play a role at room temperature, while ionic transport becomes dominant at low temperature.
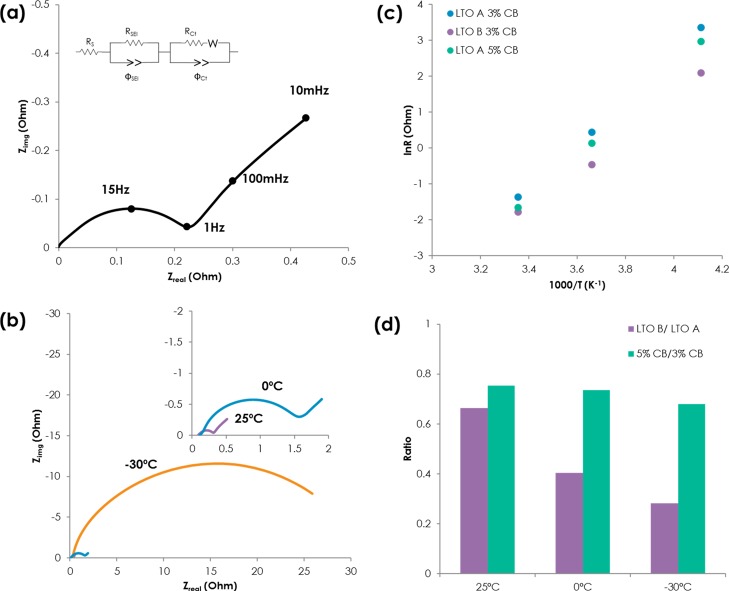
Three LMO/LTO cells were characterized by EIS to understand the underlying mechanism of ionic and electronic contribution at temperature ranges of 25 to −30 °C. Figure 3a shows representative Nyquist spectra of LMO/LTO A with a 3 wt % carbon additive cell between 100 kHz and 0.01 Hz with 5 mV voltage perturbation at 50% SOC. As expected, the spectrum consists of a high frequency intersect, mid frequency (1kHz to 10 Hz) semicircle, and a low frequency (<1 Hz) Warburg tail corresponding to electrolyte impedance and contact resistance, interfacial impedance at the electrode–electrolyte interface, and diffusion processes in the electrolyte and through the active materials particles, respectively.22,23 The EIS spectra were fitted by an equivalent circuit, as shown in Figure 3a.
Figure 3.
(a) Representative Nyquist plot of the LMO/LTO cell (inset: equivalent circuit for fitting), (b) Nyquist plot of LMO/LTO A 3 wt % carbon black at 25, 0, and −30 °C, (c) Arrhenius plot of Rct of samples, and (d) relative Rct ratio of LTO A and LTO B (purple), 3 wt % carbon black and 5 wt % carbon black (green).
The significant increases (0.256–28.95 Ω) in the midfrequency arc upon decreasing the temperature from 25 to −30 °C, indicating an impedance increase at the electrode and electrolyte interface, as seen Figure 3b. Increases in high frequency intercept are relatively small (0.087–0.22 Ω); therefore, contribution of Ohmic impedance is negligible compared to interfacial processes.
Nyquist plots of LMO/LTO A with 3 wt %, LMO/LTO B with 3 wt %, and LMO/LTO A with 5 wt % at 25, 0, and −30 °C are shown in Figure S2. Intercept at x axis of the spectra is adjusted to zero for easy comparison; resistance from bulk electrolyte and ionic resistance in pores from the porous electrode model are the same because thickness of the separator and the electrode porosity/electrode will be similar between samples.24 All of the samples behave similarly; increases in the midfrequency arc is clear, and the size of midfrequency arc decreases with electronic percolation (LTO A 5 wt % carbon additive) and smaller particle size (LTO B 3 wt % carbon additive). Figure 3c shows the Arrhenius plot of charge transfer-related impedance (Rct) and log of Rct with inverse of absolute temperature, which is linear for all samples, suggesting a thermally activated process. Activation energy values of three cells range around 0.42–0.52 eV. In particular, LTO A with 3 and 5 wt % carbon additive have almost the same activation energy, so it appears that electronic percolation decreases impedance values but does not change the nature of interfacial processes in the vicinity of electrode and electrolyte. It is interesting to see that activation energy of LMO/LTO B is lower than LMO/LTO A, and we speculate that ionic contribution becomes smaller with small particle size of LTO B. For all our electrodes, the midfrequency arc arises from interfacial phenomena of electron-transfer kinetics and the transport of ionic species by diffusion or migration across the electrode and electrolyte interface, and it is generally accepted that electronic conduction has lower activation energy than ionic transport in many systems, which might explain lower activation energy with LTO B cells.25 Works are underway to decouple electronic and ionic contribution within cells by building carbon-free electrodes or carbon, binder-free pellet type or thin-film electrodes, as reported before.11,14
Relative ratio of charge transfer impedance is shown in Figure 3d; the ratio of LTO B/LTO A is sensitive to temperature, and it decreases from 0.66 to 0.28 as temperature gets lower because ionic transport becomes sluggish. The ratio of 5 wt % carbon additive/3 wt % carbon additive, on the other hand, is less sensitive to temperature indicating electron transport through carbon additive is not as critical, which confirms the cold crank results shown in Figure 2b.
It is evident from our data that rational design of LMO/LTO-based chemistry for low-temperature applications is to optimize the LTO electrode. Changing the amount of conductive carbon in the electrodes is not likely to improve charge transfer processes with lowering temperature, rather enhancing ionic transport is critical to meet low-temperature requirements of various applications by increasing the electrochemical active area of the active material. With optimized LTO design (D50: 1 μm BET: 8 m2 g–1), a voltage of 1.5 A h LMO/LTO pouch cell is well above Vmin (8 V for battery module, 1.6 V/cell with 5S configuration) during all three cold crank pulses at −30 °C after removing scaled 360 W h (∼40% SOC), as shown in Figure 4. To the best of our knowledge, this is the first successful demonstration of LMO/LTO-based chemistry that passes the cold crank performance test outlined by USABC at relatively low SOC, while state-of-the-art lead acid batteries and graphite-based batteries cannot meet stringent requirements.
Figure 4.
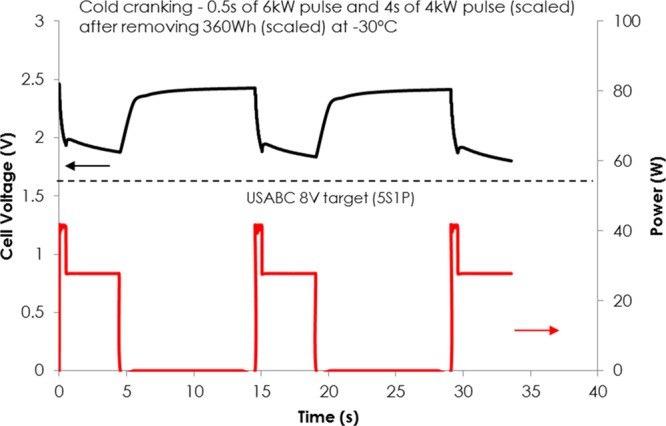
Cold cranking (0.5 s of 6 kW and 4 s of 4 kW pulse) of the optimized cell after removing scaled 360 kW h at −30 °C from a 1.5 A h pouch cell.
3. Conclusions
In conclusion, we investigated the effect of particle size and electronic percolation on low-temperature power capabilities for LTO-based lithium-ion batteries. For an electrode with same carbon additive contents, LTO with smaller particle size has faster ionic transport, while increasing the electronic percolation network has minimal impact on low-temperature performance. We conclude that ionic transport between electrolyte and active materials and/or within the particles controls the rate at low temperature. Our work shows that understanding ionic and electronic contribution can guide the rational design and fabrication of electrode architectures for low temperature.
4. Experimental Section
4.1. Materials and Electrodes
LiMn2O4 (LMO) and Li4Ti5O12 (LTO) were purchased from Posco ESM. Cathode electrode consists of LMO, carbon additive, and polyvinylidene fluoride (PVdF) binder in a weight ratio of 91.3:4.2:4.5 on a 15 μm thick Al current collector. The negative electrode consists of LTO, carbon additive, and PVdF in a weight ratio of 94:3:3 and 92:5:3 on a 15 μm thick Al current collector for 3 and 5 wt % carbon black samples respectively. Each electrode laminate were prepared by mixing a slurry of the oxide, carbon black, and PVdF in N-methyl pyrrolidone with the desired mass ratio.
4.2. Cell Assembly
Single layer pouch cells composed of LMO and LTO electrodes with n/p ratio below 1 were used, where n/p below 1 is known to have better cycle life.26 Detailed electrode dimensions and cell are shown Figure S3. Loading of LMO is 7 mg/cm2. Two electrodes were separated by polypropylene separator. 1.2 M LiPF6 solution in ester and carbonate mixture (ester >70% of volume) was used as the electrolyte to improve low-temperature conductivity.
4.3. Electrochemical Measurements
Charge–discharge measurements were recorded on Arbin system at controlled temperature of either 25 °C under conditions described in the text. The rate was defined as C/n, where C corresponded to the theoretical cell capacity; n was defined as the full discharge time (in hours). ASR is calculated by (Vpulse start – Vpulse end)/(Ipulse start – Ipulse end) for HPPC experiment. Cold crank tests of 18 mA h single layer pouch cells were performed at −30 °C by applying 16 C for 0.5 s and 10.5 C for 4 s three times; there is 10 s rest between pulses. Cells were charged to 100% SOC at 25 °C prior to cold crank, and the test was done at every 10% SOCs. Cold crank of 1.5 A h multilayer pouch cells were tested by the following USABC procedure, where three 0.5 s of 6 kW and 4 s of 4 kW pulses after removing scaled 360 W h energy, which corresponds to ∼40% SOC. EIS spectra were acquired on a Gamry at 50% SOC between 100 kHz and 20 mHz at 25, 0, and −30 °C.
Acknowledgments
Support for this work from the USABC program, in particular, Harshad Tataria, Matt Denlinger, Jacqueline Siegel of the USABC and Brian Cunningham of the U.S. Department of Energy, Office of Energy Efficiency and Renewable Energy, is gratefully acknowledged.
Supporting Information Available
The Supporting Information is available free of charge at https://pubs.acs.org/doi/10.1021/acsomega.9b02393.
Fitting results of EIS measurement, cold crank results, Nyquist plot at different temperatures, and pictures of the pouch cell (PDF)
The authors declare no competing financial interest.
Supplementary Material
References
- Colbow K. M.; Dahn J. R.; Haering R. R. Structure and Electrochemistry of the Spinel Oxides LiTi2O4 and Li43Ti53O4. J. Power Sources 1989, 26, 397–402. 10.1016/0378-7753(89)80152-1. [DOI] [Google Scholar]
- Ferg E.; Gummow R. J.; de Kock A.; Thackeray M. M. Spinel Anodes for Lithium-Ion Batteries. J. Electrochem. Soc. 1994, 141, L147–L150. 10.1149/1.2059324. [DOI] [Google Scholar]
- Ohzuku T.; Ueda A.; Yamamoto N. Zero-Strain Insertion Material of Li[Li1/3Ti5/3]O4 for Rechargeable Lithium Cells. J. Electrochem. Soc. 1995, 142, 1431–1435. 10.1149/1.2048592. [DOI] [Google Scholar]
- Amine K.; Belharouak I.; Chen Z.; Tran T.; Yumoto H.; Ota N.; Myung S.-T.; Sun Y.-K. Nanostructured Anode Material for High-Power Battery System in Electric Vehicles. Adv. Mater. 2010, 22, 3052–3057. 10.1002/adma.201000441. [DOI] [PubMed] [Google Scholar]
- Aravindan V.; Lee Y.-S.; Madhavi S. Research Progress on Negative Electrodes for Practical Li-Ion Batteries: Beyond Carbonaceous Anodes. Adv. Energy Mater. 2015, 5, 1402225–43. 10.1002/aenm.201402225. [DOI] [Google Scholar]
- Tataria H.; Gross O.; Bae C.; Cunningham B.; Barnes J. A.; Deppe J.; Neubauer J.. USABC Development of 12 Volt Battery for Start-Stop Application. 2013 World Electric Vehicle Symposium and Exhibition (EVS27), 2013; Vol. 2014, pp 1–8.
- Cho Y.-G.; Kim Y.-S.; Sung D.-G.; Seo M.-S.; Song H.-K. Nitrile-Assistant Eutectic Electrolytes for Cryogenic Operation of Lithium Ion Batteries at Fast Charges and Discharges. Energy Environ. Sci. 2014, 7, 1737–1743. 10.1039/c3ee43029d. [DOI] [Google Scholar]
- Pohjalainen E.; Rauhala T.; Valkeapää M.; Kallioinen J.; Kallio T. Effect of Li4Ti5O12Particle Size on the Performance of Lithium Ion Battery Electrodes at High C-Rates and Low Temperatures. J. Phys. Chem. C 2015, 119, 2277–2283. 10.1021/jp509428c. [DOI] [Google Scholar]
- Momma T.; Matsunaga M.; Mukoyama D.; Osaka T. Ac impedance analysis of lithium ion battery under temperature control. J. Power Sources 2012, 216, 304–307. 10.1016/j.jpowsour.2012.05.095. [DOI] [Google Scholar]
- Zhang S. S.; Xu K.; Jow T. R. The Low Temperature Performance of Li-Ion Batteries. J. Power Sources 2003, 115, 137–140. 10.1016/s0378-7753(02)00618-3. [DOI] [Google Scholar]
- Abraham D. P.; Heaton J. R.; Kang S.-H.; Dees D. W.; Jansen A. N. Investigating the Low-Temperature Impedance Increase of Lithium-Ion Cells. J. Electrochem. Soc. 2008, 155, A41–A47. 10.1149/1.2801366. [DOI] [Google Scholar]
- Li Y.; Meyer S.; Lim J.; Lee S. C.; Gent W. E.; Marchesini S.; Krishnan H.; Tyliszczak T.; Shapiro D.; Kilcoyne A. L. D.; et al. Effects of Particle Size, Electronic Connectivity, and Incoherent Nanoscale Domains on the Sequence of Lithiation in LiFePO4Porous Electrodes. Adv. Mater. 2015, 27, 6591–6597. 10.1002/adma.201502276. [DOI] [PubMed] [Google Scholar]
- Kang B.; Ceder G. Battery Materials for Ultrafast Charging and Discharging. Nature 2009, 458, 190–193. 10.1038/nature07853. [DOI] [PubMed] [Google Scholar]
- Kim C.; Norberg N. S.; Alexander C. T.; Kostecki R.; Cabana J. Mechanism of Phase Propagation During Lithiation in Carbon-Free Li4Ti5O12Battery Electrodes. Adv. Funct. Mater. 2013, 23, 1214–1222. 10.1002/adfm.201201684. [DOI] [Google Scholar]
- Chen C. H.; Vaughey J. T.; Jansen A. N.; Dees D. W.; Kahaian A. J.; Goacher T.; Thackeray M. M. Studies of Mg-Substituted Li4–xMgxTi5O12 Spinel Electrodes (0≤x≤1) for Lithium Batteries. J. Electrochem. Soc. 2001, 148, A102–A104. 10.1149/1.1344523. [DOI] [Google Scholar]
- Cheng L.; Li X.-L.; Liu H.-J.; Xiong H.-M.; Zhang P.-W.; Xia Y.-Y. Carbon-Coated Li[sub 4]Ti[sub 5]O[sub 12] as a High Rate Electrode Material for Li-Ion Intercalation. J. Electrochem. Soc. 2007, 154, A692–A697. 10.1149/1.2736644. [DOI] [Google Scholar]
- Takami N.; Hoshina K.; Inagaki H. Lithium Diffusion in Li4/3Ti5/3O4 Particles during Insertion and Extraction. J. Electrochem. Soc. 2011, 158, A725–A730. 10.1149/1.3574037. [DOI] [Google Scholar]
- Kim C.; Buonsanti R.; Yaylian R.; Milliron D. J.; Cabana J. Carbon-Free TiO2Battery Electrodes Enabled by Morphological Control at the Nanoscale. Adv. Energy Mater. 2013, 3, 1286–1291. 10.1002/aenm.201300264. [DOI] [Google Scholar]
- Kim C.; Yu Y.-S.; Moyon B.; Sirisopanaporn C.; Richardson T. J.; Cabana J. Visualization of the Phase Propagation within Carbon-Free Li4Ti5O12 Battery Electrodes. J. Phys. Chem. C 2016, 120, 29030–29038. 10.1021/acs.jpcc.6b11459. [DOI] [Google Scholar]
- Jow T. R.; Allen J.; Marx M.; Nechev K.; Deveney B.; Rickman S. Electrolytes, SEI and Charge Discharge Kinetics in Li-Ion Batteries. ECS Trans. 2010, 25, 3–12. 10.1149/1.3393833. [DOI] [Google Scholar]
- Chen Y.; Greszler T.; Deveney B.. Lithium Titanite Oxide as Negative Electrode in Li-Ion Cells. U.S.Patent2015/0,333,371 A1, 2015.
- Thomas M. G. S. R.; Bruce P. G.; Goodenough J. B. AC Impedance Analysis of Polycrystalline Insertion Electrodes: Application to Li1–xCoO2. J. Electrochem. Soc. 1985, 132, 1521–1528. 10.1149/1.2114158. [DOI] [Google Scholar]
- Zhan C.; Lu J.; Kropf A. J.; Wu T.; Jansen A. N.; Sun Y.-K.; Qiu X.; Amine K. Mn(II) Deposition on Anodes and Its Effects on Capacity Fade in Spinel Lithium Manganate-Carbon Systems. Nat. Commun. 2013, 4, 2437. 10.1038/ncomms3437. [DOI] [PubMed] [Google Scholar]
- Ogihara N.; Itou Y.; Sasaki T.; Takeuchi Y. Impedance Spectroscopy Characterization of Porous Electrodes under Different Electrode Thickness Using a Symmetric Cell for High-Performance Lithium-Ion Batteries. J. Phys. Chem. C 2015, 119, 4612–4619. 10.1021/jp512564f. [DOI] [Google Scholar]
- Young D.; Ransil A.; Amin R.; Li Z.; Chiang Y.-M. Electronic Conductivity in the Li4/3Ti5/3O4-Li7/3Ti5/3O4System and Variation with State-of-Charge as a Li Battery Anode. Adv. Energy Mater. 2013, 3, 1125–1129. 10.1002/aenm.201300134. [DOI] [Google Scholar]
- Song M.; Choi Y.; Song S.; Sohn Y.; Shin J.; Doo S. Charge/Discharge Property and Cycle Life of Li4Ti5O12/LiCoO2-LiNi1-x-yCoxAlyO2 Cell for Electricity Storage Applications: Effect of Cell Design Parameters. Technical Proceedings of the 2010 Clean Technology Conference and Trade Show 2010, 438–441. [Google Scholar]
Associated Data
This section collects any data citations, data availability statements, or supplementary materials included in this article.


