Abstract
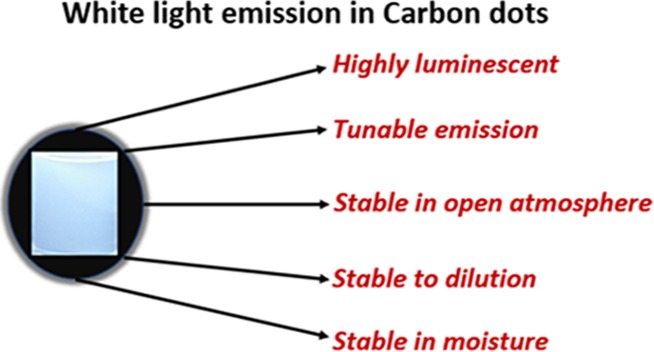
In this article, synthesis of white-light-emitting, highly stable carbon dots (CDs) using a colloidal synthesis technique is reported. It has been observed that the use of a non-coordinating solvent plays a vital role in the successful fabrication of highly stable CDs. Dilution-independent emissive behavior in CDs is achieved. Excitation-energy-dependent emissive behavior is observed in CDs. However, by surface passivating the CD core by using hexadecylamine (HDA), excitation wavelength dependence of emission is successfully minimized. Surface-functionalized CDs (SFCDs) show blue to green light tunable emission with the change in synthesis conditions. HDA also plays an important role in achieving dilution-independent emission in SFCDs. Furthermore, the carbon dots synthesized are highly inert, and their emission spectra are unaffected on exposure to an open atmosphere for as long as 9 days. A new class of highly crystalline carbon dots called “carbon onion rings” is reported.
Introduction
Quantum dots are semiconductor nanoparticles with confinement of charge carriers in all the three dimensions.1 Due to this charge carrier confinement, they fluoresce at specific wavelengths based on the energy band structure of the quantum dot formed.2 Majority of conventional quantum dots are based on toxic and environmentally hazardous heavy-metal ions. Due to these shortcomings, there is a high demand for the synthesis of benign nanomaterials with similar or better optical properties. On the other hand, carbon dots (CDs) with equivalent optical properties come across as nanomaterials with low toxicity. Moreover, CDs are resistant to photobleaching and photoblinking, show higher luminescence, and large two photon cross section areas,3−9 which makes them highly beneficial for applications ranging from LED sources,10 temperature sensors11,12 (nanothermometry) to bioimaging.13,14 Furthermore, carbon is widely available in nature at low cost, thus increasing the potential of CDs to replace semiconductor quantum dots in photonic devices and sensor applications. However, most of the fabricated CDs reported until now have shown excitation energy and dilution dependent emissive behavior,15−17 leaving them sterile for applications that require a controlled and dilution-independent emission.18−20 In this paper, a novel synthesis technique, which leads to highly stable CDs, is reported. White-light-emitting, highly luminescent CDs have been successfully fabricated. It is observed that the fabrication parameters play a major role in the stability of the dots. Dilution-independent photoluminescence (PL) behavior is achieved by controlling the temperature of the reaction and using a non-coordinating solvent during synthesis. CD surface passivation is achieved by using HDA as the surface-functionalizing agent. By passivating the surface groups on the carbon core, excitation wavelength dependence of the emission is minimized. It is observed that the ratio of molar concentration of HDA (surface-functionalizing agent)/citric acid (carbon source) plays a major role in the stability of SFCDs. Furthermore, by passivating the carbon core, a better control in growth of CDs is achieved, which leads to blue- and green-emitting dots. Highly stable emission behavior on exposure of CDs to an open atmosphere and water for long durations is reported.
Chemical Synthesis
CDs were synthesized using a colloidal synthesis technique under an inert atmosphere at a high temperature of 300 °C. For bare CDs, citric acid (C6H807) was used as a carbon precursor, and octadecene (C18H36, ODE) was used as a high-boiling-point solvent. 0.3 M solution of citric acid (1 g) in (15 mL) octadecene was prepared and transferred to a reaction flask. With a stirring rate of 100 rpm, the reaction flask was heated at 300 °C for 1 h. CD formation involved pyrolysis of citric acid followed by carbonization. Heating above the melting point of citric acid led to the breakdown of citric acid molecules followed by polymerization to form carbon clusters. At high temperatures, these carbon clusters carbonized to form the carbon core leading to CD nuclei. After a synthesis time of 1 h at 300 °C, the solution containing CD precipitates was purified using ethanol to separate the quantum dot precipitate. The CDs were then dispersed in chloroform. SFCDs were prepared by using citric acid as the carbon source, octadecene as the high-boiling-point solvent, and hexadecyl amine (HDA) as the surface-functionalizing agent. For synthesizing these dots, 0.2 M (1.5 gm) HDA was added to the reaction flask along with (15 mL) ODE and (1 g) citric acid. SFCDs were prepared at different HDA concentrations varying from 0.1 to 0.4 M. With a stirring rate of 100 rpm, the reaction flask was heated at 300 °C for 1 h. CD formation involved pyrolysis accompanied by carbonization followed by surface functionalization of CDs. HDA acts as a ligand, which passivates the surface groups. Samples collected were purified using ethanol to separate the quantum dot precipitate and henceforth were dispersed in chloroform. The fabrication process is summarized through a schematic as shown in Figure 1a−b. The synthesized bare CDs under UV light showed white-light emission (Figure 1c). White-light emission from bare carbon dots can be used to fabricate white-light-emitting devices.21−24 SFCDs under UV light showed blue (452) to green (541) color emissions at different HDA/citric acid molar concentrations ranging from 0.3 to 1.3 (Figure 1c).
Figure 1.
(a) Schematic for synthesis process of carbon dots (CDs). Initially, the solution is clear. Gradually, with the increase in reaction temperature and time, nucleation followed by growth (steps 1, 2) takes place with a change in color of the solution from pale yellow to brown. Surface functionalization will take place for SFCDs in step 3. (b) The corresponding meaning of steps 1, 2, and 3 in the reaction mechanism is explained. Carbon dots are formed by pyrolysis and then carbonization of citric acid. ODE acts as a high-boiling-point solvent. For SFCDs, HDA acts as a surface-functionalizing agent. (c) The synthesized bare CDs under UV light show white-light emission. SFCDs under UV light show blue (452 nm) to green (541 nm) color emissions at different HDA/citric acid molar concentrations. Blue light for sample with molar concentration ratio HDA/citric acid = 0.3, and green color for samples with molar concentration ratios HDA/citric acid = 0.6, 1.0, and 1.3 (from left to right).
Results and Discussion
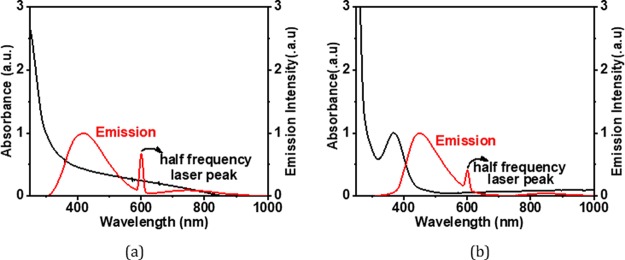
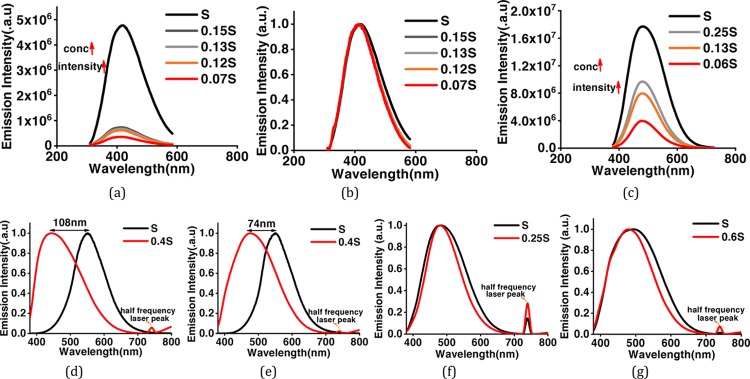
To further explore the nanostructures, the as-prepared CDs have been analyzed by transmission electron microscopy (TEM). Low-magnification images show that the particles are spherical in shape. Wide particle size distribution is observed in the bare (Figure 2a–c) as well as surface-functionalized CDs (Figure 2g). Average size of bare CDs is around ∼4 nm. HRTEM images show the particles to be crystalline in nature. Two different crystal structures appear at different reaction conditions. Onion rings (Figure 2d) appear when the reaction temperatures (300 °C) and reaction duration (1 h) are high, while at lower temperatures and times, parallel lattice planes (Figure 2e) in the CDs are observed. Bare CD samples are synthesized at high temperatures, which lead to the formation of hexagonal-shaped carbon onion rings as shown in HRTEM images. This kind of onion-shaped ring structure has been observed by Iijima et al. during formation of amorphous carbon films by the vacuum deposition method at high temperatures and pressures.25 When the graphitic structure of carbon containing trigonal sp2 state C–C bonds are heated at high temperatures, the trigonal C–C bond gets strained and a tetrahedral sp3 C–C bond is formed, which leads to the onion ring structure.25 At short synthesis duration and temperatures below 300 °C, only parallel lattice planes are observed. The HRTEM images clearly indicate a lattice spacing of 0.32 nm in ring geometry and 0.32, 0.29, and 0.21 nm in planar geometries. However, interplanar spacings of 0.32, 0.29, and 0.20 nm are observed in SFCDs as shown in Figure 2g. A lattice spacing of 0.32 nm corresponds to the (002) plane of the graphitic crystal structure, and 0.21 and 0.20 nm corresponds to the (100) and (101) planes, respectively. Selected area diffraction (SAED) images of synthesized bare CDs also support the crystalline nature of carbon dots. Absorption and emission spectra of the as-prepared CDs and SFCDs are recorded. It is observed that the bare as well as SFCDs absorb in the UV region and emit in the visible region. Bare CDs absorb in a broad range starting from wavelengths <830 nm and show a steep absorption edge at ∼300 nm. No prominent absorption peak is observed in the absorption spectra of bare CDs (Figure 3a). The emission spectra obtained from the bare CDs is observed to range from ∼300 to 600 nm with an emission maximum at 417 nm (Figure 3a). The full width at half-maximum (FWHM) of PL spectra of CDs observed is 141 nm at 300 nm incident excitation wavelength (λex). The surface of CDs is decorated with various functional groups (−COC, C=O, etc., Figure 5), which absorb at different energies and emit accordingly. These surface groups do not emit on their own, but when attached to the carbon dot surface, they share their lone pair of electrons with the π orbitals of the intrinsic carbon core and act as emissive trap sites.26 These groups manifest as energy levels at different energies in the band gap of the material. The overlap of emission due to these energy levels leads to a single broad peak at λex of 300 nm. However, large particle size distribution is also observed in the as-fabricated samples, which is corroborated by the broad absorption range (300–830 nm) and wide particle size distribution showing TEM images. Therefore, the wide FWHM observed is due to the cumulative effect of wide particle size distribution and superposition of emission due to various (−COC, C=O) surface groups (surface emissive traps formed during the synthesis of CDs). These bare CDs emit white light under UV-lamp illumination. Also, they show a quantum yield (QY) of 4%. Henceforth, to increase the quantum yield and passivate the surface groups on the carbon core and thereby to enhance the stability of CDs, SFCDs using HDA are fabricated and investigated. Furthermore, HDA provides a better control of the reaction, and higher emission intensity is anticipated due to quenching of surface dangling bonds present on the CD surface. Absorption spectra of the SFCDs depict a substantial absorption for wavelengths ≤500 nm with a strong absorption peak at ∼368 nm (Figure 3b). The SFCDs emit in the range of 370 to 600 nm, with a maximum at 450 nm (Figure 3b). FWHM in photoluminescence (PL) spectra of SFCDs is ∼120 nm at λex of 300 nm. As compared to bare CDs, it appears that, in SFCDs, a part of the blue emission (350–430 nm) due to surface groups is quenched by HDA and a red shift in emission maxima is observed. A QY of 31% has been observed for SFCDs. Wavelength dependence of emission spectra is investigated for λex ranging from 250 to 400 nm. On illumination of bare CDs with different excitation energies, a variation in emission wavelength and intensity is observed. There is an increase in emission intensity with the increase in λex up to 370 nm, and on further increase in λex above 370 nm, the emission intensity decreases (Figure 4a). Variation in emission intensity at different λex’s corresponds to the density of surface groups attached to the carbon core. Furthermore, the emission maxima red shifts by 54 nm on increase in λex from 250 to 400 nm. Excitation-energy-dependent emission is due to the presence of wide particle size distribution and surface groups, which act as emissive trap sites on CDs. Different-sized dots and surface groups excite at different energies and emit correspondingly. In bare CDs, it is observed that the λex-dependent emission peak shift is more prominent in the 350–400 nm λex range. Furthermore, by surface functionalizing the bare dots, a higher control on size of the dot and quenching of surface states is achieved, which is prominent in the emission spectra of SFCDs with the variation in λex. In the emission spectra of SFCDs (HDA/citric acid = 2, Figure 4b), the emission peak shift in the 350–400 nm λex range is minimized. When HDA concentration is further increased (HDA/citric acid = 3), a more stable λex-independent emission in the 350–400 nm λex range is observed (Figure 4c). A dual emission window is observed in the emission spectra of SFCDs (HDA/citric acid = 3) at λex ranging from 270 to 320 nm (Figure 4c). This dual emission is due to amino groups getting attached to the carbon core in SFCDs. This behavior clearly indicates the passivation of the surface groups on the CDs. Considering the origin of peaks from two different sources, although two peaks are observed, there is no shift in the emission maxima of each peak. Thus, it could be concluded that HDA passivates the surface groups and stable emission is achieved. Furthermore, the presence of different functional groups on the surface of CDs is confirmed by FTIR spectra (Figure 5). The absorption signals at 1045 and 995 cm–1 correspond to C–O–C stretching vibrations. Peaks at 1701 and 1640 cm–1 correspond to C=O stretching vibration. The absorption values at 3076, 3022, 2924, and 2853 cm–1 correspond to CHx (x = 2, 3) stretching vibrations. The band at 1464 cm–1 corresponds to C–H bending modes. The absorption peaks between 1653 and 1520 cm–1 correspond to CONH stretching vibrations. C–O–C stretching vibrations are deformed in the FTIR spectra of SFCDs, and N–H and CONH stretching vibrations are observed. In order to check the effect of dilution on the emission spectra of bare carbon dots and SFCDs, different concentrations of CDs are dispersed in chloroform and the emission spectra are recorded. It is observed that, for the bare CDs, the emission intensity decreases with the increase in dilution of CDs (Figure 6a). A similar behavior is also observed in SFCDs (Figure 6c). This decrease in emission intensity is attributed to the decreasing concentration of the CDs in the solvent. However, in the bare CDs, the emission maximum wavelength does not shift by a change in dilution (Figure 6b), which is attributed to the use of ODE during synthesis. Proper selection of solvent, synthesis temperature, and concentration of precursors during synthesis play a very important role in the emissive behavior of CDs. Most of the CDs reported until now have been synthesized by hydrothermal synthesis using water as a solvent, pre- and postsynthesis.27,28 Water acts as a source of OH– ions, which get attached to C=O surface groups on CDs and act as emissive traps. Depending on the concentration of the solvent (water), more or fewer OH– ions gets attached to the CD surface, and this leads to dilution-dependent PL behavior in CDs. Since the solvent (ODE) chosen in our synthesis is non-coordinating and nonpolar, it does not modify the surface of CDs during synthesis. Hence, the CDs synthesized show dilution-independent emissive behavior. This dilution-independent emission in CDs can find wide applications in concentration-sensitive device applications (e.g., in chemical sensing). In SFCDs, HDA acts as a source of amino groups to the carbon surface, and thus, stability of SFCDs is disturbed. In SFCDs, the molar concentration ratio of HDA/citric acid plays a vital role in achieving dilution-independent stable emission. For HDA concentration ∼0.5 times the molar concentration of citric acid, a large blue shift of 108 nm is observed in the diluted sample (Figure 6d). With the increase in HDA concentration, the effect of dilution on the emission maximum shift decreases (Figure 6d–g). When the molar concentration of HDA is greater than or equal to twice that of citric acid, SFCDs show dilution-independent emission behavior because the amount of HDA is enough to completely passivate the CD surface. Moreover, due to stearic hindrance between two adjacent CDs, CD–CD interdot interactions can be greatly reduced leading to dilution-independent emission behavior. Furthermore, aging and photostability of the CDs are studied by exposing bare CDs and SFCDs to an open atmosphere for a span of 9 days before taking the emission spectra. The maximum emission count for bare CDs when excited at 250 nm (Figure 7a) is of the order of 105, while it is of the order of 106 in SFCDs (Figure 7c). The intensity increases to the order of 106 when excited by 350 nm in bare CDs (Figure 7b) and it increases to 107 in SFCDs (Figure 7d). On increase in exposure time of CDs to an open atmosphere, the emission intensity decreases in the case of CDs excited at 250 and 350 nm and SFCDs excited at 250 nm. However, there is an increase in intensity with the increase in exposure duration in SFCDs when excited at 350 nm. Although there is a decrease in the count among bare CDs (λex = 250 and 350 nm) and SFCD (λex = 250 nm) and increase in SFCDs (λex = 350 nm), the order of magnitude remains the same. Furthermore, the normalized emission spectra seem to be completely unaffected by exposure to an open atmosphere. So, in conclusion, although the emission count varies, but it should be emphasized that the intensity remains almost of the same order of magnitude on exposure to an open atmosphere for as long as 216 h. Furthermore, to find out the effect of water (polar solvent) on the emission behavior, the CDs and SFCDs are placed in water for a span of 17 days before taking the emission spectra. It is observed that CDs and SFCDs are almost insoluble in water (Figure 8a). Bare CDs float over the surface of water, which get dispersed in water on vigorous stirring. SFCDs are completely insoluble in water and stick to the walls at the bottom of the vial. In bare CDs, the surface has few polar groups such as −C=O and C–O, due to which slight miscibility in water is observed. However, in SFCDs, these polar groups (C=O) are passivated by (−NH2–R). Because of the presence of alkyl groups (nonpolar) at the terminal ends of −NH2–R, highly insoluble behavior in water is observed. Emission spectra of CDs and SFCDs dispersed in water are recorded after 17 days (Figure 8b−d). Two incident wavelengths (250 and 350 nm) were used to excite the QDs. There is a decrease in emission intensity in all samples in water as compared to CHCl3. The CDs and SFCDs were highly immiscible in water, which renders the CD concentration to be very low, leading to lower emission intensity. However, in SFCDs, the emission intensity is drastically low due to the highly immiscible nature of dots. SFCDs stick at the bottom walls of the vial, and therefore, the emission spectra is obtained by the very low concentration of dots that might be soluble in water (Figure 8).
Figure 2.
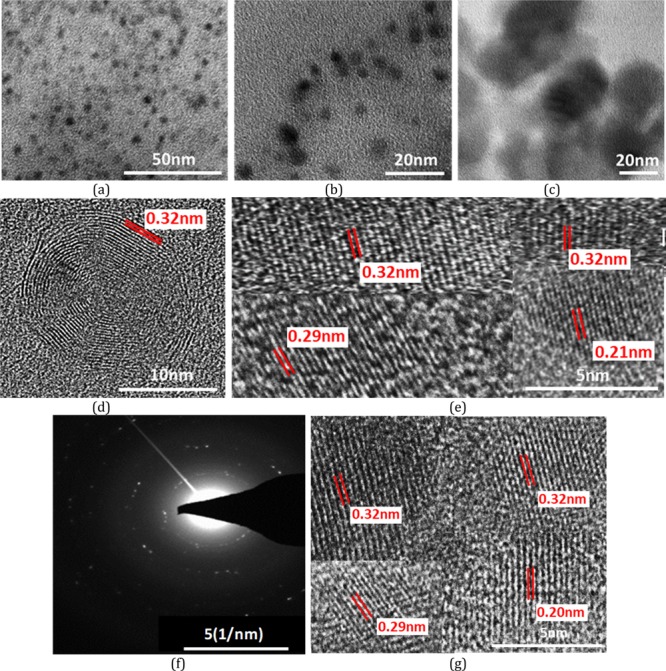
(a) TEM image of bare CDs showing spherical CD formation at lower magnification (b−c). Images at higher magnification depicting large size distribution. (d) HRTEM image of bare CDs showing onion-shaped hexagonal rings. (e) HRTEM image of bare CDs showing parallel planes. (f) SAED pattern of bare CDs showing highly crystalline behavior. (g) HRTEM image of SFCDs.
Figure 3.
Normalized absorption (black) and normalized emission (red) spectra of (a) bare CDs and (b) SFCDs. An absorption peak at 368 nm is observed in SFCDs.
Figure 5.
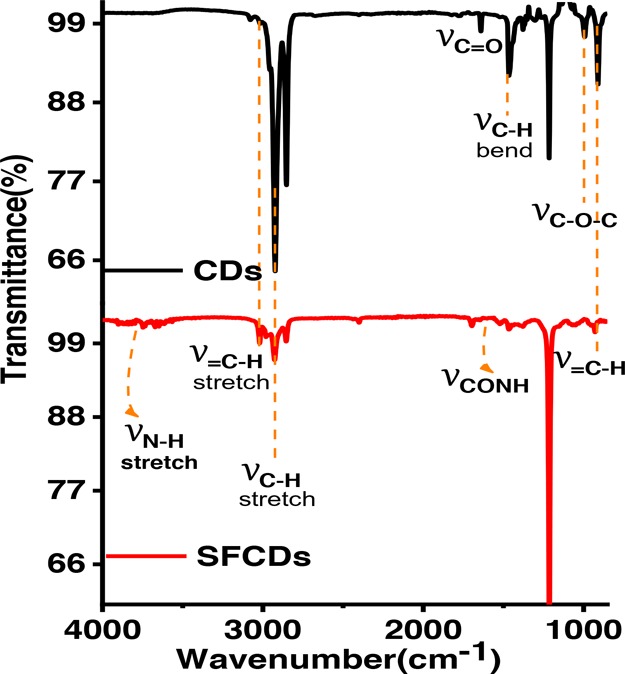
FTIR spectra of bare CDs and SFCDs. FTIR spectra of bare CDs confirm the presence of various functional groups on the CD surface. The N–H stretch observed in SFCDs confirms the passivation of the CD surface by amino groups.
Figure 4.
Emission spectra under different excitation wavelengths (λex) varying from 250 to 400 nm for (a) bare CDs and (b) SFCDs prepared at HDA/citric acid molar concentration ratio of 2. (c) SFCDs prepared at HDA/citric acid molar concentration ratio of 3.
Figure 6.
(a) Emission behavior of bare CDs at different CD concentrations in solvent (CHCl3). S represents maximum concentration, which is decreased to 0.07 S gradually. (b) Normalized emission spectra of bare CDs (c) Effect of dilution on emission spectra of SFCDs fabricated at HDA/citric acid molar concentration ratio of 2; The normalized emission spectra for HDA/citric acid molar concentration ratios of (d) 0.5, (e) 1, (f) 2, and (g) 3.
Figure 7.
Emission spectra on exposure to an open atmosphere for various durations for (a) bare CDs excited at 250 nm, (b) bare CDs excited at 350 nm, (c) SFCDs excited at 250 nm, and (d) SFCDs excited at 350 nm.
Figure 8.
(a) Images of CDs and SFCDs in water. CDs are highly immiscible in water. Bare CDs get slightly dispersed on vigorous stirring, while SFCDs settle at the bottom of the vial; Emission spectra for carbon dots immersed in water for (b) bare CDs λex = 350 nm (c), SFCDs λex = 250 nm, and (d) SFCDs λex = 350 nm.
Conclusions
In summary, the synthesis technique to obtain highly stable carbon dots is discussed. Highly luminescent white-light-emitting CDs are fabricated and characterized. The carbon dots synthesized are chemically inert, and their emission spectra are unaffected on exposure to an open atmosphere. Parameters affecting emission behavior of CDs are discussed. Dilution, excitation wavelength, solvent, and atmospheric effects on emission are discussed using UV absorption spectroscopy, PL emission spectroscopy, and FTIR spectroscopic techniques. Emission behavior of CDs in polar solvents such as water is discussed. These highly stable CDs find wide applications in fabricating various photonic devices. These organic CDs are prepared using a green synthesis route and can be highly beneficial for sensor, bio-, and LED applications.
Acknowledgments
This work was supported by SERB, Department of Science and Technology through grant EEQ/2017/00655 and ISRO-IISc Space Technology Cell STC/P-417.
The authors declare no competing financial interest.
References
- Bimberg D.; Pohl U. W. Quantum dots: promises and accomplishments. Mater. Today 2011, 14, 388–397. 10.1016/S1369-7021(11)70183-3. [DOI] [Google Scholar]
- Semonin O. E.; Luther J. M.; Beard M. C. Quantum dots for next-generation photovoltaics. Mater. Today 2012, 15, 508–515. 10.1016/S1369-7021(12)70220-1. [DOI] [Google Scholar]
- Li H.; Kang Z.; Liu Y.; Lee S. T. Carbon nanodots: synthesis, properties and applications. J. Mater. Chem. 2012, 22, 24230. 10.1039/c2jm34690g. [DOI] [Google Scholar]
- Wang L.; Zhu S.-J.; Wang H.-Y.; Qu S.-N.; Zhang Y.-L.; Zhang J.-H.; Chen Q.-D.; Xu H.-L.; Han W.; Yang B.; Sun H. B. Common origin of green luminescence in carbon nanodots and graphene quantum dots. ACS Nano 2014, 8, 2541–2547. 10.1021/nn500368m. [DOI] [PubMed] [Google Scholar]
- Sun Y.-P.; Zhou B.; Lin Y.; Wang W.; Fernando K. A. S.; Pathak P.; Meziani M. J.; Harruff B. A.; Wang X.; Wang H.; Luo P. G.; Yang H.; Kose M. E.; Chen B.; Veca L. M.; Xie S.-Y. Quantum-sized carbon dots for bright and colorful photoluminescence. J. Am. Chem. Soc. 2006, 128, 7756–7757. 10.1021/ja062677d. [DOI] [PubMed] [Google Scholar]
- Wang X.; Cao L.; Yang S.-T.; Lu F.; Meziani M. J.; Tian L.; Sun K. W.; Bloodgood M. A.; Sun Y.-P. Bandgap-like strong fluorescence in functionalized carbon nanoparticles. Angew. Chem., Int. Ed. 2010, 49, 5310–5314. 10.1002/anie.201000982. [DOI] [PMC free article] [PubMed] [Google Scholar]
- Strauss V.; Margraf J. T.; Dolle C.; Butz B.; Nacken T. J.; Walter J.; Bauer W.; Peukert W.; Spiecker E.; Clark T.; Guldi D. M. Carbon Nanodots: Toward a Comprehensive Understanding of Their Photoluminescence. J. Am. Chem. Soc. 2014, 136, 17308–17316. 10.1021/ja510183c. [DOI] [PubMed] [Google Scholar]
- Xiao L.; Sun H. Novel properties and applications of Carbon nanodots. Nanoscale Horiz. 2018, 3, 565. 10.1039/C8NH00106E. [DOI] [PubMed] [Google Scholar]
- Baker S. N.; Baker G. A. Luminescent carbon nanodots: emergent nanolights. Angew. Chem., Int. Ed. 2010, 49, 6726–6744. 10.1002/anie.200906623. [DOI] [PubMed] [Google Scholar]
- Chen X.; Bai X.; Sun C.; Su L.; Wang Y.; Zhang Y.; Yu W. W. High efficient light-emitting diodes based on liquid-type carbon dots. RSC Adv. 2016, 6, 96798. 10.1039/C6RA20570D. [DOI] [Google Scholar]
- Yu P.; Wen X.; Toh Y. R.; Tang J. Temperature-Dependent Fluorescence in Carbon Dots. J. Phys. Chem. C 2012, 116, 25552–25557. 10.1021/jp307308z. [DOI] [Google Scholar]
- Kalytchuk S.; Poláková K.; Wang Y.; Froning J. P.; Cepe K.; Rogach A. L.; Zbořil R. Carbon Dot Nanothermometry: Intracellular Photoluminescence Lifetime Thermal Sensing. ACS Nano 2017, 11, 1432–1442. 10.1021/acsnano.6b06670. [DOI] [PubMed] [Google Scholar]
- Cao L.; Wang X.; Meziani M. J.; Lu F.; Wang H.; Luo P. G.; Lin Y.; Harruff B. A.; Veca L. M.; Murray D.; Xie S. Y.; Sun Y. P. Carbon Dots for Multiphoton Bioimaging. J. Am. Chem. Soc. 2007, 129, 11318–11319. 10.1021/ja073527l. [DOI] [PMC free article] [PubMed] [Google Scholar]
- Wang X.; Cao L.; Lu F.; Meziani M. J.; Li H.; Qi G.; Zhou B.; Harruff B. A.; Kermarrec F.; Sun Y.-P. Photoinduced electron transfers with carbon dots. Chem. Commun. 2009, 3774–3776. 10.1039/b906252a. [DOI] [PMC free article] [PubMed] [Google Scholar]
- Nie H.; Li M.; Li Q.; Liang S.; Tan Y.; Sheng L.; Shi W.; Zhang S. X.-A. Carbon Dots with Continuously Tunable Full-Color Emission and Their Application in Ratiometric pH Sensing. Chem. Mater. 2014, 26, 3104–3112. 10.1021/cm5003669. [DOI] [Google Scholar]
- Zhu S.; Zhang J.; Tang S.; Qiao C.; Wang L.; Wang H.; Liu X.; Li B.; Li Y.; Yu W.; Wang X.; Sun H.; Yang B. Surface Chemistry Routes to Modulate the Photoluminescence of Graphene Quantum Dots: From Fluorescence Mechanism to Up-Conversion Bioimaging Applications. Adv. Funct. Mater. 2012, 22, 4732–4740. 10.1002/adfm.201201499. [DOI] [Google Scholar]
- Zhu S.; Meng Q.; Wang L.; Zhang J.; Song Y.; Jin H.; Zhang K.; Sun H.; Wang H.; Yang B. Highly Photoluminescent Carbon Dots for Multicolor Patterning, Sensors, and Bioimaging. Angew. Chem. 2013, 52, 3953–3957. 10.1002/anie.201300519. [DOI] [PubMed] [Google Scholar]
- Kim S.; Hwang S. W.; Kim M.-K.; Shin D. Y.; Shin D. H.; Kim C. O.; Yang S. B.; Park J. H.; Hwang E.; Choi S.-K.; Ko G.; Sim S.; Sone C.; Choi H. J.; Bae S.; Hong B. H. Anomalous Behaviors of Visible Luminescence from Graphene Quantum Dots: Interplay between Size and Shape. ACS Nano 2012, 6, 8203–8208. 10.1021/nn302878r. [DOI] [PubMed] [Google Scholar]
- Song Y.; Zhu S.; Zhang S.; Fu Y.; Wang L.; Zhao X.; Yang B. Investigation from chemical structure to photoluminescent mechanism: a type of carbon dots from the pyrolysis of citric acid and an amine. J. Mater. Chem. 2015, 3, 5976–5984. 10.1039/C5TC00813A. [DOI] [Google Scholar]
- LeCroy G. E.; Messina F.; Sciortino A.; Bunker C. E.; Wang P.; Fermando K. A. S.; Sun Y.-P. Characteristic Excitation Wavelength Dependence of Fluorescence Emissions in Carbon “Quantum” Dots. J. Phys. Chem.C. 2017, 121, 28180–28186. 10.1021/acs.jpcc.7b10129. [DOI] [Google Scholar]
- Sadeghi S.; Kumar B. G.; Melikov R.; Aria M. M.; Jalali H. B.; Nizamoglu S. Quantum dot white LEDs with high luminous efficiency. Optica. 2018, 5, 793–802. 10.1364/OPTICA.5.000793. [DOI] [Google Scholar]
- Wang H.; Sun C.; Chen X.; Zhang Y.; Colvin V. L.; Rice Q.; Seo J.; Feng S.; Wang S.; Yu W. W. Excitation wavelength independent visible color emission of carbon dots. Nanoscale 2017, 9, 1909. 10.1039/C6NR09200D. [DOI] [PMC free article] [PubMed] [Google Scholar]
- Zhu J.; Bai X.; Zhai Y.; Chen X.; Zhu Y.; Pan G.; Zhang H.; Biao D.; Song H. Carbon dots with efficient solid-state photoluminescence towards white light-emitting diodes. J. Mater. Chem. C 2017, 5, 11416. 10.1039/C7TC04155A. [DOI] [Google Scholar]
- Sun C.; Zhang Y.; Sun K.; Reckmeier C.; Zhang T.; Zhang X. Y.; Zhao J.; Wu C.; Yu W. W.; Rogach A. L. Combination of carbon dot and polymer dot phosphors for white light-emitting diodes. Nanoscale 2015, 7, 12045. 10.1039/C5NR03014E. [DOI] [PubMed] [Google Scholar]
- Iijima S. Direct observation of the tetrahedral bonding in graphitized carbon black by high resolution electron microscopy. J. Cryst. Growth 1980, 50, 675–683. 10.1016/0022-0248(80)90013-5. [DOI] [Google Scholar]
- Hola K.; Bourlinos A. B.; Kozak O.; Berka K.; Siskova K. M.; Havrdova M.; Tucek J.; Safarova K.; Otyepka M.; Giannelis E. P.; Zboril R. Photoluminescence effects of graphitic core size and surface functional groups in carbon dots: COO- induced red-shift emission. Carbon 2014, 70, 279–286. 10.1016/j.carbon.2014.01.008. [DOI] [Google Scholar]
- Hoan B. T.; Tam P. D.; Pham V. H. Green Synthesis of Highly Luminescent Carbon Quantum Dots from Lemon Juice. J. Nanotechnol. 2019, 1. 10.1155/2019/2852816. [DOI] [Google Scholar]
- Pal T.; Mohiyuddin S.; Packirisamy G. Facile and Green Synthesis of Multicolor Fluorescence Carbon Dots from Curcumin: In Vitro and in Vivo Bioimaging and Other Applications. ACS Omega 2018, 3, 831–843. 10.1021/acsomega.7b01323. [DOI] [PMC free article] [PubMed] [Google Scholar]


