Abstract
The aim of this study was to investigate the factors predicting clinical pregnancy rate of in vitro fertilization-embryo transfer (IVF-ET).
The data of 9960 patients receiving IVF-ET fresh cycle at our Reproductive Center from January 2009 to December 2017 were first divided into pregnant group and non-pregnant group to find the clinical pregnancy rate-related factors. According to the serum HCG levels at 36 hours and 12 hours after HCG trigger, all patients were divided into 4 groups including <50 mIU/ml, ≥50 and <100 mIU/ml, ≥100 and <200 mIU/ml, and ≥200 mIU/ml groups to know whether the HCG levels at 36 hours and 12 hours affect the pregnancy rate. According to the serum HCG ratio at 36 hours to 12 hours (36 h/12 h) after HCG trigger, all patients were divided into three groups including <0.88, 0.88–1.06 and >1.06 groups to observe whether the serum HCG ratio (36 h/12 h) affects the clinical pregnancy rate. According to different assisted pregnancy modes, all patients were divided into 3 groups including IVF, ICSI, and IVF/ICSI groups to observe whether the assisted pregnancy mode affects the clinical pregnancy rate. The correlation of the clinical pregnancy rate with pregnancy rate-related factors obtained above was analyzed using logistic regression analysis model.
The clinical pregnancy rate significantly increased (P < .01) in the HCG ratio (36 h/12 h) >1.06 group as compared with the HCG ratio (36 h/12 h) < 0.88 and 0.88–1.06 groups. The serum estrogen (E2) level at 36 hours was significantly lower and the number of retrieved oocytes was significantly higher in the HCG ratio (36 h/12 h) >1.06 group than in the HCG ratio (36 h/12 h) <0.88 and 0.88–1.06 groups (P = .000).
The serum HCG ratio (36 h/12 h) may be used as a predictor of IVF-ET clinical pregnancy rate. High clinical pregnancy rate is probably associated with E2 down-regulation in the HCG ratio (36 h/12 h) >1.06 group.
Keywords: clinical pregnancy rate, estrogen, human chorionic gonadotropin, in vitro fertilization-embryo transfer
1. Introduction
Synchronized mature high-quality follicles as well as normally fertilized and developed embryos were essential for in vitro fertilization-embryo transfer (IVF-ET). Human chorionic gonadotrophin (HCG) plays an unique role in promoting final oocyte maturation and inducing ovulation, so it is important for accurate and proper application of HCG in IVF-ET. Some studies have indicated that the serum HCG level after HCG injection or HCG injection dose is related to clinical pregnancy rate, number of retrieved oocytes and metaphase II (MII) rate, but there has been considerable debate about it.[1–5] Therefore, in this study, the data from the patients who underwent HCG subcutaneous injection according to the luteal phase standard long-term program were retrospectively analyzed to explore the clinical pregnancy rate-related factors including serum HCG levels at 12 and 36 hours after HCG trigger as well as the serum HCG ratio at 36 hours to 12 hours (36 h/12 h). Different from previous studies, we observed the effect of serum HCG ratio (36 h/12 h) on the clinical pregnancy rate for the first time, providing a new guidance for clinical practice.
2. Materials and methods
All study methods were approved by the Ethics Committee of the First Affiliated Hospital of Zhengzhou University. All the subjects enrolled into the study gave written informed consent to participate.
2.1. Subjects
A total of 9960 patients who received artificial assisted reproductive technology in our Reproductive Medicine Center from January 2009 to December 2017 and were in line with the following inclusion and exclusion criteria, were enrolled in this study. In the 9960 patients, 7242 underwent IVF-ET, 2635 intracytoplasmic sperm injection (ICSI) and 83 IVF+ICSI (rescue ICSI).
Inclusion criteria were
-
(1)
patients receiving fresh cycle;
-
(2)
ovulation induction performed using the standard long-term luteal phase regimen;
-
(3)
available embryo transfer;
-
(4)
patients receiving subcutaneous injection of 250 μg HCG (Aize, Merck Serono SPA, Geneva, Switzerland);
-
(5)
serum β-HCG and E2 levels were detected at 12 hours and 36 hours after HCG trigger;
-
(6)
the first cycle of assisted pregnancy; and
-
(7)
the sterility caused by fallopian tube factors and male factor.
Exclusion criteria were
2.2. Controlled ovarian hyper-stimulation protocol
Subcutaneous injection of short-acting gonadotropin-releasing hormone agonist (0.05–0.1 mg of of Diphereline, Ipsen, Paris, France) was performed once a day in the mid-luteal phase of the previous cycle. After complete pituitary down regulation, gonadotrophin (Gn), a high-purity recombinant follicle stimulating hormone (r-FSH, Merck Serono SPA, Geneva, Switzerland, or HMG, Le Baode, Shanghai Lizhu Pharmaceutical Co. Ltd., Shanghai, China), was used until HCG day. Gn dose was adjusted according to patients’ specific conditions. Oocyte retrieval, insemination, embryo transfer and corpus luteum support were performed according to our routine protocols.[9,10]
2.3. Diagnosis of pregnancy
After 14 and 18 days of embryo transfer, β-hCG>50 mIU/ml was regarded as biochemical pregnancy. Thirty-five days after embryo transfer, ultrasound showing a gestational sac was regarded as clinical pregnancy.
2.4. Determination of HCG and E2 levels
Venous blood (2 to 3 ml) was collected at 12 hours and 36 hours after HCG trigger. The blood was centrifuged at 2000 r/min for 15 minutes. The supernatant was taken and tested using German Roche Automated Chemiluminescence Kits to determine HCG and E2 levels. The intra-assay coefficient of variation was <5% and the inter-assay coefficient of variation was <7%.
2.5. Data analysis
Statistical treatment was performed using SPSS21.0 software. The general data of patients were expressed as mean ± standard deviation (x ± s) and clinical pregnancy rate was expressed as percentage (%). The comparison between two groups was performed using t test. Variance Analysis was used for the comparison among multiple groups. Rate comparison was carried out using chi-square test. The statistical significance was established at P < .05. The correlations of clinical pregnancy rate with pregnancy rate-related factors were analyzed using logistic regression analysis. The OR value and receiver operating characteristic (ROC) curve of the clinical pregnancy rate and a 95% confidence interval were calculated.
3. Results
3.1. General data in the 9960 patients
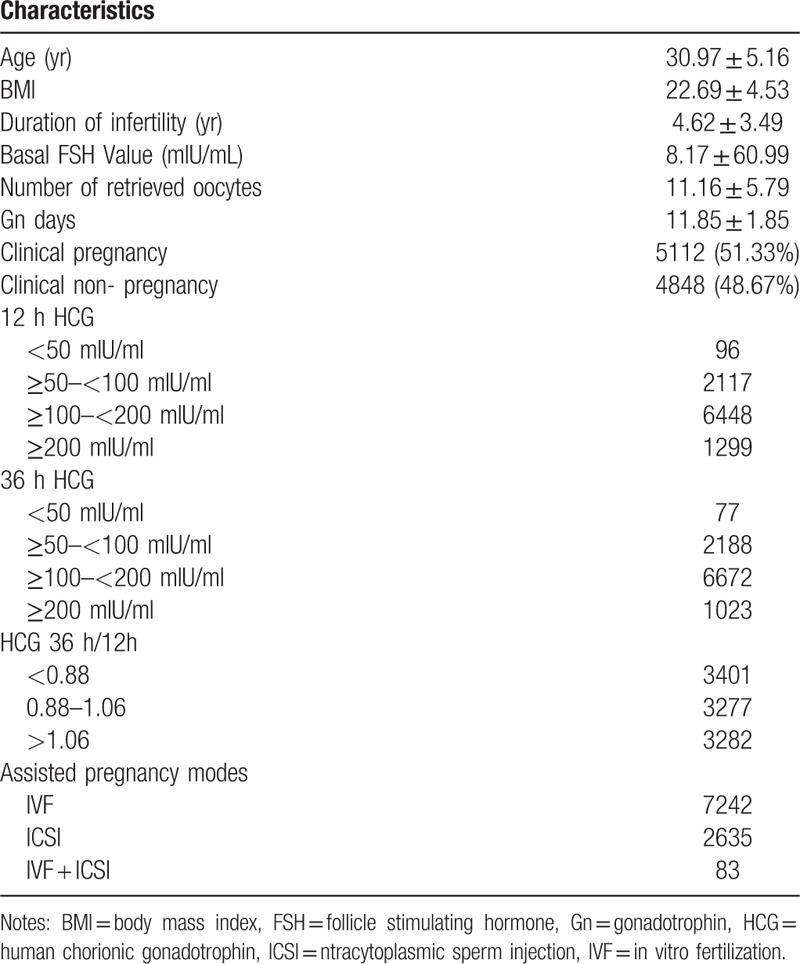
General data of the 9960 cycles in line with the inclusion criteria and the exclusion criteria in this study are shown in Table 1. The patients were 30.97 ± 5.16 (range 20–50) years old and the duration of infertile were 4.62 ± 3.49 years (range 0–23) (Table 1). The total clinical pregnancy rate was 51.33%. According to the serum HCG level after HCG trigger, all patients were divided into 4 groups including <50 mIU/ml, ≥50 and <100 mIU/ml, ≥100 and <200 mIU/ml, and ≥200 mIU/ml groups. According to the serum HCG ratio (36 h/12 h) after HCG trigger, all patients were divided into 3 groups including <0.88, 0.88–1.06 and >1.06 groups (Table 1). According to different assisted pregnancy modes, all patients were divided into 3 groups including IVF, ICSI, and IVF/ICSI groups.
Table 1.
General data of the 9960 patients [x ± s, n(%)].

3.2. Comparison of general data between the clinical pregnant group and non-pregnant group
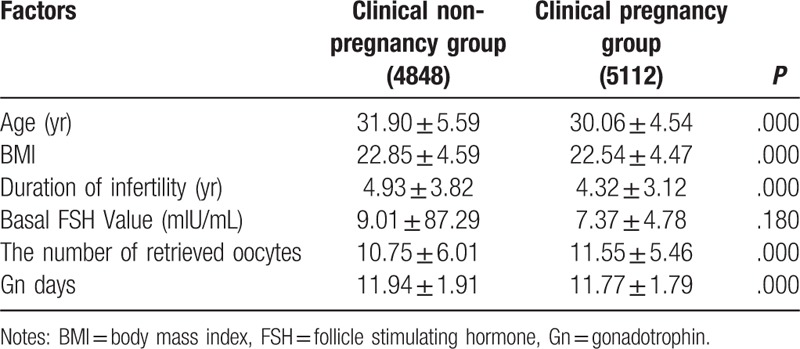
As shown in Table 2, there were significant differences between clinical pregnancy group and non-pregnancy group in age, BMI, duration of infertility, number of retrieved oocytes and Gn days (all P = .000), suggesting that age, BMI, duration of infertility, number of retrieved oocytes and Gn days are related to the clinical pregnancy rate.
Table 2.
Comparison of general data between the clinical pregnant group and non-pregnant group (x ± s).

3.3. Comparison of the clinical pregnancy rate between different HCG level groups
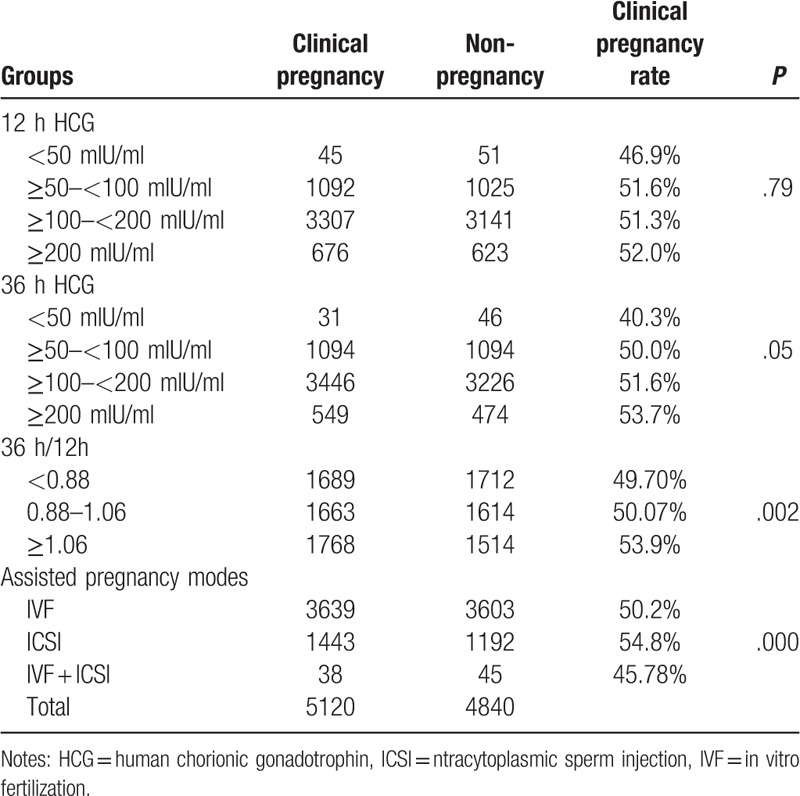
There were no significant differences in the clinical pregnancy rate among the <50 mIU/ml, ≥50 and <100 mIU/ml, ≥100 and <200 mIU/ml, and ≥200 mIU/ml groups at both 12 hours and 36 hours after HCG trigger (all P >.05, Table 3). However, there were significant differences in the clinical pregnancy rate among <0.88, 0.88–1.06 and >1.06 groups (P = .002). Further comparison of 2 groups indicated that the clinical pregnancy rate was significantly higher in the >1.06 group than in the <0.88 (P = .001) and 0.88–1.06 groups (P = .011), but there was no significant difference in the clinical pregnancy rate between the <0.88 group and 0.88–1.06 group (P = .793). Also, there were significant differences in the clinical prgnancy rate among IVF, ICSI, and IVF/ICSI groups (P = .001). Further comparison of 2 groups indicated that the clinical pregnancy rate was significantly higher in the ICSI group than in the IVF group (P = .000), but there were no significant differences in the clinical pregnancy rate between ICSI group and IVF/ICSI group (P = .106) as well as between the IVF group and IVF/ICSI group (P = .419) (Table 3). Based on the above results, the serum HCG ratio (36 h/12 h) and assisted pregnancy mode are related to the clinical pregnancy rate.
Table 3.
The comparison of the clinical pregnancy rate between different groups (n, %).

3.4. Logistic regression analysis for clinical pregnancy rate-related factors
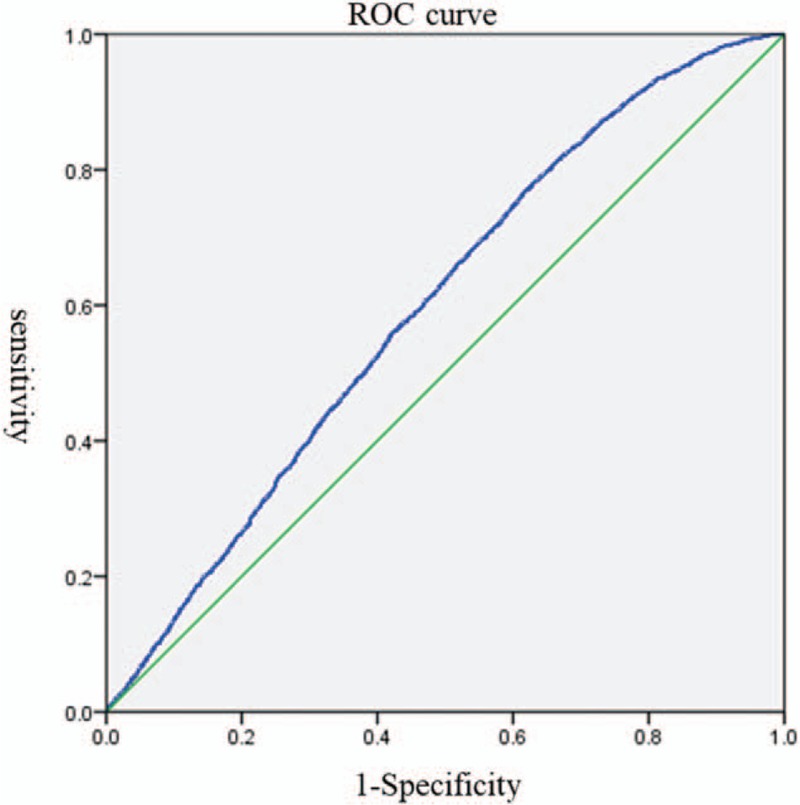
Based on the above results, the clinical pregnancy rate-related factors including age, BMI, duration of infertility, number of retrieved oocytes, Gn days, serum HCG ratio (36 h/12 h) and assisted pregnancy mode underwent logistic regression analysis. Results indicated that the serum HCG ratio >1.06 was significantly correlated with the clinical pregnancy rate (P = .001), suggesting that the serum HCG ratio >1.06 is an independent influencing factor of clinical pregnancy rate. Moreover, the clinical pregnancy rate of HCG ratio (36/12 h) >1.06 group was 1.178 times the clinical pregnancy rate of the HCG ratio (36/12 h) <0.88 group (Table 4). The area under ROC curve was 0.598, sensitivity was 0.631 and specificity was 0.218 (Fig. 1).
Table 4.
Logistic regression analysis for clinical pregnancy rate-related factors.

Figure 1.

ROC curve for pregnancy after correcting confounding factors. Notes: ROC: receiver operating characteristic; area under the curve (AUC): 0.598; Sensitivity: 0.631; Specificity: 0.218.
3.5. Comparison of some factors among the HCG ratio (36 h/12 h) <0.88, 0.88–1.06 and >1.06 groups
Some factors including age, BMI, Basel FSH, E2 level, duration of infertility, number of retrieved oocytes and Gn days were compared among the HCG ratio (36 h/12 h) <0.88, 0.88–1.06 and >1.06 groups and results indicated that when the serum HCG ratio (36 h/12 h) was more than 1.06, the serum E2 level at 36 hours significantly decreased and the number of retrieved oocytes significantly increased as compared with the HCG ratio (36 h/12 h) <0.88 and 0.88–1.06 groups (all P = .000) (Table 5). However, there were no significant differences in age, BMI, basal FSH, Gn days and duration of infertility among the HCG ratio (36 h/12 h) <0.88, 0.88–1.06 and >1.06 groups (Table 5).
Table 5.
Comparison of clinical pregnancy rate-related factors between different HCG ratio (36 h/12 h) groups.

4. Discussion
Accurate and appropriate application of HCG in IVF-ET is essential for obtaining good pregnancy outcome. At present, it has reported that the serum HCG level after HCG trigger is related to the number of retrieved oocytes, MII rate, BMI and pregnancy rate.[11–13] However, there are some opposite opinions.[3,5] This may be due to different sample sizes, patients’ specific conditions and ovarian hyper-stimulation protocols. Therefore, we carried out the large-sample study in which the patients with low response and high response were excluded and all patients received the luteal phase standard long-term program in order to find relatively accurate conclusion for this issue. The results of this study indicated that the serum HCG level at 12 hours and 36 hours after HCG trigger all failed to influence the clinical pregnancy rate, but the serum HCG ratio (36 h/12 h) >1.06 was signifiacntly correlated with the clinical pregnancy rate as compared with the HCG ratio (36 h/12 h) of 0.88–1.06 or <0.88. Logistic regression analysis suggested that the serum HCG ratio >1.06 is a predictive factor for the clinical pregnancy rate. When the serum HCG ratio (36 h/12 h) was more than 1.06, the clinical pregnancy rate was significantly increased, the number of retrieved oocytes was also significantly increased, but the serum E2 level at 36 hours after HCG trigger was significantly decreased as compared with HCG ratio (36 h/12 h) of 0.88–1.06 or <0.88.
In 1991, Saal et al[14] compared HCG half-life and time of serum HCG concentration peak after use of 5000 IU of HCG between intramuscular injection and subcutaneous injection, and found that compared with intramuscular injection, the peak of serum HCG concentration was significantly delayed (P = .01) and the serum half-life was significantly prolonged (P = .01) in subcutaneous injection. Shah et al[15] also reported that the serum HCG concentration peak, area under the curve (AUC) and average HCG concentration were significantly higher in the intramuscular injection than in the subcutaneous injection. Therefore, the serum HCG concentration at the same time point after HCG trigger varies according to different ways of administration. In most previous studies, the effect of HCG concentration only at 12 hours or 36 hours on pregnancy outcome was observed. In order to thoroughly and dynamically observe the effects of HCG concentration on the clinical pregnancy rate, we observed the effects of HCG concentrations both at 12 hours and at 36 hours after HCG trigger as well as HCG ratio (36 h/12 h) on the clinical pregnancy rate in this study.
Stefanis et al[16] retrospectively analyzed the correlations of HCG levels at 12 hours and 36 hours after 5000 IU HCG subcutaneous injection with BMI, number of retrieved oocytes and pregnancy outcome in 149 IVF-assisted patients and found that there were no correlations of HCG levels with BMI, number of retrieved oocytes, fertilization rate and biochemical pregnancy rate. A prospective study indicated that there were no correlations of the serum HCG level at 36 hours after recombinant HCG injection with number of retrieved oocytes and clinical pregnancy rate, but there were negative correlations of the serum HCG level with BMI and age.[3] Zhou et al[1] believe that the blood HCG level at 12 hours after HCG injection may be used as a predictive value for IVF/ICSI clinical outcome, namely that when blood HCG level is more than 201.2 mIU/ml, the clinical pregnancy rate significantly improved with a sensitivity of 74.6% and a specificity of 61.7%.
To date, there is still considerable debate about whether the serum HCG level after HCG injection can predict IVF/ICSI pregnancy outcome. In order to further clarify this issue, this study retrospectively analyzed 9960 IVF/ICSI cycles. The results of this study indicated that the serum HCG levels at 12 hours and 36 hours after HCG injection all failed to influence the clinical pregnancy rate, but the serum HCG ratio (36 h/12 h) >1.06 was significantly correlated the clinical pregnancy rate and the number of retrieved oocytes as compared with the HCG ratio (36 h/12 h) of 0.88–1.06 or <0.88, demonstrating that the serum HCG ratio (36 h/12 h) is related to the clinical pregnancy rate and the number of retrieved oocytes.
Embryo quality and endometrial receptivity are the key factors associated with pregnancy outcomes. One of HCG important roles is to regulate endometrial receptivity.[17,18] Schumacher et al[19] have found that HCG can attract immune T lymphocytes which regulate maternal and infant immune tolerance. In addition, current studies suggested that controlled ovulation-induced serum E2 level may affect endometrial receptivity.[20–23] Valbuena et al[24] have reported that high E2 level (range 10–8M to 10–4M) can affect embryo quality and embryo implantation rate. It has been demonstrated that the super-physiological dose of serum E2 can decrease the endometrial receptivity, although the relevant mechanism is not clear.[25,26] In this study, the E2 level was significantly lower in the HCG ratio (36 h/12 h)>1.06 group than in the HCG ratios (36 h/12 h) of 0.88–1.06 and <0.88 groups, which may be conducive to pregnancy.
In summary, the HCG levels at 12 hours and 36 hours after HCG trigger are not related to the clinical pregnancy rate, but the HCG ratio (36 h/12 h) is related to the clinical pregnancy rate because when the serum HCG ratio (36 h/12 h) was >1.06, the clinical pregnancy rate significantly increased as compared with the serum HCG ratios of <0.88 and 0.88–1.06. Low E2 level in the serum HCG ratio (36 h/12 h) >1.06 group may be conducive to pregnancy. The serum HCG ratio of 1.06 was significantly correlated with the clinical pregnancy rate, so it may be used as a predictor of IVF-ET clinical pregnancy rate.
Footnotes
Abbreviations: AUC = area under the curve, BMI = body mass index, E2 = estrogen, Gn = gonadotropin, HCG = human chorionic gonadotrophin, ICSI = intracytoplasmic sperm injection, IVF-ET = in vitro fertilization-embryo transfer, MII = metaphase II, ROC = receiver operating characteristic.
How to cite this article: Zhang Yl, Wang Fz, Huang K, Hu Ll, Bu Zq, Sun J, Su Yc, Guo Yh. Factors predicting clinical pregnancy rate of in vitro fertilization-embryo transfer (a STROBE-compliant article). Medicine. 2019;98:50(e18246).
YLZ and FZW equally contributed to this study.
The authors have no funding and conflicts of interest to disclose.
References
- [1].Zhou J, Wang S, Wang B, et al. The value of HCG serum concentrations after trigger in predicting pregnancy and live birth rates in IVF-ICSI. Reprod Biomed Online 2015;30:667–73. [DOI] [PubMed] [Google Scholar]
- [2].Pereira N, Elias RT, Neri QV, et al. Adjuvant gonadotrophin-releasing hormone agonist trigger with human chorionic gonadotrophin to enhance ooplasmic maturity. Reprod Biomed Online 2016;33:568–74. [DOI] [PubMed] [Google Scholar]
- [3].Matorras R, Meabe A, Mendoza R, et al. Human chorionic gonadotropin (hCG) plasma levels at oocyte retrieval and IVF outcomes. J Assis Repro Genet 2012;29:1067–71. [DOI] [PMC free article] [PubMed] [Google Scholar]
- [4].Lin H, Wang W, Li Y, et al. Triggering final oocyte maturation with reduced doses of hCG in IVF/ICSI: a prospective, randomized and controlled study. Eur J Obstet Gynecol Reprod Biol 2011;159:143–7. [DOI] [PubMed] [Google Scholar]
- [5].Levy G, Hill MJ, Ramirez C, et al. Serum human chorionic gonadotropin levels on the day before oocyte retrieval do not correlate with oocyte maturity. Fertil Steril 2013;99:1610–4. [DOI] [PMC free article] [PubMed] [Google Scholar]
- [6].The Rotterdam ESHRE/ASRM-sponsored PCOS consensus workshop group. Revised 2003 consensus on diagnostic criteria and long-term health risks related to polycystic ovary syndrome (PCOS). Hum Reprod 2004;81:19–25. [Google Scholar]
- [7].Ferraretti AP, La Marca A, Fauser BC, et al. ESHRE consensus on the definition of ‘poor response’ to ovarian stimulation for in vitro fertilization: the Bologna criteria. Hum Reprod 2011;26:1616–24. [DOI] [PubMed] [Google Scholar]
- [8].Mascarenhas M, Balen AH. The high responder: a rewiew of pathophysiology and outcomes during IVF treatment. Hum Fertil 2017;20:155–67. [DOI] [PubMed] [Google Scholar]
- [9].Zhang YL, Wang XY, Wang F, et al. Clinical analysis of spontaneous pregnancy reduction in the patients with multiple pregnancies undergoing in vitro fertilization/intracytoplasmic sperm injection-embryo transfer. Int J Clin Exp Med 2015;8:4575–80. [PMC free article] [PubMed] [Google Scholar]
- [10].Zhang YL, Sun J, Su YC, et al. Ectopic pregnancy in frozen-thawed embryo transfer: a retrospective analysis of 4034 cycles and related factors. Syst Biol Reprod Med 2013;59:34–7. [DOI] [PubMed] [Google Scholar]
- [11].Chang P, Kenley S, Burns T, et al. Recombinant human chorionic gonadotropin (rhCG) in assisted reproductive technology: results of a clinical trial comparing two doses of rhCG (Ovidrel) to urinary hCG (Profasi) for induction of final follicular maturation in in vitro fertilization-embryo transfer. Fertil Steril 2001;76:67–74. [DOI] [PubMed] [Google Scholar]
- [12].Chan CC, Ng EH, Tang OS, et al. A prospective, randomized, double-blind study to compare two doses of recombinant human chorionic gonadotropin in inducing final oocyte maturity and the hormonal profile during the luteal phase. J Clin Endocrinol Metab 2005;90:3933–8. [DOI] [PubMed] [Google Scholar]
- [13].Decleer W, Seynhave B, Osmanagaoglu K, et al. Comparison of hCG triggering versus hCG in combination with a GnRH agonist: a prospective randomized controlled trial. Facts Views Vis Obgyn 2014;6:203–9. [PMC free article] [PubMed] [Google Scholar]
- [14].Saal W, Glowania HJ, Hengst W, et al. Pharmacodynamics and pharmacokinetics after subcutaneous and intramuscular injection of human chorionic gonadotropin. Fertil Steril 1991;56:225–9. [PubMed] [Google Scholar]
- [15].Shah DK, Missmer SA, Correia KF, et al. Pharmacokinetics of human chorionic gonadotropin injection in obese and normal weight women. j Clin Endocrinol Metab 2014;99:1314–21. [DOI] [PMC free article] [PubMed] [Google Scholar]
- [16].Stefanis P, Das S, Barsoum-Derias E, et al. Relationship between serum human chorionic gonadotrophin levels and body mass index in women undergoing in vitro fertilisation cycles. Eur J Obstet Gynecol Reprod Biol 2007;132:204–8. [DOI] [PubMed] [Google Scholar]
- [17].Chen L, Xie Y, Fan J, et al. HCG induces (1, 4-GalT I expression and promotes embryo implantation. Int j Clin Exp Pathol 2015;8:4673–83. [PMC free article] [PubMed] [Google Scholar]
- [18].Racicot KE, Wunsche V, Auerbach B, et al. Human chorionic gonadotropin enhances trophoblast-epithelial interaction in an in vitro model of human implantation. Reprod Sci 2014;21:1274–80. [DOI] [PMC free article] [PubMed] [Google Scholar]
- [19].Schumacher A, Brachwitz N, Sohr S, et al. Human chorionic gonadotropin attracts regulatory T cells into the fetal-maternal interface during early human pregnancy. J Immunol 2009;182:5488–97. [DOI] [PubMed] [Google Scholar]
- [20].Kosmas IP, Kolibianakis EM, Devroey P. Association of estradiol levels on the day of hCG administration and pregnancy achievement in IVF: a systematic review. Hum Reprod 2004;19:2446–53. [DOI] [PubMed] [Google Scholar]
- [21].Schumacher A, Heinze K, Witte J, et al. Human chorionic gonadotropin as a central regulator of pregnancy immune tolerance. J Immunol 2013;190:2650–8. [DOI] [PubMed] [Google Scholar]
- [22].Sharara FI. Low and high responders-at what levels of serum estradiol do things start to get fuzzy? Fertil Steril 1999;71:583–6. [DOI] [PubMed] [Google Scholar]
- [23].Ullah K, Rahman TU, Pan HT, et al. Serum estradiol levels in controlled ovarian stimulation directly affect the endometrium. J Mol Endocrinol 2017;59: JME-17-0036. [DOI] [PMC free article] [PubMed] [Google Scholar]
- [24].Valbuena D, Martin J, de Pablo JL, et al. Increasing levels of estradiol are deleterious to embryonic implantation because they directly affect the embryo. Fertil Steril 2001;76:962–8. [DOI] [PubMed] [Google Scholar]
- [25].Basir GS, O WS, Ng EH, et al. Morphometric analysis of peri-implantation endometrium in patients having excessively high estradiol concentrations after ovarian stimulation. Hum Reprod 2001;16:435–40. [DOI] [PubMed] [Google Scholar]
- [26].Tavaniotou A, Smitz J, Bourgain C, et al. Ovulation induction disrupts luteal phase function. Ann N Y Acad Sci 2001;943:55–63. [DOI] [PubMed] [Google Scholar]


