Abstract
The purpose of this study is to evaluate the biometric parameters of crystalline lens components and to find effective factors for predicting postoperative intraocular lens (IOL) position. This retrospective study included 97 eyes from 97 patients with a mean age of 63.00 ± 12.38 (SD) years. The biometric measurements were performed by means of a 3-dimensional optical coherence tomography (3D-OCT) device. Specifically, anterior chamber depth (ACD), aqueous depth (AD), lens thickness (LT), lens meridian parameter (LMP), white-to-white diameters (WTW), anterior segment length (ASL), the anterior part of lens (aLT), and the posterior part of lens (pLT) were measured. Additionally, axial length (AL) and corneal radius (CR) were measured by the partial coherence interferometry. Ninety-seven eyes were divided into thin lens group (LT < 4.5 mm) and thick lens group (LT ≥ 4.5 mm). The differences between the above two groups were also analyzed. Postoperative IOL position was measured by 3D-OCT at 3 months postoperatively and regression formulas for predicting postoperative IOL position were developed by various combinations of preoperative factors. As lens thickened, ACD and AD became shallow (all P < .001). AD, ACD, ASL, aLT, and pLT showed statistically significant differences between two subgroups classified on the basis of LT (all P < .001). Meanwhile, the value obtained by subtracting aLT from pLT did not show any association with the other biometric measurements. The combination of ACD, aLT, pLT, AL, CR, and WTW showed the highest correlation with postoperative IOL position (R2 = 0.536, P < .001). In conclusion, pLT–aLT was an independent factor not affected by any other variables and did not show significant difference between thin lens group and thick lens group. The subdivision of the lens structure using 3D-OCT helps to predict postoperative IOL position.
Keywords: cataract, intraocular lens, optical coherence tomography
1. Introduction
Optical coherence tomography (OCT) is a non-invasive, high-resolution imaging technology that provides in vivo cross-sectional images of the ocular structures.[1,2] The use of OCT is progressively increasing as it provides accurate measures and is fast, safe, and comfortable for patients and operators. Recent studies have demonstrated that the application of anterior segment-optical coherence tomography (AS-OCT) is useful in preoperative planning for cataract surgery, including the delineation of the anterior chamber structure.[3–6]
In the last years, the interest in the thickness of the crystalline lens has grown. Preoperative anterior chamber depth (ACD) has shown a positive correlation with axial length (AL)[7–12] and a negative correlation with lens thickness (LT). LT increases with the aging process and formation of cataract. Jonas et al[13] concluded that the development of cataracts provokes a slight forward movement of the center of the crystalline lens. Furthermore, LT is considered in newly developed intraocular lens (IOL) calculation formulas such as the Barret-Universal II,[14] Holladay 2,[14] and Olsen[15] formulas.
In recent years, research results have been published in which the thickness of the cataractous lens is segmented by OCT to predict postoperative IOL position. Shammas formula[16] introduced the combination of antenuclear distance (AND) and nuclear thickness (NT) measured by optical low-coherence reflectometry. Goto et al[17] also found that angle-to-angle depth measured by AS-OCT was a good predictor of postoperative ACD.
The detailed knowledge about the shape and thickness of the crystalline lens gets very important when femtosecond laser-assisted cataract surgery (FLACS) is considered. In fact, some advanced FLACS platforms include OCT based systems to identify and measure the lens structures. In particular, the Catalys Precision Laser System includes 3-dimensional OCT (3D-OCT) and measures axial and sagittal sectional scanned images. The scanned capsule provided by the built-in algorithm of the laser system is an imaginary line of the crystalline lens seen from the anterior and posterior capsule. A previous study showed that the scanned capsule center from preoperative crystalline lens was closest to the postoperative IOL center on the lens equatorial plane and thus, the best landmark for the crystalline lens was the scanned capsule center by Catalys 3D-OCT.[18]
The aim of this study is to evaluate the biometric parameters of the anterior segment structures of the eye using Catalys 3D-OCT and to verify that the measurement provided by 3D-OCT will be a better predictor for postoperative IOL position.
2. Methods
This retrospective study includes 97 eyes from 97 patients who were scheduled for FLACS from September 2016 to March 2017. Informed consent was obtained from all patients before study start, and the study adhered to the tenets of the Declaration of Helsinki for the use of human participants in biomedical research. The Institutional Review Board (IRB # KC13DISI0534) for Human Studies, Seoul St. Mary Hospital (Seoul, Republic of Korea), approved this study.
The exclusion criteria included previous ocular surgery, corneal diseases, pseudoexfoliation, insufficient pupil dilation to interfere with laser emission, zonular weakness, corneal astigmatism >1.00 diopters, glaucoma, macular disease, and amblyopia. Eyes in which laser pretreatment could not be completed because of unintentional loss of suction were also excluded.
After sufficient pupillary dilation was confirmed, the measurements were performed with the Catalys Precision Laser System (Abbott Medical Optics, Abbott Laboratories Inc., Abbott Park, IL). All procedures were performed under topical anesthesia with 0.5% proparacaine hydrochloride (Alcaine, Alcon Laboratories, Fort Worth, TX).
Figure 1 shows the biometric measurements provided by the 3D-OCT in Catalys Precision Laser System. 3D-OCT shows the scanned capsule which is an imaginary line of the crystalline lens seen from the anterior and posterior capsule, provided by the built-in algorithm of the laser system. The equator plane is a straight line connecting both ends of the imaginary lines. It measures ACD (the distance along the visual axis between the corneal epithelium and the anterior lens surface), aqueous depth (AD: as the distance from the corneal endothelium to the lens), LT, vertical/horizontal white-to-white diameters (WTW), and lens meridian parameter (LMP). The LMP is defined as the length from the anterior surface of central cornea to the crystalline lens equatorial plane. The equatorial lens plane was determined by two meridians of lens equator, which was estimated by the imaginary line connecting the anterior and posterior capsule surface imaged with 3D-OCT in femtosecond laser machine for cataract surgery. The anterior segment length (ASL) was calculated by adding LT to ACD and we evaluated ASL. The anterior part of crystalline lens (aLT), the posterior part of crystalline lens (pLT), the ratio of posterior to anterior part (pLT/aLT) and the difference between anterior and posterior part (pLT − aLT) were calculated.
Figure 1.
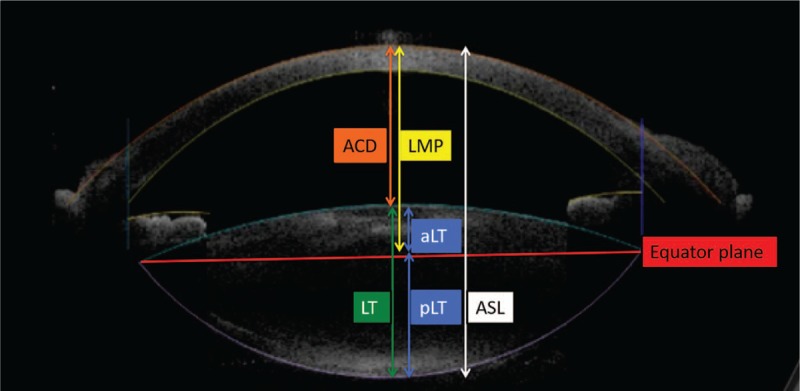
Biometric measurements provided by 3D-OCT. 3D-OCT shows the scanned capsule, which is an imaginary line of the crystalline lens seen from the anterior and posterior capsule, provided by the built-in algorithm of the laser system. The equator plane is a straight line connecting both ends of the imaginary lines. Anterior chamber depth (ACD) is determined by calculating the distance along the visual axis between the corneal epithelium and the anterior lens surface by OCT while aqueous depth (AD) is defined as the distance from the corneal endothelium to the lens. Lens meridian parameter (LMP) is the vertical distance from the corneal apex to the equator plane of the crystalline lens. The anterior segment length (ASL) was calculated by adding LT to ACD. The crystalline lens was analyzed by dividing it into anterior part (aLT) and posterior part (pLT), bordered by the equator plane.
The AL and mean corneal radius (CR) was measured with an IOL Master optical biometry (version 5, Carl Zeiss Meditec, Germany). The changes in biometric measurements by 3D-OCT according to AL by partial coherence interferometry (PCI) and patient age were analyzed. We also investigated the relationship between LT and other biometric measurements. To understand the morphological characteristics of the crystalline lens more precisely, we analyzed the correlation between pLT/aLT or pLT − aLT value and other measurements.
After completion of the laser emission procedure, the vacuum interface was removed and the patient was transported to a day-surgery operation room and cataract surgery was performed by one surgeon (CKJ). All of the cataract surgeries were performed using the Ozil torsional hand piece with the Infiniti Vision System (Alcon). Following phacoemulsification, 1 type of IOL (ZCB00, Johnson & Johnson) was inserted into the capsular bag. No intraoperative complications occurred. Figure 2 shows Postoperative IOL position or postoperative ACD. It was measured with the same 3D-OCT at 3 months postoperatively and defined as the distance along the visual axis between the corneal epithelium and the anterior surface of IOL center. The disposable vacuum interface was fixed to the globe using a suction ring and the laser aperture was engaged with the vacuum interface-globe complex.
Figure 2.
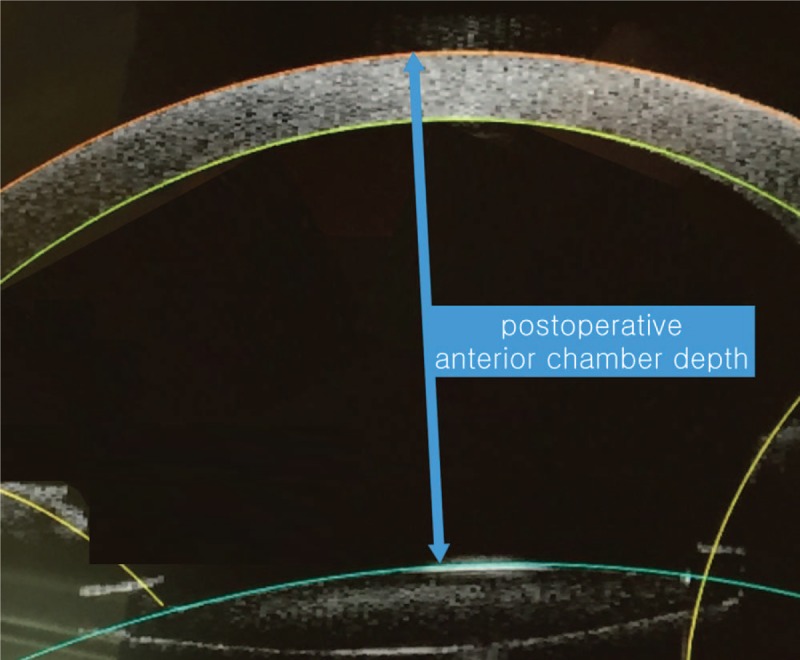
Postoperative intraocular lens (IOL) position or anterior chamber depth.
Postoperative ACD was measured after complete connection. Preoperative measurements were divided into two groups; external measurements (AL, CR, horizontal WTW), internal measurements (ACD [by PCI], ACD [by 3D-OCT], LMP, ASL, LT, aLT, and pLT). We developed various combinations of regression equations based on preoperative biometric measurements for predicting postoperative ACD.
Statistical analysis was performed using SPSS statistical software (version 20.0, SPSS, Inc., Chicago, IL). The Pearson correlation coefficient (r) was used to evaluate each correlation statistically. Ninety-seven eyes were divided into thin lens group (LT < 4.5 mm) and thick lens group (LT ≥ 4.5 mm) and we determined the significance of the biometric measurements between two subgroups according to LT with the Mann–Whitney U test. Multiple linear regression was used to determine which combination was most accurate in predicting postoperative ACD. The level of significance was set at 0.05.
3. Results
Mean patient age was 63.00 ± 12.38 (SD) years (range: 38–87 years); 59 (60.1%) were women and 38 (39.9%) were men. Table 1 shows the biometric measurements by 3D-OCT and AL by PCI. The changes in biometric measurements with age, AL, and LT are given in Table 2. AL was negatively correlated with age (r = −0.316, P < .001). On the contrary, age was negatively correlated with AD, ACD, LMP, horizontal/vertical WTW, and positively correlated with LT (all P < .001). ASL did not show statistical correlation with age or AL (r = −0.060, P = .560; r = 0.179, P = .079). As the crystalline lens thickened, AD and ACD became shallow (all P < .001). Correlation coefficients with the anterior and posterior part of the lens were 0.806 and 0.816 (all P = .000), respectively. ASL was positively correlated with LT (r = 0.404, P < .001).
Table 1.
Demographic data.
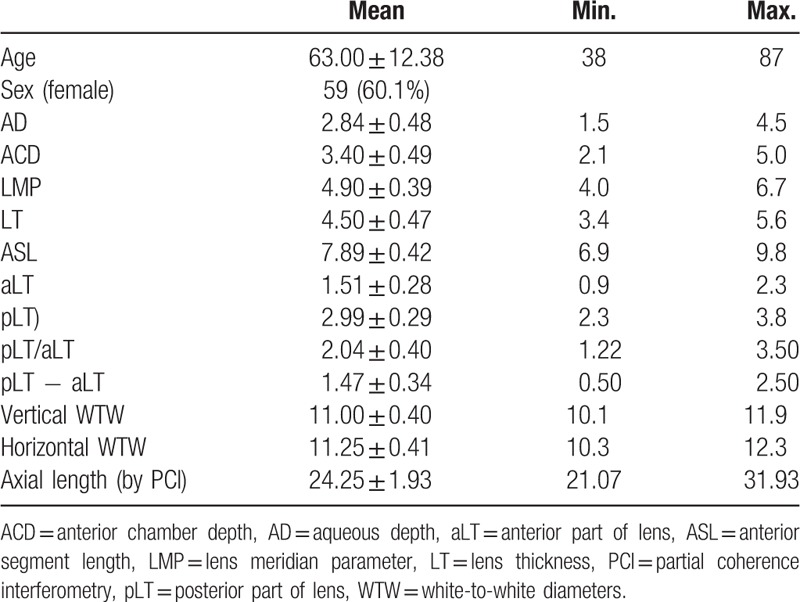
Table 2.
Pearson correlation coefficient between each parameter and patient age.
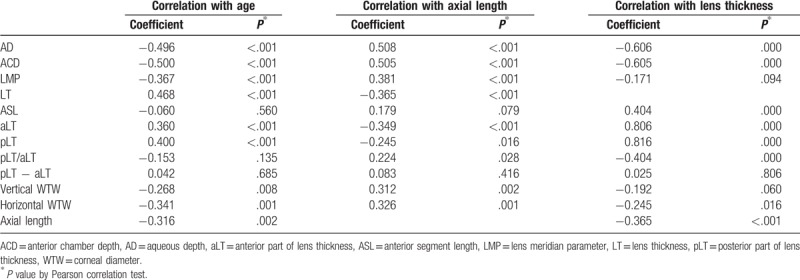
Table 3 shows the measurements of the two subgroups according to the LT. AD, ACD, ASL, anterior and posterior part of the lens showed statistically significant differences between subgroups with regard to LT (all P < .001). The pLT/aLT ratio was different between the two subgroups, with the thicker lens showing a lower pLT/aLT ratio. In contrast, the thicker lens group did not show statistically significant differences compared to the thinner lens group regarding LMP, pLT − aLT, as well as horizontal and vertical WTW diameters (P = .399, .826, .236, and .246, respectively).
Table 3.
A total of 97 eyes were stratified by lens thickness (LT).
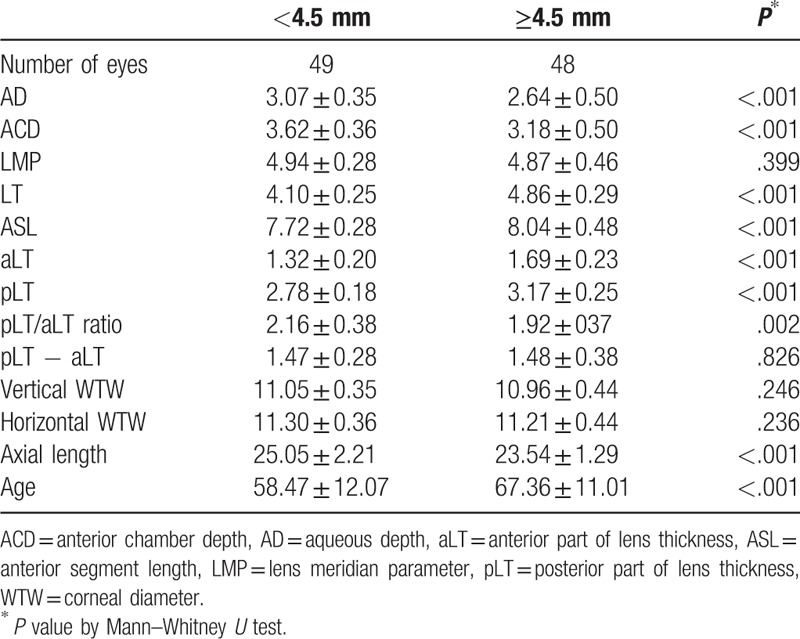
Table 4 shows that the pLT/aLT ratio was positively correlated with AD and ACD (r = 0.400, P < .001; r = 0.412, P < .001) and negatively correlated with LT and the anterior part of the lens (r = −0.404, P < .001; r = −0.843, P < .001). The pLT − aLT did not show any association with the other biometric measurements.
Table 4.
Pearson correlation coefficient between each parameter the ratio of posterior to anterior part (pLT/aLT) and the difference between anterior and posterior part (pLT − aLT).

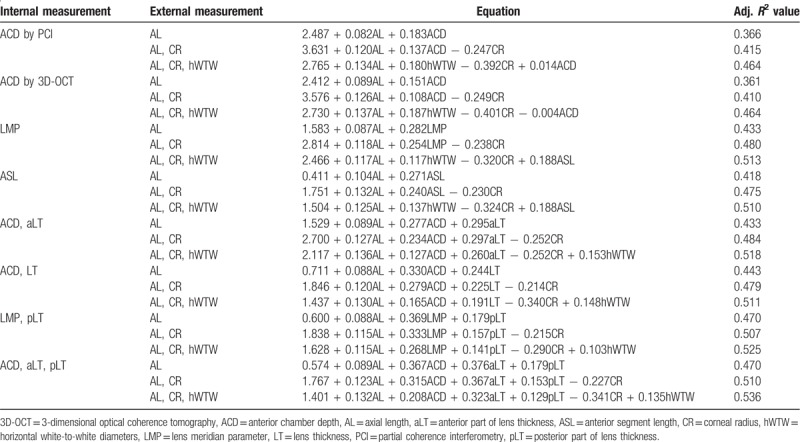
Mean postoperative ACD was 5.02 mm (standard deviation; 0.25 mm) and multiple linear regression equations for predicting postoperative IOL position are listed in Table 5. All of the equations statistically significant (all P < .001) while, the results of regression equations adopting LMP as a variable showed greater value of R2 than those when ACD was included as a variable. In addition, when the two internal variables were used, the combination of LMP and pLT was more predictive than the combination of ACD and LT. The best results were obtained when three internal variables (ACD by 3D-OCT, aLT, and pLT) were used (R2 = 0.470 for ACD by 3D-OCT, aLT, pLT, and AL; 0.510 for ACD by 3D-OCT, aLT, pLT, AL, and CR; 0.536 for ACD by 3D-OCT, aLT, pLT, AL, CR, and horizontal WTW).
Table 5.
Multiple linear regression analysis for predicting postoperative anterior chamber depth after the implantation of one-piece intraocular lens (IOL).
4. Discussion
In this study, we evaluated the biometric measurements provided by 3D-OCT and confirmed that the analysis of the LT by the 3D-OCT-based segmentation is helpful in predicting the postoperative lens position. Especially, when the cataractous lens was divided into two parts based on the equator line and analyzed with the ACD, the predictive accuracy was the highest.
ACD and LT change with patient age.[13,18–20] As shown in prior studies, our study also demonstrated that both AD and ACD decreased with the aging process. In contrast to AD and ACD, the crystalline lens was thicker in older patients. LT showed an inverse relationship with ACD and increased with age. Our findings were similar to the results of a study using optical low-coherence reflectometry with an 820-μm super luminescent diode.[21] ASL did not show a statistically significant correlation with age. Koretz et al[22] had the same conclusion using Scheimpflug photography and magnetic resonance imaging. Although Dubbelman et al[23] and Jonas et al[13] demonstrated controversial results using Scheimpflug photography combined with optical AL measurements and ultrasound, differences in the correlation might be due to the study population.
In contrast, AL showed positive correlations with AD/ACD and a negative correlation with LT, which may have two reasons. First, AL was negatively correlated with age in the population of this study. This association might be explained by genetic and environmental factors[24] and is similar to the results of a study of a southern Chinese population.[25] The authors relate these results to the rapidly increasing prevalence of myopia in East Asian people.[26] Secondly, longer eyes can have thinner lenses. In this study, we also measured WTW and analyzed the relationship with the other measurements. Both horizontal and vertical WTW showed a negative correlation with patient age and a positive correlation with AL. WTW was proven to be negatively correlated with corneal steepness,[27] and corneal power has been reported to be negatively correlated with AL.[8,24,28] Cui et al[25] also found that horizontal WTW was significantly correlated with age and AL in 6750 eyes of cataract candidates. This may be attributed to the interaction between the optical elements. Although it was traditionally accepted that the differences in refractive error were caused by differences in AL and the refractive power of cornea and lens was supposed to be constant,[27] since the mid-twentieth century many studies demonstrated that coordinated interactions between the ocular components of refraction lead to a higher prevalence of emmetropia than the expected value based only on AL.[29,30] Consequently, a longer eye has a less powerful lens and a flatter cornea, while a shorter eye has a more powerful lens and a steeper cornea. In our study, horizontal WTW was negatively correlated with LT which can be explained by the same conclusion.
Prior studies investigating LT or ASL used magnetic resonance imaging,[31] ultrasound,[8,13] and optical reflectometer,[21] while we used OCT and measured directly via images. 3D-OCT in our study obtained images with a wavelength of 830 nm and provided axial and lateral resolutions of 30 and 15 μm, respectively. This technique has the advantage of showing each structure covered by a liquid optic interface with a clear aperture of 13.5 mm. OCT scans from the corneal epithelium to the posterior capsule of lens can be viewed on one image due to a greater depth of field.
In our sample, the thickness of the posterior part of the crystalline lens was 2.04 times the thickness of the anterior part, and the pLT/aLT ratio was inversely correlated with LT. As the crystalline lens thickened, a relative portion of the posterior part became thinner. Only pLT − aLT was independent of other indicators. Although the difference in LT between thinner lenses and thicker lenses was 0.76 mm, the difference in pLT − aLT was 0.01 mm in the subgroup analysis based on LT. This means that the increment in thickness of the anterior part was identical to the increment in thickness of the posterior part.
Preoperative OCT measurements would be helpful for improving the predictive accuracy of IOL power. Tang et al[32] concluded that OCT-based IOL power calculation produced the least mean absolute error and the highest predictive accuracy. The accurate measurement of ACD is essential for the prediction of IOL position.[33,34] Many studies have shown that postoperative ACD is related to preoperative ACD and the Haigis formula[35] considers preoperative ACD for the prediction of effective lens position. However, it is insufficient to consider ACD only. As demonstrated in this study, ACD was negatively correlated with LT. As both ACD and LT changed with age, an age-related predictive error might occur. Consequently, the importance of LT has been highlighted in recent studies.[15,16] The Olsen formula includes the concept of the C constant. The C constant is related to the IOL type, determined as the mean value calculated from representative samples. A new formula proposed by Shammas considers the distance from the corneal apex to the anterior surface of lens nucleus and the thickness of the lens nucleus measured with optical low-coherence reflectometry. As discussed above, the lens shape did not show a constant pLT/aLT ratio due to the progression of cataract or thickening of the lens. LMP provided by 3D-OCT showed higher predictability than ACD when combined with external measurements including AL, CR, and horizontal white-to-white diameters (hWTW). Even when two internal measurements were combined, the combination of LMP and PT was more predictive than the combination of ACD and LT regardless of external measurements. The highest correlation was obtained when ACD, aLT, pLT, and all the external measurements were considered. The new IOL formulas considering LMP and lens shape should help to improve the prediction of IOL power in the future study.
Our study has some limitations. First, non-cataractous lenses were not included in this study. Shammas[21] analyzed two lens spikes and two additional spikes indicating the anterior and the posterior surfaces of the nucleus measured by optical low-coherence reflectometry and concluded that the cataractous lens showed a statistically significant difference only in the anterior cortical space compared with the clear lens. In contrast, LT showed a statistically positive correlation with both anterior cortical space and posterior cortical space. A population-based cross sectional study or follow-up cohort study would be helpful for investigating the aging process of the crystalline lens more precisely. Second, we did not consider the differences in sex and ethnicity. In general, mean AL in males is known to be longer than in females.[18–20,36] LT and ASL are also greater in males.[13] Classification according to the gender will enhance the predictability for lens shape. As the prevalence of myopia in East Asian people is increasing, age may be a confounding factor for analyzing the relationship between AL and LT. Comparative studies with other ethnicities are needed to investigate the association between AL and LT more accurately. Third, we did not evaluate the grade of cataract. Cataract density may have a stronger impact on the ACD than age, as it is correlated to the age. Future studies will need to classify cataract by grade and analyze. Finally, we did not evaluate the repeatability of measurement by 3D-OCT. Due to the fact that the lens parameters are calculated by proprietary software built into the laser system, repeatability and accuracy of the measurements are unknown. However, since the measurement is made only after the perfect fixation of the disposable vacuum interface to the globe using a suction ring, the accuracy is expected to be high, and further verification will be needed in the future.
In conclusion, the present study determined the biometric parameters of the anterior segment of the eye and correlations between the parameters. Elder patients had thicker preoperative lenses, shorter AL, and shallower AD and ACD. When the LT was divided into two parts around the equator line, the difference between the posterior part and the anterior part was the only factor that was not significantly affected by other variables. In addition, when the anterior segment structure was subdivided into the anterior chamber, anterior part of lens (aLT), posterior part of lens (pLT), and the variables were assigned, the postoperative IOL position could be predicted most accurately.
Author contributions
Conceptualization: Young-Sik Yoo, Woong-Joo Whang, Hyun-Seung Kim, Choun-Ki Joo, Geunyoung Yoon.
Data curation: Woong-Joo Whang.
Formal analysis: Young-Sik Yoo, Woong-Joo Whang.
Methodology: Young-Sik Yoo, Woong-Joo Whang, Hyun-Seung Kim, Choun-Ki Joo.
Resources: Choun-Ki Joo.
Supervision: Woong-Joo Whang, Hyun-Seung Kim.
Validation: Young-Sik Yoo, Woong-Joo Whang, Geunyoung Yoon.
Writing – Original Draft: Woong-Joo Whang.
Writing – Review & Editing: Woong-Joo Whang.
Woong-Joo Whang orcid: 0000-0002-2018-5693.
Footnotes
Abbreviations: 3D-OCT = 3-dimensional optical coherence tomography, ACD = anterior chamber depth, AD = aqueous depth, AL = axial length, aLT = anterior part of lens, AND = antenuclear distance, AS-OCT = anterior segment-optical coherence tomography, ASL = anterior segment length, CR = corneal radius, FLACS = femtosecond laser-assisted cataract surgery, hWTW = horizontal white-to-white diameters, IOL = intraocular lens, LMP = lens meridian parameter, LT = lens thickness, NT = nuclear thickness, OCT = optical coherence tomography, PCI = partial coherence interferometry, pLT = posterior part of lens, WTW = white-to-white diameters.
How to cite this article: Yoo YS, Whang WJ, Kim HS, Joo CK, Yoon G. Preoperative biometric measurements with anterior segment optical coherence tomography and prediction of postoperative intraocular lens position. Medicine. 2019;98:50(e18026).
This study was funded by Research to Prevent Blindness (RPB), Rochester, NY.
The authors have no conflicts of interest to disclose.
References
- [1].Lansingh VC, Carter MJ, Martens M. Global cost-effectiveness of cataract surgery. Ophthalmology 2007;114:1670–8. [DOI] [PubMed] [Google Scholar]
- [2].Nguyen P, Chopra V. Applications of optical coherence tomography in cataract surgery. Curr Opin Ophthalmol 2013;24:47–52. [DOI] [PubMed] [Google Scholar]
- [3].Kohnen T, Thomala MC, Cichocki M, et al. Internal anterior chamber diameter using optical coherence tomography compared with white-to-white distances using automated measurements. J Cataract Refract Surg 2006;32:1809–13. [DOI] [PubMed] [Google Scholar]
- [4].Piñero DP, Plaza Puche AB, Alió JL. Corneal diameter measurements by corneal topography and angle-to-angle measurements by optical coherence tomography: evaluation of equivalence. J Cataract Refract Surg 2008;34:126–31. [DOI] [PubMed] [Google Scholar]
- [5].Piñero DP, Plaza AB, Alió JL. Anterior segment biometry with 2 imaging technologies: very-high-frequency ultrasound scanning versus optical coherence tomography. J Cataract Refract Surg 2008;34:95–102. [DOI] [PubMed] [Google Scholar]
- [6].Shen P, Ding X, Congdon NG, et al. Comparison of anterior ocular biometry between optical low-coherence reflectometry and anterior segment optical coherence tomography in an adult Chinese population. J Cataract Refract Surg 2012;38:966–70. [DOI] [PubMed] [Google Scholar]
- [7].François J, Goes F. Ultrasonographic study of 100 emmetropic eyes. Ophthalmologica 1977;175:321–7. [DOI] [PubMed] [Google Scholar]
- [8].Jivrajka R, Shammas MC, Boenzi T, et al. Variability of axial length, anterior chamber depth, and lens thickness in the cataractous eye. J Cataract Refract Surg 2008;34:289–94. [DOI] [PubMed] [Google Scholar]
- [9].Leung CK, Palmiero PM, Weinreb RN, et al. Comparisons of anterior segment biometry between Chinese and Caucasians using anterior segment optical coherence tomography. Br J Ophthalmol 2010;94:1184–9. [DOI] [PubMed] [Google Scholar]
- [10].Hoffmann PC, Hütz WW. Analysis of biometry and prevalence data for corneal astigmatism in 23,239 eyes. J Cataract Refract Surg 2010;36:1479–85. [DOI] [PubMed] [Google Scholar]
- [11].Park SH, Park KH, Kim JM, et al. Relation between axial length and ocular parameters. Ophthalmologica 2010;224:188–93. [DOI] [PubMed] [Google Scholar]
- [12].O’Donnell C, Hartwig A, Radhakrishnan H. Correlations between refractive error and biometric parameters in human eyes using the LenStar 900. Cont Lens Anterior Eye 2011;34:26–31. [DOI] [PubMed] [Google Scholar]
- [13].Jonas JB, Iribarren R, Nangia V, et al. Lens position and age: the Central India Eye and Medical Study. Invest Ophthalmol Vis Sci 2015;56:5309–14. [DOI] [PubMed] [Google Scholar]
- [14].Cooke DL, Cooke TL. Comparison of 9 intraocular lens power calculation formulas. J Cataract Refract Surg 2016;42:1157–64. [DOI] [PubMed] [Google Scholar]
- [15].Olsen T, Hoffmann P. C constant: new concept for ray tracing-assisted intraocular lens power calculation. J Cataract Refract Surg 2014;40:764–73. [DOI] [PubMed] [Google Scholar]
- [16].Shammas HJ, Shammas MC. Improving the preoperative prediction of the anterior pseudophakic distance for intraocular lens power calculation. J Cataract Refract Surg 2015;41:2379–86. [DOI] [PubMed] [Google Scholar]
- [17].Goto S, Maeda N, Koh S, et al. Prediction of postoperative intraocular lens position with angle-to-angle depth using anterior segment optical coherence tomography. Ophthalmology 2016;123:2474–80. [DOI] [PubMed] [Google Scholar]
- [18].Warrier S, Wu HM, Newland HS, et al. Ocular biometry and determinants of refractive error in rural Myanmar: the Meiktila Eye Study. Br J Ophthalmol 2008;92:1591–4. [DOI] [PubMed] [Google Scholar]
- [19].Wong TY, Foster PJ, Ng TP, et al. Variations in ocular biometry in an adult Chinese population in Singapore: the Tanjong Pagar Survey. Invest Ophthalmol Vis Sci 2001;42:73–80. [PubMed] [Google Scholar]
- [20].Shufelt C, Fraser-Bell S, Ying-Lai M, et al. Refractive error, ocular biometry, and lens opalescence in an adult population: the Los Angeles Latino Eye Study. Invest Ophthalmol Vis Sci 2005;46:4450–60. [DOI] [PubMed] [Google Scholar]
- [21].Shammas HJ, Shammas MC. Measuring the cataractous lens. J Cataract Refract Surg 2015;41:1875–9. [DOI] [PubMed] [Google Scholar]
- [22].Koretz JE, Strenk SA, Strenk LM, et al. Scheimpflug and high-resolution magnetic resonance imaging of the anterior segment: a comparative study. J Opt Soc Am A Opt Image Sci Vis 2004;21:346–54. [DOI] [PubMed] [Google Scholar]
- [23].Dubbelman M, van der Heijde GL, Weeber HA. The thickness of the aging human lens obtained from corrected Scheimpflug images. Optom Vis Sci 2001;78:411–6. [DOI] [PubMed] [Google Scholar]
- [24].Meng W, Butterworth J, Malecaze F, et al. Axial length of myopia: a review of current research. Ophthalmologica 2011;225:127–34. [DOI] [PubMed] [Google Scholar]
- [25].Cui Y, Meng Q, Guo H, et al. Biometry and corneal astigmatism in cataract surgery candidates from Southern China. J Cataract Refract Surg 2014;40:1661–9. [DOI] [PubMed] [Google Scholar]
- [26].Dolgin E. The myopia boom. Nature 2015;519:276–8. [DOI] [PubMed] [Google Scholar]
- [27].Iribarren R, Fuentes Bonthoux F, Pfortner T, et al. Corneal power is correlated with anterior chamber diameter. Invest Ophthalmol Vis Sci 2012;53:3788–91. [DOI] [PubMed] [Google Scholar]
- [28].Olsen T, Arnarsson A, Sasaki H, et al. On the ocular refractive components: the Reykjavik Eye Study. Acta Ophthalmol Scand 2007;85:361–6. [DOI] [PubMed] [Google Scholar]
- [29].Stenstrom S. Investigation of the variation and the correlation of the optical elements of human eyes. Am J Optom Arch Am Acad Optom 1948;25:496–504. [DOI] [PubMed] [Google Scholar]
- [30].Benjamin B, Davey JB, Sheridan M, et al. Emmetropia and its aberrations; a study in the correlation of the optical components of the eye. Spec Rep Ser Med Res Counc (G B) 1957;11:1–69. [PubMed] [Google Scholar]
- [31].Erb-Eigner K, Hirnschall N, Hackl C, et al. Predicting lens diameter: ocular biometry with high-resolution MRI. Invest Ophthalmol Vis Sci 2015;56:6847–54. [DOI] [PubMed] [Google Scholar]
- [32].Tang M, Wang L, Koch DD, et al. Intraocular lens power calculation after previous myopic laser vision correction based on corneal power measured by Fourier-domain optical coherence tomography. J Cataract Refract Surg 2012;38:589–94. [DOI] [PMC free article] [PubMed] [Google Scholar]
- [33].Plat J, Hoa D, Mura F, et al. Clinical and biometric determinants of actual lens position after cataract surgery. J Cataract Refract Surg 2017;43:195–200. [DOI] [PubMed] [Google Scholar]
- [34].Norrby S, Bergman R, Hirnschall N, et al. Prediction of the true IOL position. Br J Ophthalmol 2017;101:1440–6. [DOI] [PubMed] [Google Scholar]
- [35].Haigis W, Lege B, Miller N, et al. Comparison of immersion ultrasound biometry and partial coherence interferometry for intraocular lens calculation according to Haigis. Graefes Arch Clin Exp Ophthalmol 2000;238:765–73. [DOI] [PubMed] [Google Scholar]
- [36].Wickremasinghe S, Foster PJ, Uranchimeg D, et al. Ocular biometry and refraction in Mongolian adults. Invest Ophthalmol Vis Sci 2004;45:776–83. [DOI] [PubMed] [Google Scholar]


