

Abstract
A crucial component of nonalcoholic fatty liver disease (NAFLD) pathogenesis is lipid stress, which may contribute to hepatic inflammation and activation of innate immunity in the liver. However, little is known regarding how dietary lipids, including fat and cholesterol, may facilitate innate immune activation in vivo. We hypothesized that dietary fat and cholesterol drive NAFLD progression to steatohepatitis and hepatic fibrosis by altering the transcription and phenotype of hepatic macrophages. This hypothesis was tested by using RNA-sequencing methods to characterize and analyze sort-purified hepatic macrophage populations that were isolated from mice fed diets with varying amounts of fat and cholesterol. The addition of cholesterol to a high-fat diet triggered hepatic pathology reminiscent of advanced nonalcoholic steatohepatitis (NASH) in humans characterized by signs of cholesterol dysregulation, generation of oxidized low-density lipoprotein, increased recruitment of hepatic macrophages, and significant fibrosis. RNA-sequencing analyses of hepatic macrophages in this model revealed that dietary cholesterol induced a tissue repair and regeneration phenotype in Kupffer cells (KCs) and recruited infiltrating macrophages to a greater degree than fat. Furthermore, comparison of diseased KCs and infiltrating macrophages revealed that these two macrophage subsets are transcriptionally diverse. Finally, direct stimulation of murine and human macrophages with oxidized low-density lipoprotein recapitulated some of the transcriptional changes observed in the RNA-sequencing study. These findings indicate that fat and cholesterol synergize to alter macrophage phenotype, and they also challenge the dogma that KCs are purely proinflammatory in NASH.
Conclusion:
This comprehensive view of macrophage populations in NASH indicates mechanisms by which cholesterol contributes to NASH progression and identifies potential therapeutic targets for this common disease.
Nonalcoholic fatty liver disease (NAFLD) is a spectrum of disease pathologies that range from the most common cause of chronic hepatic simple hepatic lipid accumulation (steatosis) to disease in modern society,(1,2) and it includes inflammation (nonalcoholic steatohepatitis [NASH]), fibrosis, and cirrhosis.(3) NAFLD is predicted to be the leading indication for liver transplantation in the next few years and to eventually supplant viral hepatitis as the principal cause of hepatocellular carcinoma.(4) Despite its increasing prevalence and burden to the health care system, there are currently no Food and Drug Administration–approved NAFLD therapeutics. Thus, there is a significant need to better understand the causative mechanisms of NAFLD progression in order to design future therapeutics. The presence of hepatic inflammation in concert with steatosis (NASH) increases the risk of progression to fibrosis and cirrhosis,(5,6) and toxic lipid entities that are increased in NASH such as palmitic acid, oxidized low-density lipoprotein cholesterol (oxLDL), and free cholesterol can drive hepatic inflammation by activating innate immune pathways such as those involving Toll-like receptor 4 (TLR4), interleukin 1 beta (IL-1β), tumor necrosis factor alpha (TNFα), and nuclear factor kappa B.(3,7,8) Furthermore, the addition of cholesterol to a high-fat diet in murine models of NAFLD has been shown to cause more severe steatohepatitis and hepatic fibrosis.(9,10) Dietary cholesterol can even trigger hepatic inflammation in nonobese humans and rodents.(3,11)
By definition, NASH is an inflammatory disease, and numerous studies have implicated tissue-resident hepatic macrophages (Kupffer cells [KCs]) in its pathogenesis and progression.(12–14) Hepatic macrophages respond to diverse environmental signals and play central roles in the pathogenesis of acute and chronic liver injury, including inflammation, homeostasis, fibrosis, and resolution.(15) Macrophages have been known to respond to lipid insults by producing proinflammatory mediators which putatively drive NAFLD.(16) However, a comprehensive understanding of how macrophages transcriptionally respond to dietary lipids and how this response may impact NASH progression is lacking. Furthermore, the particular roles of self-renewing, liver-resident macrophages (KCs) that originate from embryonic myeloid progenitors(17) versus infiltrating macrophages (IMs) that originate from circulating monocytes and bone marrow progenitors(18) have not been delineated in NASH. In order to tease apart the individual and combined effects of fat and cholesterol on hepatic macrophage populations in NASH, we isolated KCs and IMs from mice in which these dietary lipids had been titrated and examined their transcriptional profiles. We also present evidence that lipids can directly stimulate the transcriptional changes observed in the present NASH model. Our results provide a comprehensive view of macrophage populations and highlight the potential roles that cellular ontogeny and microenvironment play in the macrophage phenotype.
Materials and Methods
ANIMAL models
Male C57BL6/J mice (Jackson Labs), 6–8 weeks old, were fed one of six diets with variable amounts of fat (10% or 45% of total kilocalories) and cholesterol (0.05%, 0.2%, or 2.0% of weight). Feeding periods were 12, 20, or 24 weeks. Each diet was formulated by Envigo (Teklad) and controlled for total protein and sucrose (grams per kilogram) (Supporting Table S1). All procedures were approved by the University of Colorado Institutional Animal Care and Use Committee.
LIVER CELL ISOLATION
Murine livers were perfused with Liberase, after which the liver was removed and nonparenchymal cells (NPCs) were isolated, stained with antibodies, and cell-sorted or analyzed by flow cytometry. Flow cytometry was performed using a BD FACSCanto II instrument, and data were analyzed with BD FACSDiva software (BD Biosciences). Hepatic macrophages were sorted by fluorescence-activated cell sorting (FACS) using a BD FACSAria instrument. Fluorophore-conjugated antibodies directed against the following surface antigens were used: cluster of differentiation 45 (CD45; 30-F11; BD Biosciences), MerTK (DS5MMER; eBiosciences), CD64 (X54–5/7.1; BioLegend), lymphocyte antigen 6 complex locus G (Ly6G; 1A8; BD Pharmingen), Ly6C (AL-21; BD Biosciences), CD11b (M1/70; BD Biosciences), and F4/80 (BM8; eBiosciences).
RNA SEQUENCING
Liver macrophages were pelleted and lysed with RLT Buffer (Qiagen). RNA was isolated from the lysate using RNEasy kits (Qiagen). Library preparation, sequencing, and bioinformatics analysis were performed by the Center for Genes, Environment and Health at National Jewish Hospital. Total RNA was processed for next-generation sequencing, and sequencing was performed with an Illumina HiSeq 2500 (San Diego, CA). Clontech SMARTer Ultra Low Input RNA Kits (Mountain View, CA) and Nextera XT (Illumina, San Diego, CA) kits were used for library preparation.
A complete description of the methods may be found in the Supporting Information.
Results
DIETARY CHOLESTEROL EXACERBATES NASH HISTOPATHOLOGY AND FIBROSIS IN A DOSE-DEPENDENT MANNER
Male C57BL/6 mice were fed one of six experimental diets with varying amounts of total fat and cholesterol (Supporting Table S1). The diets included a low-fat (10%) and a high-fat (45%) diet with three different levels of cholesterol (0.05%, 0.2%, and 2%). The mice were fed for at least 12 weeks, after which we measured body weight (Supporting Fig. S1), hepatic injury, inflammation, and fibrosis.
We used a semiquantitative scoring system (Supporting Table S2) to assess liver injury and inflammation that is a modified Brunt score (used in human NAFLD) and is consistent with other murine scoring systems.(19) After 12 weeks of feeding, liver sections demonstrated that mice fed the diet highest in fat and cholesterol (HF2) had the most severe pathology with regard to nearly every disease metric (Fig. 1; Supporting Table S3). Total steatosis (Fig. 1C) and total inflammation (Fig. 1D) were highest in HF2 mice and followed a synergistic trend with regard to fat and cholesterol. Total liver injury (NAFLD activity score; NAS) for HF2 mice was significantly more than that of high-fat alone (HF.05) and high-cholesterol alone (LF2; i.e., “low-fat”) mice combined (Fig. 1E), and increasing dietary cholesterol caused a dose-wise increase in NAS, total steatosis, and total inflammation in the HF groups to a greater extent than in the LF groups (Fig. 1C–E; Supporting Table S3). Consistent with these trends, serum aspartate amino-transferase and total cholesterol increased synergistically with increasing fat and cholesterol (Supporting Fig. S2). High-cholesterol feeding alone (LF2) was sufficient to cause hepatocyte injury, inflammation, and microsteatosis (Fig. 1; Supporting Table S3), while high-fat alone (HF.05) caused virtually no hepatocyte injury or inflammation.
FIG. 1.
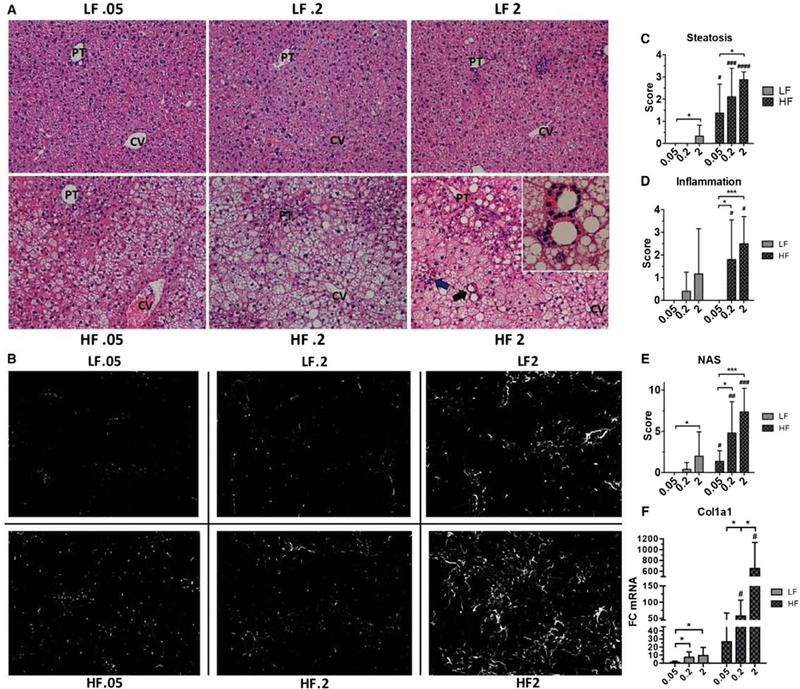
Dietary cholesterol induces a dose-dependent exacerbation of steatohepatitis and liver fibrosis. (A) Representative liver sections (×20) of each dietary group after 12 weeks of feeding. Lobular inflammatory foci (blue arrow) and lipogranulomas (black arrow, inset) were present only in HF.2 and HF2 livers and were most abundant in HF2 livers (see Supporting Table S3). (B) Representative sections of 12-week livers stained with anti-Col-1 antibody. In HF2 livers fibrosis developed in a pericellular pattern and predominated in zone 3 (see Supporting Fig. S4). (C) Semiquantitative scoring of steatosis for each dietary group. (D) Semiquantitative scoring of inflammation for each dietary group. (E) The NAS for each dietary group (see Supporting Table S3). (F) Whole-liver expression of procollagen 1 alpha 1. Rn18s was used as a reference gene for analysis. Bars represent the average ± standard deviation of each dietary group: 8–12 livers per group for semiquantitative pathology scoring (A,C-E) and 4–7 mice per group for real-time quantitative PCR analysis. Statistical significance was determined using Welch’s t test (C-E) and the Mann-Whitney U test (F). *P < 0.05, ***P < 0.001, #P < 0.05, ###P < 0.001 compared to corresponding low-fat diet. Abbreviations: Col1a1, procollagen 1 alpha 1; CV, central vein; PT, portal tract.
High-fat, high-cholesterol (HFHC) feeding also caused a dose-dependent increase in collagen deposition as measured by hepatic type 1 collagen (Col-1) staining (Fig. 1B) and whole-liver procollagen 1 alpha 1 transcription (Fig. 1F). Quantification of Col-1 staining at 12 weeks was highly variable, but at later time points there was significant collagen deposition as measured by staining with Col-1 (Supporting Fig. S3A,B) and picrosirius red, which stains fibrillar collagens such as types 1 and 3 (Supporting Fig. S3C–E). HFHC feeding (HF.2 and HF2) induced a pericellular pattern of fibrosis that arose predominantly in lobular zone 3 (Supporting Fig. S4). This pattern of fibrosis is similar to what has been observed in human NASH.(20) Thus, we conclude that dietary fat and cholesterol synergize to trigger significant liver pathology reminiscent of human disease.
DIETARY CHOLESTEROL CAUSES A DOSE-DEPENDENT INCREASE IN HEPATIC INFLAMMATION
The type of histologic inflammation induced by cholesterol was primarily lobular in nature, although there was some degree of portal inflammation in LF2 mice (Supporting Table S3). The inflammatory foci within the lobule were composed primarily of macrophages and neutrophils. Consistent with other reports,(21) a distinguishing feature between the groups with steatohepatitis (HF.2 and HF2) and those without was the presence of crown-like structures, also known as “lipogranulomas” (Fig. 1A, black arrow and inset; Supporting Table S3).
Whole-liver expression of cytokines known to play important roles in hepatic inflammation and fibrosis (Il1b, Tnf, chemokine [C-C motif] ligand 2 [Ccl2], transforming growth factor beta 1 [Tgfb1], Il33) was highest in HF2 mice, and expression of these cytokines increased in a dose-dependent manner with dietary cholesterol independent of fat content (Fig. 2A–E). These cytokines play key roles in hepatic inflammation and fibrosis, and it is widely accepted that all but IL-33 are produced by macrophages in the setting of chronic liver injury.(22) It is worth noting that only Ccl2 expression was significantly increased in the livers of mice fed with high fat alone (HF.05).
FIG. 2.
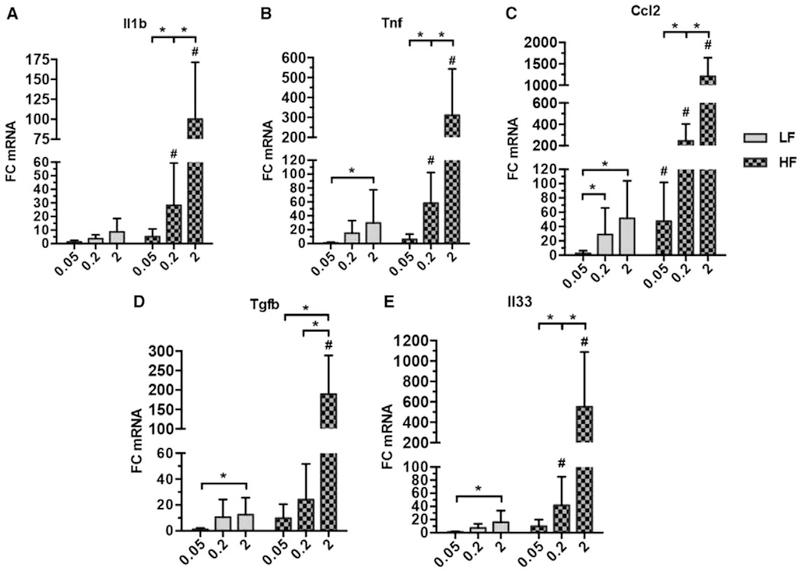
Dietary cholesterol increases hepatic expression of proinflammatory and profibrotic cytokines in a dose-dependent manner. (A-E) Whole-liver expression of inflammation and fibrosis mediators in mice fed for 12 weeks as measured by real-time quantitative PCR. Bars represent the average FC normalized to the average of LF.05 ± standard deviation of each dietary group (4–7 mice per group). Rn18s was used as a reference gene for each analysis. Statistical significance was determined using the Mann-Whitney U test. *P < 0.05, #P < 0.05 compared to corresponding low-fat diet.
We next examined how HFHC feeding affected hepatic macrophage populations by FACS populations of KCs and IMs from NPCs isolated from the livers of mice in each dietary group. KCs can be distinguished from IMs based on F4/80 and CD11b expression: KCs are F4/80hiCD11blow, whereas IMs are F4/80lowCD11bhi.(23) Because CD11b is expressed on natural killer cells and on myeloid cells and because hepatic eosinophils can express F4/80, we excluded CD45+CD11bhiLy6Ghi events (neutrophils, polymorphonuclear neutrophils) and gated on CD45+MerTK+CD64+ events (tissue macrophages) prior to sorting KCs and IMs based on F4/80, CD11b expression (Supporting Fig. S5).(24) CD64, also known as FcγRI, is expressed by monocytes and monocyte-derived myeloid cells.(25,26) MerTK is a receptor tyrosine kinase that mediates phagocytosis of apoptotic cells.(27) Together, MerTK and CD64 are reliable markers of mature tissue macrophages.(28)
In both HF and LF mice, dietary cholesterol induced a dose-dependent increase in the fraction of hepatic macrophages that were IMs (Fig. 3A,B). The same trend was observed when comparing the total number of sorted IMs per liver (Supporting Fig. S6A), demonstrating that increasing dietary cholesterol leads to a greater recruitment of IMs. Furthermore, the effect of dietary cholesterol on macrophage recruitment was much stronger than that of fat. In contrast, the total number of KCs per liver remained relatively constant (Fig. 3A,C; Supporting Fig. S6B), suggesting that dietary cholesterol had little effect on the frequencies of KCs.
FIG. 3.
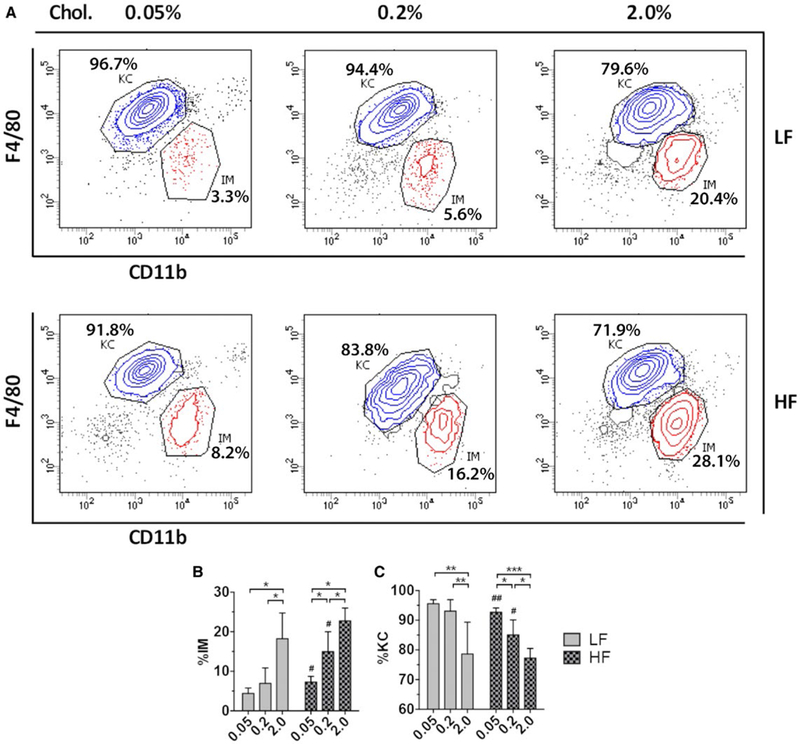
High-chole sterol feeding triggers hepatic influx of BMDMs. (A) Representative KC and IM flow plots of FACS-sorted hepatic NPCs for each dietary group. All plots are gated on CD45+Ly6Glow/−CD64+MerTK+ cells (hepatic macrophages; see Supporting Fig. S5). Percentages of KCs and IMs are shown for each plot (i.e., KC/total hepatic macrophages, IM/total hepatic macrophages). (B) Quantification of IMs as a percentage of total hepatic macrophages for each dietary group. (C) Quantification of KCs as a percentage of total hepatic macrophages for each dietary group. Bars represent the average ± standard deviation of each group with six to eight biological replicates per group. *P < 0.05, **P < 0.01, ***P < 0.001, #P < 0.05, ##P < 0.01 compared to corresponding low-fat diet.
DIETARY FAT AND CHOLESTEROL CAUSE A GLOBAL SHIFT IN THE KC TRANSCRIPTOME
In order to comprehensively examine the effects of dietary lipids on hepatic macrophage populations, we used RNA-sequencing techniques to perform gene expression analyses on sort-purified KC and IM populations from the six diet groups (see Supporting Information and Fig. S5B–E). We first examined KCs from high-fat (HF.05), high-cholesterol (LF2), and high-fat/high-cholesterol (HF2) mice. Three pairwise analyses were performed to determine the effects of high fat (HF.05 versus LF.05), high cholesterol (LF2 versus LF.05), and high fat and cholesterol together (HF2 versus LF.05) compared to a nondiseased baseline (LF.05). This approach allowed us to compare the results from each analysis side by side.
A principal component analysis (PCA) of all KC data sets revealed that dietary fat and cholesterol individually caused global shifts in the KC transcriptome, but the greatest shift was induced when fat and cholesterol were fed together (Fig. 4C). A look at the total number of differentially expressed genes in each pairwise analysis (false discovery rate [FDR] <0.1, fold change [FC] ≥2) revealed a similar trend (Fig. 4B, table). High-fat feeding (HF.05 versus LF.05) altered expression of 646 genes (626 up-regulated), while high-cholesterol feeding (LF2 versus LF.05) altered expression of only 140 genes (107 up-regulated). However, fat and cholesterol together (HF2 versus LF.05) altered expression of 1,358 genes (1,192 up-regulated), which is nearly twice as many genes as the other two pairwise analyses combined. A similar trend was observed with regard to FC. The maximum FC induced by fat or cholesterol alone was no greater than 8-fold, but fat and cholesterol together induced FCs as high as 55-fold (Fig. 4B, table). These data demonstrate that fat and cholesterol have a significant impact on the KC transcriptome.
FIG. 4.
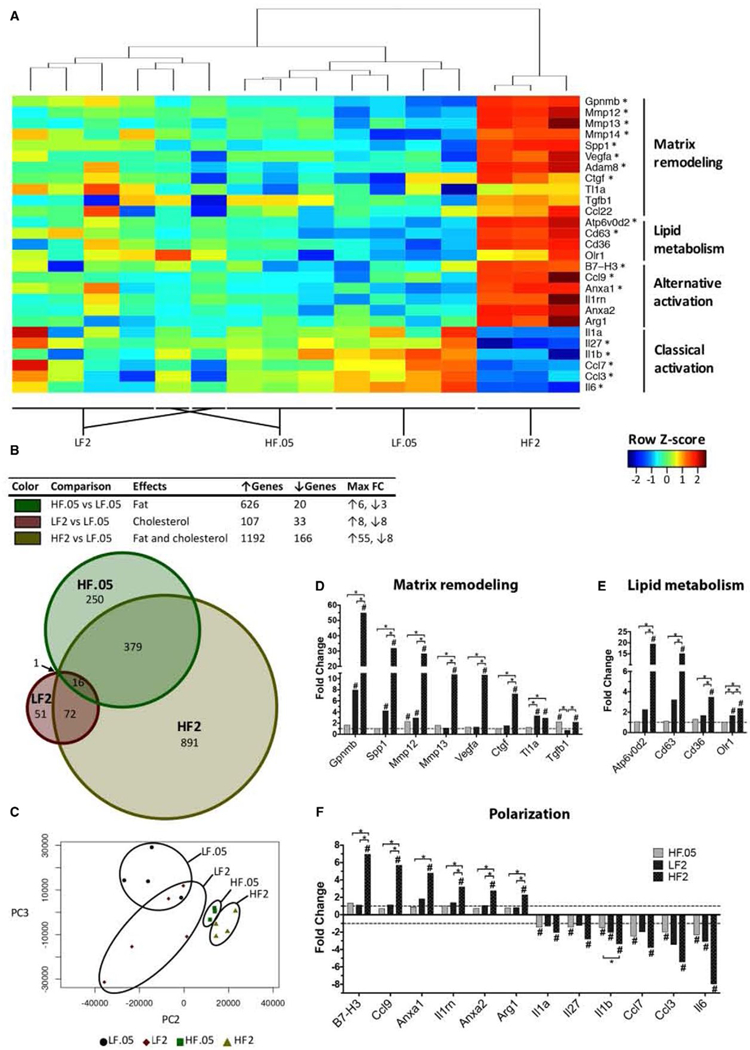
Individual and combined effects of fat and cholesterol on the KC transcriptome. (A) Heatmap of notable KC genes whose expression was significantly altered in HF2 compared to LF.05 mice. Each column represents a replicate where the transcripts per million were log-transformed, and a z score was calculated based on these values across each gene (rows). Hierarchical clustering was performed to group replicates with similar gene expression patterns (top). Labels across the bottom demonstrate the tight clustering of replicates within a diet group. Warm colors (red to yellow) reflect a higher z score and up-regulation. Cool colors (green to blue) reflect a lower z score and down-regulation. *Top 5% of genes with FDR ≤0.1. (B, top) Table showing the total number of differentially expressed, protein-coding genes (FDR ≤0.1, FC ≥2) and the maximum FCs for each pairwise analysis of the KC data sets. Each of the three comparisons provides information on the effects of dietary fat alone (green; HF.05 versus LF.05), dietary cholesterol alone (red; LF2 versus LF.05), and fat and cholesterol together (gold; HF2 versus LF.05) on gene expression in KCs. (B, bottom) Venn diagram showing the number of overlapping differentially expressed KC genes (FDR ≤0.1, FC ≥2) among the HF.05, LF2, and HF2 groups compared to LF.05 KCs. Each circle represents the total number of differentially expressed genes for a given comparison. (C) PCA plot of the KC transcriptomes of mice on LF.05, LF2, HF.05, and HF2 diets. Each point represents a biological replicate. (D-F) Bar charts of HF2 KC FC values of notable matrix remodeling (D), lipid metabolism (E), and polarization (F) genes for each dietary group relative to healthy controls (LF.05 KCs). Bars represent the calculated FC of each group (three to five replicates per group; two to four mice per replicate) (*FDR ≤0.1, #FDR ≤0.1 compared to LF.05 KCs). Abbreviations: Anxa½, annexins A1/A2; Argl, arginase-1; Atp6v0d2, adenosine triphosphatase H+ transporting v0 subunit d2; Ctgf, connective tissue growth factor; Il1rn, IL-1 receptor antagonist; Olr1, oxLDL receptor 1; PC, principal component.
Further analysis revealed that there were many genes (891) that were induced only when fat and cholesterol were both present (Fig. 4B, Venn diagram). Perhaps more surprisingly, there were 250 genes that were only affected by fat and 51 genes that were only affected by cholesterol. These data demonstrate that KC genes differentially respond to dietary lipids and suggest that the mechanisms by which fat and cholesterol affect KCs are distinct.
FAT AND CHOLESTEROL HAVE A SYNERGISTIC EFFECT ON KEY FUNCTIONAL AND PHENOTYPIC KC GENES
To better understand the functional implications of dietary lipids on KCs, we focused our analysis on genes known to be associated with remodeling of extracellular matrix (ECM), lipid metabolism, and macrophage polarization. We discovered that fat and cholesterol had a synergistic effect on expression of a number of key genes involved in these functions (Fig. 4A,D–F). Close hierarchical clustering of biological replicates within each diet group demonstrates the reproducibility of the expression changes (Fig. 4A).
HFHC feeding caused strong induction of matrix remodeling and lipid metabolism genes (Fig. 4D,E). Of the top 15 up-regulated genes in HF2 KCs, over half were associated with matrix remodeling (glycol-protein [transmembrane] nmb [Gpnmb], secreted phosphoprotein 1 [Spp1], matrix metalloproteinase 12 [Mmp12], Mmp13, vascular endothelial growth factor a [Vegfa], and a disintegrin and metallopeptidase 8) or lipid metabolism (adenosine triphosphatase H+ transporting v0 subunit d2, CD63; Supporting Table S4B). Gpnmb (55-fold) was the top up-regulated gene, and Spp1 (32-fold) was the second most up-regulated. Furthermore, there were distinct patterns of expression among the group of matrix remodeling genes. For instance, expression of Gpnmb and Spp1 was inducible by high cholesterol alone (LF2; Fig. 4D). Although high fat alone (HF.05) did not induce expression of these two genes, the addition of fat to a high-cholesterol diet amplified their expression greatly. On the other hand, Tgfb1 responded only to dietary fat, while TNF-like ligand 1a responded only to dietary cholesterol.
Surprisingly, a number of proinflammatory cytokines typically produced by classically activated macrophages (i.e., Il6, Il1b, Il1a, Ccl3, Ccl7, Il27) were among the most highly down-regulated genes when comparing the LF.05 and HF2 data sets (Fig. 4A,F; Supporting Table S4A). However, high-fat feeding (HF.05) was sufficient to inhibit transcription of these KC genes, while high-cholesterol feeding (LF2 diet) suppressed transcription of Il6, Il1b, and Ccl3. Thus, dietary fat and cholesterol can individually suppress type 1 cytokine transcription in murine KCs.
In an attempt to identify upstream mediators that may be driving the transcriptional changes that we observed in HF2 KCs, we performed an upstream regulator analysis with Ingenuity Pathway Analysis (IPA) software (Qiagen). This software analyzes the FC values from a pairwise analysis and predicts the activity of upstream regulators of transcription based on the pattern of gene expression in that data set. There was a total of six upstream cytokine regulators that were predicted to be active, and four of them were type 2 cytokines (Fig. 5A). The other two were Wnt family member 3A, a hepatoregenerative growth factor,(29) and SPP1, also known as osteopontin (OPN),(30) a profibrotic protein in the liver (Fig. 5A). There was a total of three upstream cytokines that were predicted to be inhibited (CCL2, Tumor necrosis factor-related apoptosis-inducing ligand [TRAIL], and interferon gamma [IFNγ]), and these are all known proinflammatory mediators (Fig. 5A). Further pathway analysis (Fig. 5B) revealed that these activated type 2 cytokines (IL-4, IL-13, IL-5, and granulocyte-macrophage colony-stimulating factor) are known to control expression of a number of the most highly up-regulated and down-regulated matrix remodeling, lipid metabolism, and polarization markers identified by the HF2 versus LF.05 analysis (see Fig. 4). Thus, the upstream data suggest that type 2 cytokines were driving the phenotype of KCs isolated from HF2 mice.
FIG. 5.
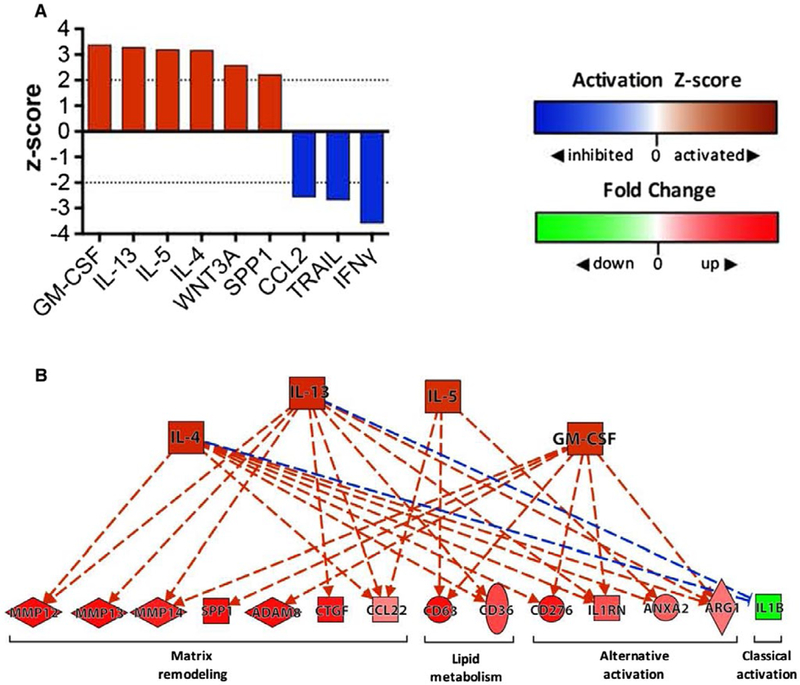
Upstream analysis ofHF2 KCs suggests signaling by type 2 cytokines. (A) Bar chart depicting the top “activated” and “inhibited” upstream cytokine regulators identified by IPA (Qiagen) when HF2 and LF.05 KC data sets were compared. An activation z score ≥2 indicates that the regulator is activated, while a z score ≤−2 indicates that the regulator is inhibited. IPA predicted that only six upstream cytokine regulators were activated (GM-CSF, IL-13, IL-5, IL-4, WNT3A, SPP1) and only 3 were inhibited (IFNγ, TRAIL, CCL2) in HF2 KCs. (B) A pathway diagram (produced with IPA) showing the upstream regulators (orange nodes) that are predicted to control expression of many of the key matrix remodeling genes, lipid metabolism genes, and phenotype markers (red/green nodes) identified by RNA-sequencing gene expression analysis (see Fig. 4) (solid line = direct interaction, dashed line = indirect interaction; orange line = leads to activation; blue line = leads to inhibition). Abbreviations: ADAM8, ADAM metallopeptidase domain 8; ANXA2, annexin A2; ARG1, arginase-1; Ctgf, connective tissue growth factor; GM-CSF, granulocyte-macrophage colony-stimulating factor; Il1rn, IL-1 receptor antagonist; TRAIL, TNF-related apoptosis-inducing ligand; WNT3A, Wnt family member 3A.
KCS AND IMS IN DISEASED LIVERS HAVE DISTINCT MORPHOLOGIES AND TRANSCRIPTIONAL PROFILES
In order to characterize the differential effects of HFHC feeding on KCs versus IMs, sort-purified macrophage populations were subjected to transmission electron microscopy. Compared to controls (LF.05), KCs from HF2 mice had the appearance of “foam cells,” where lipid processing is impaired and lipid droplets accumulate rather than being transferred into the cytoplasm (Fig. 6A,B).(31) Interestingly, the localization of lipid droplets was also different between KCs and IMs. The ultrastructure(32) of lipid bodies (LBs) was clearly different within KCs and IMs, suggesting differential handling of lipids by these two hepatic macrophage populations. The KCs demonstrated multiple small, electron-dense LBs, whereas the IMs demonstrated a large LB with an electron-lucent center (Fig. 6C).
FIG. 6.
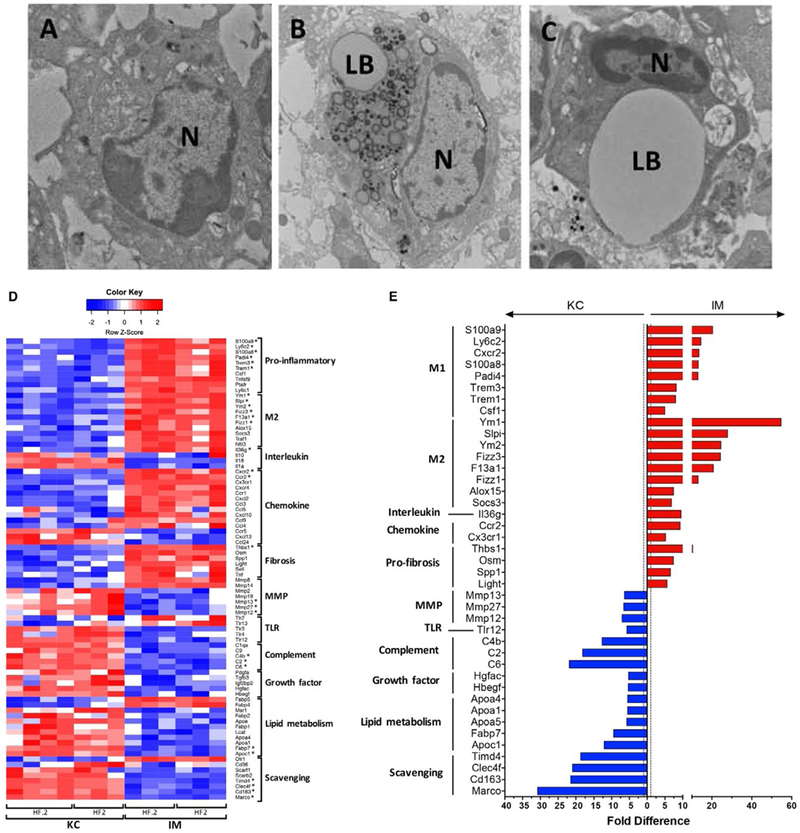
Diseased KCs and IMs differ in morphology and expression of key functional and phenotypic genes. (A-C) Transmission electron micrographs of FACS-sorted KCs and IMs isolated from murine livers. Left to right: LF.05 KCs (A), HF2 KCs (B), and HF2 IMs (C). (D) Heatmap of notable genes involved in inflammation, tissue repair, and other immune functions that are significantly enriched (FDR ≤0.1) in HF2 and HF.2 KCs or IMs. Each column represents a biological replicate where the transcripts per million were log-transformed, and a z score was calculated based on log (transcripts per million) values across each row (i.e., each gene). Red represents a positive z score and enrichment of expression relative to the mean expression across a row. Blue represents a negative z score. *Top 5% of up-regulated or down-regulated genes. (E) Bar chart of genes in the top 10% of differentially expressed genes (FDR ≤0.1) when comparing HF2 KCs and IMs. Bars represent the fold difference in expression. Blue bars (left) indicate enrichment in KCs, while red bars (right) indicate enrichment in IMs. Alternative activation markers were some of the top genes enriched in IMs. Scavenging receptors and complement factors were some of the top genes enriched in KCs. Abbreviations: N, nucleus; LB, lipid body.
To test the hypothesis that KCs and IMs isolated from diseased livers have distinct phenotypes, the transcriptional profiles of diseased KCs and IMs (HF2 and HF.2) were compared (Fig. 6D,E). PCA revealed that the transcriptomes of these two liver macrophage subsets are quite distinct, and pairwise analysis of HF2 KCs and IMs identified over 3,000 differentially expressed genes (FDR <0.1), which was approximately 25% of all tested, protein-coding genes (Supporting Fig. S7). Furthermore, the differences in expression of certain genes were remarkable. Some genes were expressed as much as 31-fold higher in KCs, while others were expressed as much as 55-fold higher in IMs (Supporting Fig. S7B). Although not shown, the trend was similar when HF.2 KCs and IMs were compared. These data demonstrate that diseased KCs and IMs have distinct transcriptional profiles. Pairwise analysis of HF.2 and HF2 IMs yielded no differentially expressed genes, as reflected by the tight grouping of HF2 and HF.2 IM replicates in the PCA plot (Supporting Fig. S7A).
Diseased KCs (HF2 and HF.2) were enriched for scavenger receptor, lipid metabolism, growth factor, MMP, and complement factor genes (Fig. 6D). On the other hand, IMs were enriched for proinflammatory genes, M2 markers, chemokines, and profibrotic mediators. Among the top 25 genes enriched in KCs were scavenger receptors (Marco, CD163, C-type lectin domain family 4 member f [Clec4f], T-cell immunoglobulin and mucin domain containing 4), complement components (C6, C2, C4b), and one lipid metabolism (apolipoprotein C1) gene (Fig. 6E; Supporting Table S5). Strong enrichment of Clec4f, a known KC marker,(33) is an excellent internal verification that the sorted cells were indeed KCs. Interestingly, the top genes enriched in IMs were dominated by those associated with alternative activation; five of the top 10 differentially expressed genes were chitinase-like protein 3 (Chil3; Ym1), Chil4 (Ym2), resistin-like gamma precursor (Fizz3), secretory leukocyte peptidase inhibitor, and coagulation factor XIII A chain (Supporting Table S5).
The top activated canonical pathway (IPA) enriched in KCs was the liver X receptor alpha (LXR-α) pathway (Fig. 7A). LXR is a member of the nuclear receptor superfamily that binds oxysterols in concert with retinoid X receptors (RXRs) and activates transcription of reverse cholesterol transport genes in a cell.(34) Figure 7B shows the genes enriched in KCs (green nodes) that are known to be controlled by these receptors. In contrast, “lipopolysaccharide (LPS)/IL-1-mediated inhibition of RXR function” was one of the top activated canonical pathways within IMs (Fig. 7C).
FIG. 7.
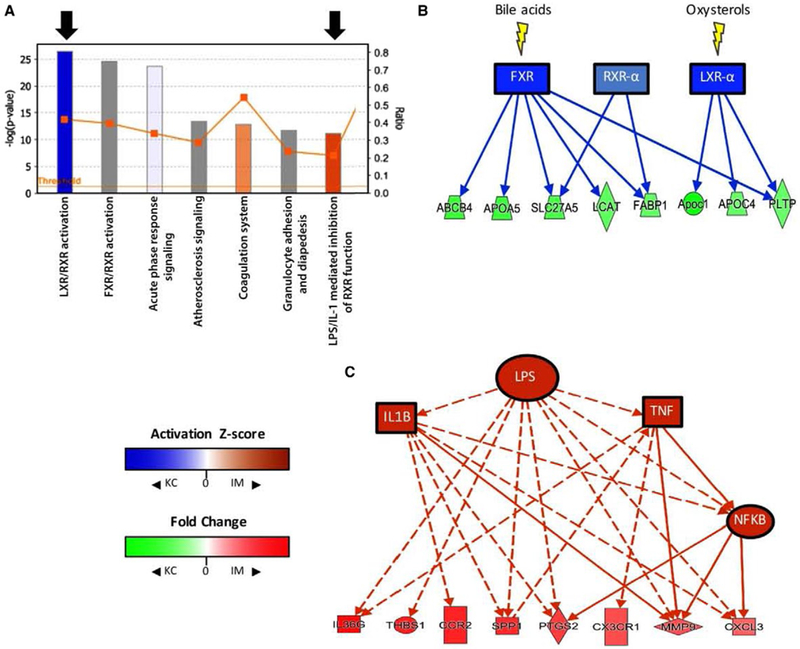
Upstream analysis of diseased KCs and IMs suggests differences in activity of regulators of inflammation. (A) A bar and line graph generated by IPA depicts the top canonical pathways that were activated in KCs (blue) or IMs (orange). Bars represent significance (−log [P value], left y-axis), and the line graph represents the fraction of known genes in a given pathway that are differentially expressed in the data set (right y-axis). The top seven most significant pathways are shown (descending order left to right). Black arrows identify two notable activated pathways in KCs and IMs. (B) A pathway diagram (IPA) showing predicted activation of bile acid and oxysterol receptors (blue nodes; z score ≤−2) in diseased KCs compared to IMs. Green nodes are genes that are enriched in KCs and known to be controlled by these receptors. (C) A pathway diagram (IPA) showing proinflammatory upstream regulators (orange nodes) that are predicted to be active (z score ≥2) in IMs and may be responsible for expression of a number of IM-enriched genes (red nodes) (solid line = direct interaction; dashed line = indirect interaction; orange line = leads to activation; blue line = leads to inhibition). Abbreviations: ABCB4, adenosine triphosphate binding cassette subfamily B member 4; APOA5, apolipoprotein A5; CXCL3, C-X-C motif chemokine ligand 3; CX3CR1, C-X3-C motif chemokine receptor 1; FABP1, fatty acid binding protein 1; FXR, farnesoid X receptor; IL36G, IL-36 gamma; LCAT, lecithin-cholesterol acyltransferase; NFκB, nuclear factor kappa B; PTGS2, prostaglandin-endoperoxide synthase 2; SLC27A5, solute carrier family 27 member 5; THBS1, thrombospondin 1.
LINKS BETWEEN LIPID ACCUMULATION IN HEPATIC MACROPHAGES AND NASH PROGRESSION
A considerable body of literature has implicated cholesterol, particularly oxLDL, in the development of NASH.(3,8,35) In the HFHC model, serum oxLDL increased in correlation with dietary cholesterol and NASH severity in the high-fat groups (Fig. 8A) but not in the low-fat groups. Interestingly, hepatic accumulation of ceroid, a lipid substance that can accumulate in macrophages upon oxLDL uptake,(36) was statistically greater in mice fed the HFHC diet. Ceroid largely accumulated around the elongated nuclei of hepatic macrophages (Supporting Fig. S8).
FIG. 8.
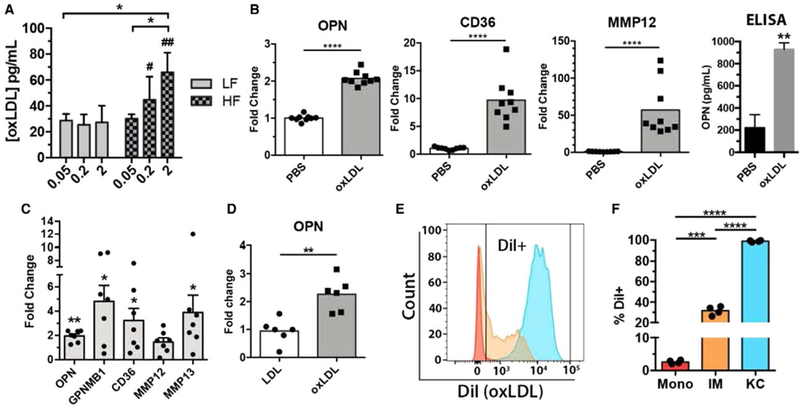
Associations between cholesterol dysregulation and macrophages in NASH progression. (A) Average serum oxLDL concentration (ELISA) in 12-week mice fed each of the six dietary groups. Serum oxLDL increased in correlation with dietary cholesterol. Dietary cholesterol had no effect on oxLDL levels in lean mice (LF). Bars represent the average ± standard deviation of each dietary group with four to seven mice per group. (B) Relative expression of OPN (Spp1), CD36, and MMP12 transcript and OPN protein concentration (ELISA, far right) in murine BMDMs after 48 hours. oxLDL stimulation compared to PBS controls. Each bar represents the mean, and each point represents one replicate from a total of three mice. Bars represent the average ± standard deviation. (C) Relative gene expression in human macrophage colony-stimulating factor matured macrophages after 24-hour stimulation with oxLDL compared to PBS controls. *P < 0.05, **P < 0.01 Mann-Whitney test. (D) Relative OPN expression by hepatic macrophages (MerTK+) isolated after 48 hours. oxLDL stimulation in vivo. Mice were injected at 0 and 24 hours. with DiI-labeled oxLDL, after which hepatic macrophages were bead-sorted and total RNA was isolated for gene expression analysis. (E) Representative histogram of DiI (phycoerythrin) fluorescence by KCs, IMs, and hepatic monocytes flow-sorted from mice with NAFLD after 48 hours. DiI-oxLDL stimulation in vivo. (F) Quantification of percent DiI-positive cells in KC, IM, and hepatic monocyte populations. Bars represent the mean, and each point represents one mouse. *P < 0.05, **P < 0.01, ***P < 0.001, ****P < 0.0001, #P < 0.05, ##P < 0.01 compared to corresponding low-fat diet. Abbreviations: ELISA, enzyme-linked immunosorbent assay; PBS, phosphate-buffered saline.
We hypothesized that oxLDL could directly induce the transcriptional changes observed in HFHC mice. Consistent with this hypothesis, murine bone marrow-derived macrophages (BMDMs) treated with oxLDL up-regulated transcription of two of the top three up-regulated genes in HF2 mice (Fig. 8B; Supporting Table S4) as well as CD36 (Fig. 4E)—a scavenger receptor that mediates oxLDL uptake and has been implicated in NASH pathophysiology.(31) Release of OPN (Spp1) protein by BMDMs was also increased in response to oxLDL stimulation (Fig. 8B). Human macrophages derived from CD14+ monocytes also demonstrated up-regulation of these genes following stimulation with oxLDL (Fig. 8C). To analyze the in vivo effects of oxLDL on hepatic macrophages, chow-fed mice were injected with oxLDL and hepatic macrophages were harvested, followed by gene expression analysis. At 48 hours, hepatic macrophages from oxLDL-injected mice had up-regulated Spp1 (OPN) transcription compared to LDL controls (Fig. 8D). Furthermore, OPN knockout mice fed the HFHC diet had decreased hepatic inflammation and fibrosis despite having no change in steatosis (Supporting Fig. S9), further suggesting an important role for OPN in NASH pathogenesis.
To further assess functional differences between KCs and IMs, mice with NAFLD were injected with 1,1’-dioctadecyl-3,3,3’,3’-tetramethylindocarbocyanine perchlorate (DiI)–labeled oxLDL, and uptake of oxLDL was measured by flow cytometry. DiI is a fluorescent and lipophilic dye commonly used to label lipoproteins. Virtually all KCs were positive for oxLDL uptake (>98%), while only 32% of IMs and 3% of monocytes were positive (Fig. 8E,F). These data, in concert with the morphological differences observed in HF2 mice (Fig. 6A–C), suggest that KCs and IMs are not only transcriptionally diverse but also functionally distinct with respect to lipid processing.
Discussion
The results of this study provide insight into the phenotype and function of hepatic macrophages in the setting of NASH caused by chronic lipid stress and suggest that they may acquire this phenotype by direct uptake of lipids. The hepatic pathology induced by this dietary model was reminiscent of advanced human NASH, and monocyte-derived human macrophages stimulated with oxLDL responded similarly to murine macrophages (Fig. 8). Although proinflammatory macrophages have been ascribed key roles in NASH pathogenesis, this study supports the notion that type 2 cytokines drive disease progression and suggests that hepatic macrophages play a key role in this process. The findings of the IPA upstream analysis are particularly intriguing because the software makes predictions based on global gene expression changes rather than a few key genes. Predicted activation of type 2 cytokine signaling (IL-4, IL-13, IL-15) and inhibition of type 1 cytokine signaling (IFNγ; Fig. 5) indicate that if KCs are indeed involved in NASH progression, then they are doing so through type 2 mechanisms. This analysis was also supported by changes in transcription of key polarization genes in HF2 KCs—namely down-regulation of Il6 and Il1b and up-regulation of arginase-1 (Fig. 4F).
Our results challenge the traditional view that KCs in NASH are predominantly proinflammatory and contribute to disease by production of cytokines such as IL-1α/β, TNFα, IL-6, and CCL2(22) and recruitment of proinflammatory monocytes. In the present model, diseased KCs (HF2) did not up-regulate any of these factors. Instead, they demonstrated increased expression of the reparative genes such as CCL22, arginase-1, peroxisome proliferator-activated receptor gamma, C-X3-C motif chemokine receptor 1, TGFB, platelet-derived growth factor, and VEGF (Supporting Table S4). Indeed, the transcriptional profile of HFHC KCs is consistent with “tissue repair” macrophages as described by Wynn and Vannella in 2016,(37) and the predicted activation of type 2 cytokine signaling in these cells supports this conclusion. One possible explanation for this discrepancy is that many studies where the role of KCs in NASH was evaluated have used short-term models.(12–14) In contrast, the current HFHC model is a chronic one manifesting fibrosis. We propose that as NASH progresses, the KC phenotype shifts from proinflammatory to proregeneration and repair and that this shift drives hepatic fibrosis (Supporting Fig. S10). Consistent with this conclusion, a recent compelling study indicated that type 2 inflammation is associated with NASH-related fibrosis.(38)
In our studies, both matrix deposition (e.g., Tgfb1, connective tissue growth factor, Spp1) and degradation genes (e.g., Mmp12, Mmp13) were highly up-regulated in HF2 KCs (Supporting Table S4). Thus, it is likely that subsets within the KC population counteract one another, creating homeostasis with regard to the production and degradation of ECM. Furthermore, NASH may progress as the balance between profibrotic and fibrinolytic macrophage subsets tips toward a profibrotic phenotype. Furthermore, it is now recognized that IMs are “newly differentiated” macrophages that can further differentiate in situ into mature tissue macrophages.(22) Thus, it is possible that BMDMs contribute to the KC niche in diseased mice and may cause some of the transcriptional changes that we observed in the KC population. Moreover, recruited bone-marrow monocytes likely differentiate into an array of IM phenotypes that perform diverse functions prior to terminal differentiation.
In the current study, the top two KC genes up-regulated by HFHC feeding (HF2) were Gpnmb (55-fold) and Spp1 (32-fold). These two genes appear to have opposing roles in liver fibrosis, which further supports the theory that KC subsets within the hepatic macrophage pool shift in response to chronic injury. Gpnmb is induced in macrophages by LPS and negatively regulates the production of IL-6 and IL-12.(39) Its overexpression ameliorates hepatic fibrosis and reduces oxidative stress in obese mice. In contrast, the Spp1 gene encodes OPN, whose secreted isoform has been found to be chemotactic to immune cells(40) and may represent a conserved profibrogenic response to chronic liver injury. Accordingly, in a CCL4-mediated liver injury model, OPN and high mobility group box-1 were released by injured hepatocytes and were able to trigger hepatic stellate cell activation.(30) OPN−/− mice fed a methionine and choline–deficient diet exhibited less hepatic fibrosis than wild-type littermates,(41) and we found that SPP1 knockout virtually eliminated hepatic inflammation (without affecting steatosis) in mice fed the HF2 diet (Supporting Fig. S9).
To characterize the response of IMs to increasing dietary cholesterol, we compared the transcriptional profiles of IMs isolated from HF2 and HF.2 mice (Supporting Fig. S5D). Surprisingly, although increasing dietary cholesterol had a dose-dependent effect on many KC genes, there was no discernable effect on IM gene expression in the setting of NASH. However, comparison of diseased KCs and IMs demonstrated that the transcriptomes of these two macrophage populations are quite distinct (Fig. 6D; Supporting Fig. S6), and differences in upstream signaling (Fig. 7), cellular morphology (Fig. 6A–C), and oxLDL uptake (Fig. 8) suggest that these two populations are functionally different as well.
KCs and IMs also were also enriched for different canonical pathways by IPA. Bile acids and their synthetic intermediates, oxysterols, are known to have anti-inflammatory effects on macrophages.(42) Oxysterols bind to LXR/RXR and activate reverse cholesterol transport, which removes cholesterol from nonhepatic cells and promotes excretion. This pathway putatively protects against cardiovascular disease by facilitating the removal of cholesterol from macrophage foam cells within atherosclerotic plaques.(34) We found activation of bile acid and oxysterol pathways in KCs compared to IMs. In contrast, we found relative activation of proinflammatory signaling pathways in IMs (Fig. 7). These findings further suggest that KCs and IMs are functionally distinct and that there may be inherent differences between KCs and IMs (e.g., epigenetic imprinting) that may manifest as differential sensitivity to LPS, bile acids, and oxysterols.
We demonstrated that IMs isolated from HF2 mice at 24 weeks show higher proportions of Ly6Chigh and lower proportions of Ly6Clow macrophages than control mice (Supporting Fig. S11). Ly6C is a cell surface protein frequently used to identify functionally distinct murine monocyte subsets.(43) Ly6Chigh monocytes have a proinflammatory phenotype, whereas Ly6Clow monocytes have been ascribed homeostatic and patrolling functions.(44) Both Ly6Chigh intrahepatic macrophages, which have been shown to drive fibrogenesis,(45) and Ly6Clow macrophages, which are critical for regression of hepatic fibrosis, are derived from recruited Ly6Chigh inflammatory monocytes.(43) These results underscore the ability of monocytes and macrophages to change phenotype in situ depending on local cues.
We recognize that chronic exposure to high cholesterol intake may impact other cell types, such as neutrophils, that we did not directly characterize. Recent atherosclerosis data demonstrated that cholesterol crystals can trigger neutrophils to release neutrophil extracellular traps that subsequently prime macrophages for IL-1β production.(46) We also acknowledge that the cholesterol concentration used in the HF2 diet (2% weight) is supraphysiological. However, our analysis of mice fed the diet with lower, albeit elevated, cholesterol (HF.2, 0.2% weight) provided similar results. Thus, we argue that the high-fat and cholesterol model is more physiologically relevant than methionine/choline-deficient diets. Indeed, most “Western diets” used to induce NASH are composed of 0.2% cholesterol. Although beyond the scope of this study, we also acknowledge that lipid overload may alter hepatic macrophages indirectly through gut microbiome-related metabolites or changes in hepatocyte-derived stress signals.(47)
The results of this study have led us to question the specific mechanisms by which fat and cholesterol cooperatively exacerbate NASH and alter hepatic macrophage phenotype. One such mechanism may be increased generation of oxLDL. Peripheral adipose tissue in obese mice contributes to oxidative stress by producing reactive oxygen species and other molecules that can oxidize LDL. oxLDL is an endogenous ligand that functions as a TLR agonist(48) and is known to trigger production of cytokines by macrophages.(16) The fact that dietary cholesterol induced a dose-dependent increase in serum oxLDL only in the setting of obesity (Fig. 8A; Supporting Fig. S1) suggests that adipose tissue may be an important factor in the generation of oxLDL. Furthermore, our in vitro macrophage data demonstrating induction of known mediators of hepatic steatosis and fibrosis in response to oxLDL (Fig. 8) suggest that the synergistic exacerbation of NASH characteristic of fat and cholesterol may be partially related to increased generation of oxLDL. Finally, hepatic ceroid accumulation near hepatic macrophages in HF2 livers (Supporting Fig. S8) indicates that they may take up significant quantities of oxLDL in the HFHC model and implicates these cells as an interface between lipid stress and sterile inflammation.
Collectively, these findings provide a picture of hepatic cholesterol dysregulation in HFHC-fed mice and further support the conclusion that cholesterol sensing by hepatic macrophages plays a key role in NASH progression and fibrosis. Future rational therapeutic strategies for NASH may involve exploiting these properties.
Supplementary Material
Abbreviations:
- BMDM
bone marrow-derived macrophage
- CCL2
chemokine (C-C motif) ligand 2
- CD
duster of differentiation
- Col-1
type 1 collagen
- DiI
1,1’-dioctadecyl-3,3,3’3’-tetramethylindocarbocyanine perchlorate
- FACS
fluorescence-activated cell sorting
- FC
fold change
- FDR
false discovery rate
- Gpnmb
glycoprotein (transmembrane) nmb
- HF
high-fat diet group (e.g., HF2)
- HFHC
high-fat, high-cholesterol
- IFN
interferon gamma
- IL
interleukin
- IM
infiltrating macrophage
- IPA
Ingenuity Pathway Analysis
- KC
Kupffer cell
- LF
high-cholesterol alone (i.e., low-fat) diet group
- LPS
lipopolysaccharide
- LXR
liver X receptor
- Ly6G
lymphocyte antigen 6 complex locus G
- MMP
matrix metalloproteinase
- NAFLD
nonalcoholic fatty liver disease
- NAS
NAFLD activity score
- NASH
nonalcoholic steatohepatitis
- NPC
nonparenchymal cell
- OPN
osteopontin
- oxLDL
oxidized low-density lipoprotein
- PCA
principal component analysis
- RXR
retinoid X receptor
- Spp1
secreted phosphoprotein 1
- Tgfb1
transforming growth factor beta 1
- TLR
Toll-like receptor
- TNFα
tumor necrosis factor alpha
Footnotes
Supporting Information
Additional Supporting Information may be found at onlinelibrary.wiley.com/doi/10.1002/hep.30401/suppinfo.
Potential conflict of interest: Nothing to report.
REFERENCES
- 1 ).Wree A, Broderick L, Canbay A, Hoffman HM, Feldstein AE. From NAFLD to NASH to cirrhosis—new insights into disease mechanisms. Nat Rev Gastroenterol Hepatol 2013;10:627–636. [DOI] [PubMed] [Google Scholar]
- 2 ).Schattenberg JM, Schuppan D. Nonalcoholic steatohepatitis: the therapeutic challenge of a global epidemic. Curr Opin Lipidol 2011;22:479–488. [DOI] [PubMed] [Google Scholar]
- 3 ).Walenbergh SM, Koek GH, Bieghs V, Shiri-Sverdlov R. Non-alcoholic steatohepatitis: the role of oxidized low-density lipo-proteins. J Hepatol 2013;58:801–810. [DOI] [PubMed] [Google Scholar]
- 4 ).Loomba R, Sanyal AJ. The global NAFLD epidemic. Nat Rev Gastroenterol Hepatol 2013;10:686–690. [DOI] [PubMed] [Google Scholar]
- 5 ).Williams CD, Stengel J, Asike MI, Torres DM, Shaw J, Contreras M, et al. Prevalence of nonalcoholic fatty liver disease and nonalcoholic steatohepatitis among a largely middle-aged population utilizing ultrasound and liver biopsy: a prospective study. Gastroenterology 2011;140:124–131. [DOI] [PubMed] [Google Scholar]
- 6 ).Matteoni CA, Younossi ZM, Gramlich T, Boparai N, Liu YC, McCullough AJ. Nonalcoholic fatty liver disease: a spectrum of clinical and pathological severity. Gastroenterology 1999;116:1413–1419. [DOI] [PubMed] [Google Scholar]
- 7 ).Meli R, Mattace Raso G, Calignano A. Role of innate immune response in non-alcoholic fatty liver disease: metabolic complications and therapeutic tools. Front Immunol 2014;5:177. [DOI] [PMC free article] [PubMed] [Google Scholar]
- 8 ).Bieghs V, Walenbergh SM, Hendrikx T, van Gorp PJ, Verheyen F, Olde Damink SW, et al. Trapping of oxidized LDL in lysosomes of Kupffer cells is a trigger for hepatic inflammation. Liver Int 2013;33:1056–1061. [DOI] [PMC free article] [PubMed] [Google Scholar]
- 9 ).Savard C, Tartaglione EV, Kuver R, Haigh WG, Farrell GC, Subramanian S, et al. Synergistic interaction of dietary cholesterol and dietary fat in inducing experimental steatohepatitis. HEPATOLOGY 2013;57:81–92. [DOI] [PMC free article] [PubMed] [Google Scholar]
- 10 ).Musso G, Gambino R, Cassader M. Cholesterol metabolism and the pathogenesis of non-alcoholic steatohepatitis. Prog Lipid Res 2013;52:175–191. [DOI] [PubMed] [Google Scholar]
- 11 ).Yasutake K, Nakamuta M, Shima Y, Ohyama A, Masuda K, Haruta N, et al. Nutritional investigation of non-obese patients with non-alcoholic fatty liver disease: the significance of dietary cholesterol. Scand J Gastroenterol 2009;44:471–477. [DOI] [PubMed] [Google Scholar]
- 12 ).Rivera CA, Adegboyega P, van Rooijen N, Tagalicud A, Allman M, Wallace M. Toll-like receptor-4 signaling and Kupffer cells play pivotal roles in the pathogenesis of non-alcoholic steatohepatitis. J Hepatol 2007;47:571–579. [DOI] [PMC free article] [PubMed] [Google Scholar]
- 13 ).Reid DT, Reyes JL, McDonald BA, Vo T, Reimer RA, Eksteen B. Kupffer cells undergo fundamental changes during the development of experimental NASH and are critical in initiating liver damage and inflammation. PLoS One 2016;11:e0159524. [DOI] [PMC free article] [PubMed] [Google Scholar]
- 14 ).Miura K, Yang L, van Rooijen N, Ohnishi H, Seki E. Hepatic recruitment of macrophages promotes nonalcoholic steatohepatitis through CCR2. Am J Physiol Gastrointest Liver Physiol 2012;302:G1310–G1321. [DOI] [PMC free article] [PubMed] [Google Scholar]
- 15 ).Li H, You H, Fan X, Jia J. Hepatic macrophages in liver fibrosis: pathogenesis and potential therapeutic targets. BMJ Open Gastroenterol 2016;3:e000079. [DOI] [PMC free article] [PubMed] [Google Scholar]
- 16 ).Sheedy FJ, Grebe A, Rayner KJ, Kalantari P, Ramkhelawon B, Carpenter SB, et al. CD36 coordinates NLRP3 inflammasome activation by facilitating intracellular nucleation from soluble to particulate ligands in sterile inflammation. Nat Immunol 2013;14:812–820. [DOI] [PMC free article] [PubMed] [Google Scholar]
- 17 ).Gomez Perdiguero E, Klapproth K, Schulz C, Busch K, Azzoni E, Crozet L, et al. Tissue-resident macrophages originate from yolk-sac-derived erythro-myeloid progenitors. Nature 2015;518:547–551. [DOI] [PMC free article] [PubMed] [Google Scholar]
- 18 ).Devisscher L, Verhelst X, Colle I, Van Vlierberghe H, Geerts A. The role of macrophages in obesity-driven chronic liver disease. J Leukoc Biol 2016;99:693–698. [DOI] [PubMed] [Google Scholar]
- 19 ).Lanaspa MA, Ishimoto T, Li N, Cicerchi C, Orlicky DJ, Ruzycki P, et al. Endogenous fructose production and metabolism in the liver contributes to the development of metabolic syndrome. Nat Commun 2013;4:2434. [DOI] [PMC free article] [PubMed] [Google Scholar]
- 20 ).Brunt EM, Tiniakos DG. Histopathology of nonalcoholic fatty liver disease. World J Gastroenterol 2010;16:5286–5296. [DOI] [PMC free article] [PubMed] [Google Scholar]
- 21 ).Ioannou GN, Haigh WG, Thorning D, Savard C. Hepatic cholesterol crystals and crown-like structures distinguish NASH from simple steatosis. J Lipid Res 2013;54:1326–1334. [DOI] [PMC free article] [PubMed] [Google Scholar]
- 22 ).Krenkel O, Tacke F. Liver macrophages in tissue homeostasis and disease. Nat Rev Immunol 2017;17:306–321. [DOI] [PubMed] [Google Scholar]
- 23 ).Ju C, Tacke F. Hepatic macrophages in homeostasis and liver diseases: from pathogenesis to novel therapeutic strategies. Cell Mol Immunol 2016;13:316–327. [DOI] [PMC free article] [PubMed] [Google Scholar]
- 24 ).Gibbings SL, Thomas SM, Atif SM, McCubbrey AL, Desch AN, Danhorn T, et al. Three unique interstitial macrophages in the murine lung at steady state. Am J Respir Cell Mol Biol 2017;57:66–76. [DOI] [PMC free article] [PubMed] [Google Scholar]
- 25 ).Langlet C, Tamoutounour S, Henri S, Luche H, Ardouin L, Gregoire C, et al. CD64 expression distinguishes monocyte-derived and conventional dendritic cells and reveals their distinct role during intramuscular immunization. J Immunol 2012;188:1751–1760. [DOI] [PubMed] [Google Scholar]
- 26 ).Tamoutounour S, Henri S, Lelouard H, de Bovis B, de Haar C, van der Woude CJ, et al. CD64 distinguishes macrophages from dendritic cells in the gut and reveals the Th1-inducing role of mesenteric lymph node macrophages during colitis. Eur J Immunol 2012;42:3150–3166. [DOI] [PubMed] [Google Scholar]
- 27 ).Scott RS, McMahon EJ, Pop SM, Reap EA, Caricchio R, Cohen PL, et al. Phagocytosis and clearance of apoptotic cells is mediated by MER. Nature 2001;411:207–211. [DOI] [PubMed] [Google Scholar]
- 28 ).Gautier EL, Shay T, Miller J, Greter M, Jakubzick C, Ivanov S, et al. Gene-expression profiles and transcriptional regulatory pathways that underlie the identity and diversity of mouse tissue macrophages. Nat Immunol 2012;13:1118–1128. [DOI] [PMC free article] [PubMed] [Google Scholar]
- 29 ).Boulter L, Govaere O, Bird TG, Radulescu S, Ramachandran P, Pellicoro A, et al. Macrophage-derived Wnt opposes Notch signaling to specify hepatic progenitor cell fate in chronic liver disease. Nat Med 2012;18:572–579. [DOI] [PMC free article] [PubMed] [Google Scholar]
- 30 ).Arriazu E, Ge X, Leung TM, Magdaleno F, Lopategi A, Lu Y, et al. Signalling via the osteopontin and high mobility group box-1 axis drives the fibrogenic response to liver injury. Gut 2017;66:1123–1137. [DOI] [PMC free article] [PubMed] [Google Scholar]
- 31 ).Bieghs V, Verheyen F, van Gorp PJ, Hendrikx T, Wouters K, Lutjohann D, et al. Internalization of modified lipids by CD36 and SR-A leads to hepatic inflammation and lysosomal cholesterol storage in Kupffer cells. PLoS One 2012;7:e34378. [DOI] [PMC free article] [PubMed] [Google Scholar]
- 32 ).Melo RC, Fabrino DL, Dias FF, Parreira GG. Lipid bodies: structural markers of inflammatory macrophages in innate immunity. Inflamm Res 2006;55:342–348. [DOI] [PubMed] [Google Scholar]
- 33 ).Scott CL, Zheng F, De Baetselier P, Martens L, Saeys Y, De Prijck S, et al. Bone marrow-derived monocytes give rise to self-renewing and fully differentiated Kupffer cells. Nat Commun 2016;7:10321. [DOI] [PMC free article] [PubMed] [Google Scholar]
- 34 ).Ma Z, Deng C, Hu W, Zhou J, Fan C, Di S, et al. Liver X receptors and their agonists: targeting for cholesterol homeostasis and cardiovascular diseases. Curr Issues Mol Biol 2017;22:41–64. [DOI] [PubMed] [Google Scholar]
- 35 ).Tomita K, Teratani T, Suzuki T, Shimizu M, Sato H, Narimatsu K, et al. Free cholesterol accumulation in hepatic stellate cells: mechanism of liver fibrosis aggravation in nonalcoholic steatohepatitis in mice. HEPATOLOGY 2014;59:154–169. [DOI] [PubMed] [Google Scholar]
- 36 ).Sparrow CP, Parthasarathy S, Steinberg D. A macrophage receptor that recognizes oxidized low density lipoprotein but not acetylated low density lipoprotein. J Biol Chem 1989;264:2599–2604. [PubMed] [Google Scholar]
- 37 ).Wynn TA, Vannella KM. Macrophages in tissue repair, regeneration, and fibrosis. Immunity 2016;44:450–462. [DOI] [PMC free article] [PubMed] [Google Scholar]
- 38 ).Hart KM, Fabre T, Sciurba JC, Gieseck RL 3rd, Borthwick LA, Vannella KM, et al. Type 2 immunity is protective in metabolic disease but exacerbates NAFLD collaboratively with TGF-beta. Sci Transl Med 2017;9 10.1126/scitranslmed.aal3694. [DOI] [PubMed] [Google Scholar]
- 39 ).Ripoll VM, Irvine KM, Ravasi T, Sweet MJ, Hume DA. Gpnmb is induced in macrophages by IFN-gamma and lipopolysaccharide and acts as a feedback regulator of proinflammatory responses. J Immunol 2007;178:6557–6566. [DOI] [PubMed] [Google Scholar]
- 40 ).Lund SA, Giachelli CM, Scatena M. The role of osteopontin in inflammatory processes. J Cell Commun Signal 2009;3:311–322. [DOI] [PMC free article] [PubMed] [Google Scholar]
- 41 ).Syn WK, Choi SS, Liaskou E, Karaca GF, Agboola KM, Oo YH, et al. Osteopontin is induced by hedgehog pathway activation and promotes fibrosis progression in nonalcoholic steatohepatitis. HEPATOLOGY 2011;53:106–115. [DOI] [PMC free article] [PubMed] [Google Scholar]
- 42 ).Tall AR, Yvan-Charvet L. Cholesterol, inflammation and innate immunity. Nat Rev Immunol 2015;15:104–116. [DOI] [PMC free article] [PubMed] [Google Scholar]
- 43 ).Ramachandran P, Pellicoro A, Vernon MA, Boulter L, Aucott RL, Ali A, et al. Differential Ly-6C expression identifies the recruited macrophage phenotype, which orchestrates the regression of murine liver fibrosis. Proc Natl Acad Sci USA 2012;109:E3186–E3195. [DOI] [PMC free article] [PubMed] [Google Scholar]
- 44 ).Quintar AA, Hedrick CC, Ley K. Monocyte phenotypes: when local education counts. J Exp Med 2015;212:432. [DOI] [PMC free article] [PubMed] [Google Scholar]
- 45 ).Karlmark KR, Weiskirchen R, Zimmermann HW, Gassler N, Ginhoux F, Weber C, et al. Hepatic recruitment of the inflammatory Gr1+ monocyte subset upon liver injury promotes hepatic fibrosis. HEPATOLOGY 2009;50:261–274. [DOI] [PubMed] [Google Scholar]
- 46 ).Warnatsch A, Ioannou M, Wang Q, Papayannopoulos V. Inflammation. Neutrophil extracellular traps license macrophages for cytokine production in atherosclerosis. Science 2015;349:316–320. [DOI] [PMC free article] [PubMed] [Google Scholar]
- 47 ).Caussy C, Hsu C, Lo MT, Liu A, Bettencourt R, Ajmera VH, et al. Novel link between gut-microbiome derived metabolite and shared gene-effects with hepatic steatosis and fibrosis in NAFLD. HEPATOLOGY 2018; 10.1002/hep.29892. [Epub ahead of print] [DOI] [PMC free article] [PubMed] [Google Scholar]
- 48 ).Stewart CR, Stuart LM, Wilkinson K, van Gils JM, Deng J, Halle A, et al. CD36 ligands promote sterile inflammation through assembly of a Toll-like receptor 4 and 6 heterodimer. Nat Immunol 2010;11:155–161. [DOI] [PMC free article] [PubMed] [Google Scholar]
Associated Data
This section collects any data citations, data availability statements, or supplementary materials included in this article.