
FIG. 6.
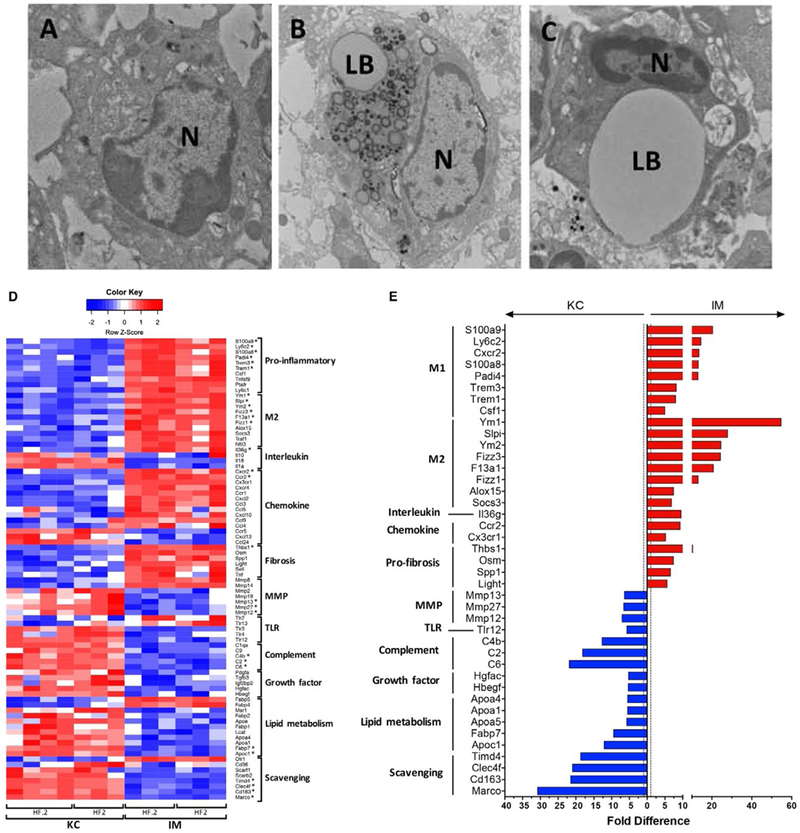
Diseased KCs and IMs differ in morphology and expression of key functional and phenotypic genes. (A-C) Transmission electron micrographs of FACS-sorted KCs and IMs isolated from murine livers. Left to right: LF.05 KCs (A), HF2 KCs (B), and HF2 IMs (C). (D) Heatmap of notable genes involved in inflammation, tissue repair, and other immune functions that are significantly enriched (FDR ≤0.1) in HF2 and HF.2 KCs or IMs. Each column represents a biological replicate where the transcripts per million were log-transformed, and a z score was calculated based on log (transcripts per million) values across each row (i.e., each gene). Red represents a positive z score and enrichment of expression relative to the mean expression across a row. Blue represents a negative z score. *Top 5% of up-regulated or down-regulated genes. (E) Bar chart of genes in the top 10% of differentially expressed genes (FDR ≤0.1) when comparing HF2 KCs and IMs. Bars represent the fold difference in expression. Blue bars (left) indicate enrichment in KCs, while red bars (right) indicate enrichment in IMs. Alternative activation markers were some of the top genes enriched in IMs. Scavenging receptors and complement factors were some of the top genes enriched in KCs. Abbreviations: N, nucleus; LB, lipid body.