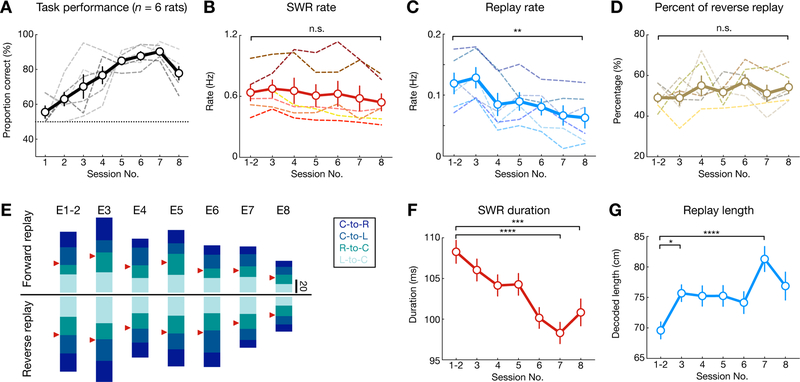
Figure 4. Dynamics of SWR replay properties over the course of learning.
(A) Task performance, showing proportion correct of outbound trajectories per session for all animals (n = 6 rats).
(B) Total SWR rate did not change across sessions (p = 0.28 and F(6, 30) = 1.44, repeated measures ANOVA).
(C) Replay rate decreased over learning (p = 0.0005, F(6, 30) = 14.21, repeated measures ANOVA; **p = 0.003, Tukey’s post hoc tests).
(D) Percentage of reverse replay out of all replay events did not change across sessions (p = 0.12, F(6, 30) = 2.370, repeated measures ANOVA).
(E) Number of forward and reverse replay events of the 4 behavioral trajectory types across 8 learning sessions (E1–8). The trajectory types are color-coded with red arrowheads indicating 50% level for forward and reverse replay.
(F) Duration of SWR events decreased over learning (p < 1e-4, Kruskal-Wallis test; ***p = 0.0003, ****p < 0.0001, Dunn’s post hoc tests).
(G) Decoded length of replay trajectories increased over learning (p = 0.0004, Kruskal-Wallis test; ***p = 0.0001, *p = 0.039, Dunn’s post hoc tests).
Dashed lines in (A-D): individual animals. Solid line and error bars: mean and SEMs.
See also Figure S5.

