

Abstract
Background
Short tandem repeats (STRs) serve as genetic markers in forensic scenes due to their high polymorphism in eukaryotic genomes. A variety of STRs profiling systems have been developed for species including human, dog, cat, cattle, etc. Maintaining these systems simultaneously can be costly. These mammals share many high similar regions along their genomes. With the availability of the massive amount of the whole genomics data of these species, it is possible to develop a unified STR profiling system. In this study, our objective is to propose and develop a unified set of STR loci that could be simultaneously applied to multiple species.
Result
To find a unified STR set, we collected the whole genome sequence data of the concerned species and mapped them to the human genome reference. Then we extracted the STR loci across the species. From these loci, we proposed an algorithm which selected a subset of loci by incorporating the optimized combined power of discrimination. Our results show that the unified set of loci have high combined power of discrimination, >1−10−9, for both individual species and the mixed population, as well as the random-match probability, <10−7 for all the involved species, indicating that the identified set of STR loci could be applied to multiple species.
Conclusions
We identified a set of STR loci which shared by multiple species. It implies that a unified STR profiling system is possible for these species under the forensic scenes. The system can be applied to the individual identification or paternal test of each of the ten common species which are Sus scrofa (pig), Bos taurus (cattle), Capra hircus (goat), Equus caballus (horse), Canis lupus familiaris (dog), Felis catus (cat), Ovis aries (sheep), Oryctolagus cuniculus (rabbit), and Bos grunniens (yak), and Homo sapiens (human). Our loci selection algorithm employed a greedy approach. The algorithm can generate the loci under different forensic parameters and for a specific combination of species.
Keywords: Short tandem repeats, Whole genome sequencing, Individual identification
Background
Short tandem repeats (STRs), also referred to as simple sequence repeats or microsatellite loci, are DNA fragments made up of tandem repeats of 1–6 bp sequence units [1, 2]. STRs are ubiquitous in eukaryotic genomes and are highly polymorphic. They are widely adopted as genetic markers in human [3] and non-human forensic applications such as individual identification [4, 5], paternity testing [6, 7], and kinship analysis [8]. DNA profiles can provide valuable clues and evidence during investigations of crime scenes. In previous studies, a number of STR profiling systems have been developed for various animal species including dog [9, 10], cat [11, 12], horse [13, 14], etc. However, to maintain one DNA profiling system for each species can be tedious and costly. In previous studies [15–17], panels of cross-species STR markers were developed among some closely related species. Given the fact that mammalian animals share large proportions of DNA sequences [18, 19], it is sensible to expect that a unified set of DNA markers may exist and the set can be identified from the shared sequence regions, and hence, a unified STR profiling system is possible for multiple species.
In this study, we aim to develop a unified set of STR loci for ten species, namely Sus scrofa (pig), Bos taurus (cattle), Capra hircus (goat), Equus caballus (horse), Canis lupus familiaris (dog), Felis catus (cat), Ovis aries (sheep), Oryctolagus cuniculus (rabbit), and Bos grunniens (yak), and Homo sapiens (human). Our objective is to identify a minimum set of STR loci satisfying the forensic parameters from the shared genome regions among these species. Previous studies have utlized high-volume data from the shotgun sequencing technology in forensic analysis to search the new forensic DNA markers [20, 21]. While our targeted species belong to different families or different orders, and it is challenging and time-consuming to obtain the their shotgun data. Therefore, we proposed a model based on whole genome sequence data.
In this work, we downloaded the whole genome sequence (WGS) data of the multiple species. Then, we mapped the sequencing data with BWA [22] to the human genome (hg19) [23]. After that, we obtained the possible STR sites in each species using the software package lobSTR [24]. Last, we performed a greedy locus selection algorithm with the incorporation of the forensic parameters to identify a unified set.
The obtained locus set contains much less loci than the total number of the loci from individual species. The acquired loci set also demonstrates a lower random-match probability and a higher combined power of discrimination when applied to each species. Our statistical results show that the ultimately unified loci set has the combined power of discrimination (CPD, )) larger than 1−10−9 for each involved species, and random-match probability at most 6.30×10⁻⁸. Furthermore, our proposed loci selection algorithm can also be applied to individual species. The experimental results showed that, in comparison with other previous report work, the proposed method is capable to generate more efficient loci for the given species. Using the and values in 13 CODIS loci as benchmarks, the proposed algorithm generated eight loci to meet the criteria with lower and , indicating that the selected loci are more sensitive for individual identification.
Methods
Datasets
We downloaded next-generation sequencing (NGS) data of the ten species from NCBI (Sus scrofa: SRP028348; Bos taurus: SRP039339; Capra hircus: SRP102144, SRP108014; Equus caballus: SRP061963, SRP067684, ERP010944, ERP011292; Canis lupus familiaris: SRP035294; Felis catus: SRP061392, SRP093-936; Ovis aries: SRP013208; Oryctolagus cuniculus: SRP053211, ERP111038; Bos grunniens: SRP059061), and data from 1000 Genome project [25] for human being. The involved species belong to different families or even different orders.
In order to obtain the candidate STR loci in the shared genomic region of involved species, we aligned WGS reads in the samples to hg19 and processed the aligned data with lobSTR. According to the outputs of lobSTR, we estimated allele frequencies as well as genotype frequencies of sites in each species, which were used to estimate forensic parameters described in the following sections.
Problem statement
In this work, we call the multiple species, which we want to search the unified STR locus set from, as an integrated pseudo species. Given the genome data of multiple species, the main purpose here is to obtain a small set of STR loci from the shared genome region among the species to achieve individual identification; that is, we want to find a set of STR loci with the cardinality minimized. In addition, these loci should satisfy the criteria specified by the forensic parameters for both an individual species and the integrated pseudo species.
Call rate
In each species, the call rate at each locus (denoted as ηℓ) is the percentage of the individuals covers the locus in the sample data. The call rate is restricted by the pre-specified threshold δη so that the selected loci could be observed in the majority of the individuals in a species.
Parameters for high distinguishing power
First, within each species, a valid locus should satisfy the constraints set by four forensic parameters: the power of discrimination (PD), the probability of matching (PM), the power of exclusion (PE), and heterozygosity (HE) [26]. The constraints set by the parameters to ensure that only loci with high distinguishing power on individuals would be considered. Denote PD, PM, PE, and HE of the locus ℓ of the species s as Dℓ,s, Mℓ,s, Eℓ,s, Hℓ,s, respectively. Let thresholds of the four parameters as δd, δm, δe, and δh, the selected loci set of each species s should satisfy
| 1 |
Moreover, since multiple species are considered here, we need to define the PD for the integrated pseudo species at each locus. At locus ℓ, denote PD for the integrated pseudo species as , then the calculation of is defined as
| 2 |
Combined power of discrimination ())
) is also a common parameter to evaluate the capability of individual identification of a locus set. Denote ) for species s as Cs. Then,
| 3 |
The cumulative product of PM refers to the combined probability of matching (CPM) and maximizing the value of ) is equivalent to minimizing the value of CPM(, denote it as ).
Also, we also define the CPD for the integrated pseudo species. Similar to the definition above, for the integrated population, ) is defined as
| 4 |
We aim to find a locus set to satisfy for each individual species as well as optimize the value of for the integrated pseudo species.
Random-match probability (RMP)
Random-match probability (RMP, ), defined as the probability that a randomly selected individual from the population other than the suspect would have the given DNA profile, is another criterion to evaluate DNA profile systems. Such constraints are imposed to statistically eliminate the fallacy that an irrelevant individual in the population is matched to the given profile [26]. Therefore, here we limit value of to be under 1/N where N refers to the number of individuals in the population on which we would like to apply our selected markers. Denote the maximum profile frequency (MPF) at each locus ℓ of species s as Fℓ,s. Then the of locus set in species s is calculated as
| 5 |
We want to find a locus set such that for each species s, ; that is, the cumulative product of is set to be no more than the reciprocal of the population size. Similarly, we can define the the maximum profile frequency and the random-match probability for the integrated pseudo species, and denote them as and , respectively.
The loci apply to both individual or the integrated pseudo species; it is necessary to restrict s for both in individual species and in the integrated pseudo species below the threshold δr, the reciprocals of the population sizes, for both a single species or the integrated pseudo species.
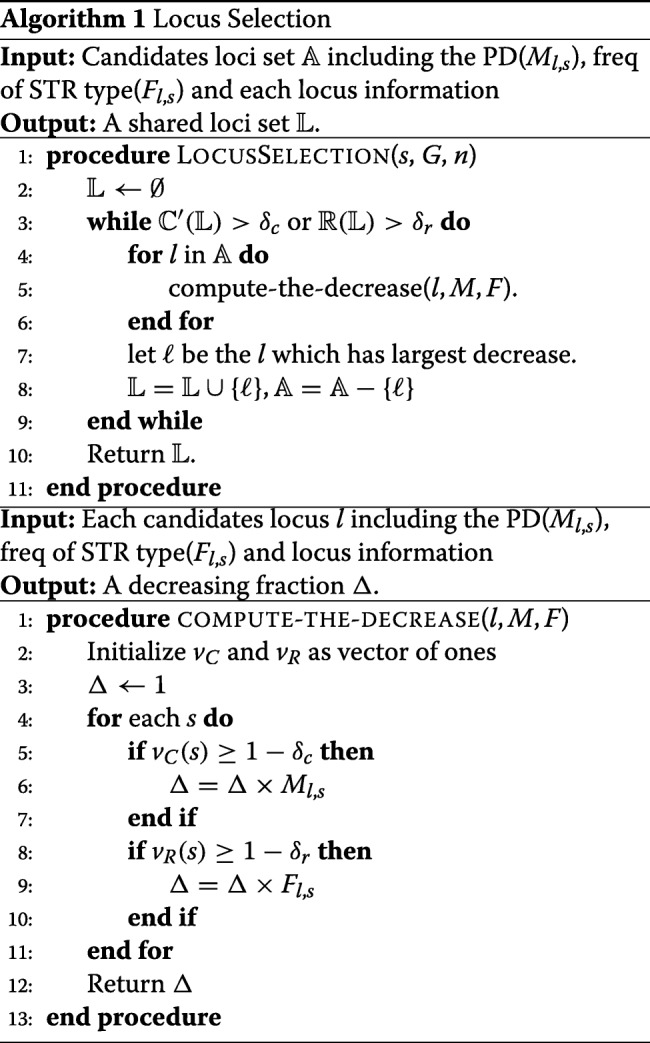
Locus selection
First, we aligned raw sequencing data to the reference of the human genome, processed the data through lobSTR workflow and obtained STR locus candidate set from in the overlapping genomic area of the involved species. We excluded loci on the sex chromosome, and mononucleotide repeats, which are inapplicable in practical situations. Using loci retrieved by lobSTR, we estimated allele frequency at each locus and used the frequencies to compute PD, PM, PE, HE, as well as maximum genotype frequency. Then we applied the thresholds specified in Eq. (1) on PD, PM, PE, HE and call rate to filter the STR loci.
The selected loci set should have the ) values no less than δc for each species, and its s are no more than δr for each species and an optimized ) for the integrated pseudo species. The can be expressed as the products of values, and can be expressed as the products of PM values.
Next, we employ a greedy algorithm to find a unified STR locus set from the filtered loci. We started from an empty set of loci. At each iteration, we incorporate the locus which reduces (denote it as ) and the most into the set. As both and are probabilities, we choose the locus which decreases their product the most. We repeat the process until the and are below the pre-specified thresholds. The algorithm is displayed as (Algorithm 1). To initialize, we create two vectors vC and vR, with initial values as 1. They will store the values of Mℓ,s) and Fℓ,s of all loci in every species. vC(s) and vR(s) are the Mℓ,s and Fℓ,s values of species s of the current identified loci. Once a species s has its (or ) reach the given thresholds, we skip the species for later iterations.
Sample size determination
According to Hale et. al [27], most of the informative alleles, alleles at a frequency of ≥0.05, could be captured by 30 samples, thus the estimated allele frequencies from 30 samples can represent the population allele frequencies. Here, we utilized the data of the Phase 3 publication of the 1000 Genomes Project, and randomly sampled different numbers of individuals from the data set. The statistical results showed that with 25 or more samples, at least 90% of alleles at each site can be detected, and that the difference between the estimated and theoretical values of PD, HE and MPF is small–less than 0.1.
Results
Performance on pseudo species consisting of 10 species
Prior to the locus selection process, we conducted experiments to examine impact of different sample sizes on the detection of alleles as well as estimation of the involved forensic parameters. We chose the data in the 1000 Genomes Project. We sampled different numbers of individuals from this population and estimated number of alleles detected at each site, as well as the forensic parameters (PD, HE, MPF) involved in individual identification. As shown in Fig. 1, with 25 or more samples, over 90% of alleles can be detected and meanwhile, the difference between the estimated and theoretical values of forensic parameters are small. Therefore, using 25–30 samples will also be able to generate sensible estimations.
Fig. 1.

Impact of sample size on allele detection and major forensic parameters (PD, HE, MPF)
After processing data through lobSTR, 119,717 loci were detected with reference to human genome of all 23 chromosome pairs. The initial distribution of call rate among STR loci is shown in Fig. 2.
Fig. 2.

The distribution of call rate
First, we filtered out loci that were observed only in single species, 7784 STR loci remains. Next, we excluded mononucleotide repeat loci as well as loci on sex chromosomes, and 4614 loci remain. After we dropped loci with call rate less than the threshold δη and filtered out loci that failed to satisfy any of the thresholds of forensic parameters (δd=0.6,δm=0.4,δe=0.3,δh=0.5), we obtained 1268 loci subjected to further processing. The distribution of PD and genotype frequency among remaining loci is shown in Figs. 2 and 3. To be noted, in Fig. 3 the y-axis refers to the joint PD defined in (2), while in Fig. 2, the y-axis represents a subtraction of the cumulative value of genotype frequency at each locus. The red lines Figs. 2 and 3 stand for our desired thresholds for these two parameters in the loci selection algorithm.
Fig. 3.
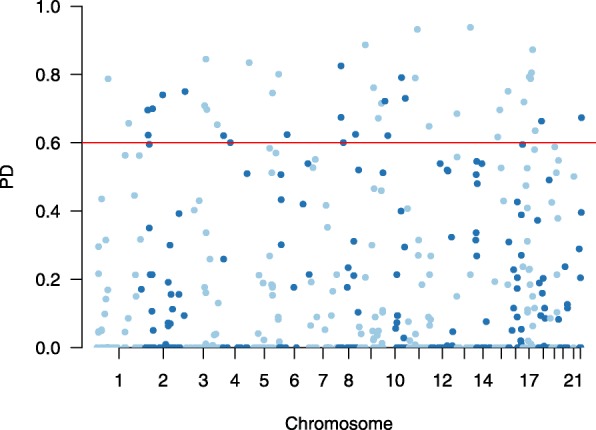
Distribution of PD of remaining loci (ηl≥0.5)
We applied the selection algorithm on STR sites of the concerned species. We set the threshold for ) at 0.9999 and at 10−7 for every individual species and generated a set with 31 loci for ten species. Table 1 shows forensic parameters of selected loci with highest PDs, and Table 2 shows assessment of selected loci on their combined power for individual identification as well as paternity testing on each species population. The generated loci set has )s higher than 1−10−9, s less than 10−7 for every concerned species, suggesting its power for distinguishing individuals randomly chosen from a related species. Also, to consider the possible use of generated loci set in paternity testing, we evaluated the combined power of exclusion (CPE) within each species population. We can observe that CPEs are higher than 0.99 for every species group.
Table 1.
Forensic parameters of selected loci
| CHR | POS | RUL | HE | PD |
|---|---|---|---|---|
| chr17 | 7787390 | 2 | 0.814716312056738 | 0.935450047622492 |
| chr14 | 57279935 | 2 | 0.827094474153298 | 0.932795344883323 |
| chr11 | 57467882 | 2 | 0.828629032258065 | 0.932229995727539 |
| chr1 | 207997377 | 2 | 0.785381285381285 | 0.923859365077692 |
| chr11 | 46142707 | 2 | 0.8 | 0.917120154272911 |
| chr16 | 4322949 | 2 | 0.782472613458529 | 0.913962030606996 |
| chr15 | 98292738 | 2 | 0.777777777777778 | 0.901665702815812 |
| chr3 | 119541091 | 2 | 0.780241935483871 | 0.900781631469727 |
| chr15 | 73889791 | 5 | 0.767195767195767 | 0.891822417742607 |
| chr2 | 39201053 | 2 | 0.747619047619048 | 0.881054955418381 |
| chr2 | 241696826 | 3 | 0.747619047619048 | 0.875768032693187 |
| chr12 | 118588317 | 5 | 0.758241758241758 | 0.873070486988594 |
| chr9 | 14086350 | 4 | 0.734042553191489 | 0.86962890625 |
| chr6 | 163992752 | 6 | 0.719774011299435 | 0.868980555555556 |
| chr5 | 124081853 | 2 | 0.733333333333333 | 0.863633976401387 |
| chr8 | 22619315 | 2 | 0.701149425287356 | 0.856881481481481 |
| chr18 | 72357594 | 2 | 0.683257918552036 | 0.856743570778334 |
| chr2 | 135703320 | 3 | 0.711693548387097 | 0.851266860961914 |
| chr2 | 36777760 | 6 | 0.68974358974359 | 0.8426265625 |
| chr17 | 49255307 | 3 | 0.727272727272727 | 0.842592592592593 |
| chr3 | 114173776 | 2 | 0.727272727272727 | 0.842592592592593 |
| chr3 | 137413014 | 2 | 0.666666666666667 | 0.821603869787472 |
| chr16 | 22092942 | 2 | 0.692307692307692 | 0.814504373177843 |
| chr3 | 114033630 | 3 | 0.674645390070922 | 0.810491491247107 |
| chr4 | 54876122 | 6 | 0.634765294711289 | 0.808673104516968 |
| chr1 | 176522684 | 2 | 0.712121212121212 | 0.805266203703704 |
| chr22 | 36140123 | 4 | 0.67032967032967 | 0.786182840483132 |
| chr1 | 27108339 | 5 | 0.62145390070922 | 0.77700524691358 |
| chr3 | 160219801 | 2 | 0.591666666666667 | 0.757476806640625 |
| chr4 | 17885278 | 2 | 0.546654861535651 | 0.68947775749674 |
| chr3 | 187439732 | 2 | 0.533333333333333 | 0.6144 |
Table 2.
Evaluation of selected loci on each species
| Species | ) | CPE | |
|---|---|---|---|
| cat | 5.0615×10⁻¹⁰ | 0.99999999999993383 | 0.99978049249880108 |
| cattle | 1.0536×10⁻⁸ | 0.99999999998633915 | 0.99794653711292580 |
| dog | 3.9239×10⁻¹⁰ | 0.99999999999975098 | 0.99970843603702098 |
| goat | 2.3005×10⁻⁸ | 0.99999999997592071 | 0.99857509526114097 |
| horse | 5.0166×10⁻⁸ | 0.99999999977198839 | 0.99625817962597518 |
| human | 3.3695×10⁻⁸ | 0.99999999999140876 | 0.99933064560113372 |
| pig | 6.2908×10⁻⁸ | 0.99999999985080279 | 0.99713785294534030 |
| rabbit | 4.4219×10⁻¹⁰ | 0.99999999999992795 | 0.99980453489094234 |
| sheep | 5.0696×10⁻¹⁰ | 0.99999999999990974 | 0.99975253609811832 |
| yak | 1.9169×10⁻⁹ | 0.99999999999823685 | 0.99931237001520157 |
In addition, our algorithm can be applied with different thresholds and on a different number of species. We applied the selection algorithm on 10 species with ) threshold ranging from 1−10−3 to 1−10−7 and threshold from 10−3 to 10−10. As shown in Table 3, at a given ) threshold, the number of loci would increase with descending threshold of ; conversely, when the threshold of is set, the number of loci may slightly increase or remain unchanged when more rigorous threshold is given. Moreover, we examined the value of that different number of loci could achieve among ten species. (Figure 4) It can be seen that to satisfy upper bounded at 10−5 in each species, at least 21 loci are required. At given ) and threshold, the number of loci generated among different number of species is shown in Fig. 5. It can be seen that when threshold is settled, the increment of species number will not result in continuously growing of loci number, indicating that our proposed algorithm is effective when more species groups are involved.
Table 3.
Number of loci selected under different thresholds of and )
| 1−10−3 | 1−10−4 | 1−10−5 | 1−10−6 | 1−10−7 | |
|---|---|---|---|---|---|
| 10−3 | 12 | 12 | 14 | 17 | 17 |
| 10−4 | 16 | 16 | 16 | 17 | 17 |
| 10−5 | 21 | 20 | 20 | 21 | 21 |
| 10−6 | 27 | 27 | 27 | 25 | 25 |
| 10−7 | 31 | 31 | 31 | 31 | 31 |
| 10−8 | 36 | 36 | 36 | 36 | 36 |
| 10−9 | 41 | 41 | 41 | 41 | 41 |
| 10−10 | 46 | 46 | 46 | 46 | 46 |
Fig. 4.

achieved by different number of loci
Fig. 5.

Number of loci generated for different number of species
Our method beats CODIS on human
The Federal Bureau of Investigation (FBI) has published thirteen core loci for the Combined DNA Index System (CODIS)[28] in 1997, which have been used as dominant DNA markers in human profiling. Here, we retrieved the thirteen loci from 320 individuals of Chinese population in 1000 Genome Project. We computed the and of CODIS based on the data. To evaluate the performance of the proposed algorithm, we used the calculated values of and as thresholds, and applied the algorithm on the same population. Eight loci were selected by our algorithm to satisfy both thresholds. The fewer number of loci suggests that our algorithm is effective in searching for loci to meet given thresholds. As shown in Table 4, the selected loci has higher and lower than the CODIS loci. To further evaluate the efficacy of the proposed algorithm in loci selection, we generated sets containing different number of loci for the same Chinese population. For each generated loci set , we simulated profiles of 10,000 individuals at each selected locus, and computed the values of . The results are shown in Fig. 6. With more loci chosen by the proposed algorithm, the value of would decrease accordingly. When a locus set with 13 loci was generated, the became much smaller than CODIS, suggesting the much lower probability of occurrence of random matching cases. Therefore, it can be concluded that the greedy strategy implemented in the proposed algorithm - to assign priority on loci with high PD and low MPF - is capable to generate a small locus set to achieve pre-specified CPD and RMP on target population.
Table 4.
Forensic parameters of selected loci and loci in CODIS
| Our | CODIS | |
|---|---|---|
| Nloci | 8 | 13 |
| 4.51×10⁻¹¹ | 8.42×10⁻¹⁰ | |
| 1.35×10⁻¹⁴ | 4.58×10⁻¹³ |
Fig. 6.

Box plot for common logarithms of RMPs on 10,000 simulated individuals with CODIS and loci selected with proposed method
To better evaluate the capability of using the selected loci in paternity test, we conducted simulations of trio paternity testing cases and for human population. We generated sets containing different number of loci - ranging from 8 to 20, where the 8-loci set was generated when the observed values of and of CODIS were used as the thresholds in our selection algorithm. We computed the combined paternity index (CPI) [29] as the evaluation metric. We simulated 1000 true trio families (where the man and woman are true biological parents of the child) as well as 1000 false trio families (where the man is a random male chosen from the population) and calculated the paternity index (PI) and CPI for families. As shown in Fig. 7, we took the logarithm of CPI values. In true trio cases, where CPIs are usually higher than 1, larger CPI indicates the corresponding loci set can provide higher paternity probabilities, and thus more reliable in practical use; while in false trio cases, where CPIs become usually lower than 1, smaller value implies the less probability of false exclusion. It can be seen that, in comparison with CODIS, the 8 loci obtained by our algorithm at same thresholds have higher CPI at true trio case and lower CPI at false trio case. Moreover, when increasing the number of loci selected by our algorithm, the normalized curves go further from the y-axis, suggesting the growing reliability of the selected loci in paternity testing. To sum up, in both terms of individual identification and paternity testing, our proposed algorithm is capable to select efficient loci to generate an optimized loci set for a given population.
Fig. 7.

Normalized probability distributions of common logarithm of CPI in trio paternity testing in human
Our method beats Kemp’s on pseudo species consisting of cattle, goat, and sheep
In the work of Kemp et al. [16], a panel of 97 microsatellite markers was developed jointly for cattle, goat, and sheep. Here we extracted samples of cattle, goat, and sheep to form a pseudo species, and applied the selection algorithm on this newly integrated population. With the threshold for ) and at 0.9999 and 10−7 respectively, 18 loci were selected for the three species. As shown in Table 5, the generated loci set has low (under 10−7), high (greater than 1−10−9) and CPE (greater than 0.996), indicating the power of selected loci in identity and paternity testing.
Table 5.
Forensic parameters of loci selected for cattle, goat, and sheep
| Species | ) | CPE | |
|---|---|---|---|
| cattle | 3.8319×10⁻⁸ | 0.999999999815 | 0.996642777607 |
| goat | 3.4890×10⁻⁸ | 0.999999999908 | 0.998089765874 |
| sheep | 4.6930×10⁻¹⁰ | 0.999999999995 | 0.999261605878 |
Conclusion
In this study, we developed an algorithm based on whole genome sequencing (WGS) data to generate a unified STR loci set for multiple species. The algorithm was designed to search for minimum number of loci to optimize the combined power of discrimination ()) for each species as well as the integrated population. For each individual species, the selected loci should have ) no less than δc (here we set δc=0.9999) to ensure their efficacy to distinguish one individual from another, and random-match probability () no greater than δr to control the fallacy that two randomly selected individuals would have same profiles at given loci.
We included 10 species in this study, namely, Sus scrofa (pig), Bos taurus (cattle), Capra hircus (goat), Equus caballus (horse), Canis lupus familiaris (dog), Felis catus (cat), Ovis aries (sheep), Oryctolagus cuniculus (rabbit), Bos grunniens (yak), and Homo sapiens. To obtained all possible STR sites at the common genome region among involved species, we mapped raw sequencing data of individual samples concerning the human genome. We implemented the proposed selection algorithm on STR sites owned by at least two species and finally generated 31 loci at (≤10−7) for all concerned species. Under this threshold, the generated loci set has )s greater than 1−10−9 and s no greater than 10−7, which collectively demonstrate its capability of individual identification in every involved species population. Furthermore, we assessed the capacity of using selected loci in paternity testing by their combined power of exclusion (CPE). The generated loci set could achieve CPEs greater than 0.99.
In addition, we evaluated our proposed algorithm by applying it on different selection thresholds and varying number of species. It turns out that the loci number may increase to satisfy more rigorous threshold, whereas with settled threshold, the number of loci would not continue to increase significantly when more species are involved. Thus it can be concluded that the algorithm proposed here can find loci that commonly have high power of discrimination in involved species and generate a loci set to satisfy the criteria of ) and with a minimized number of loci.
With the data from 1000 Genomes Project, we computed the ) and of 13 CODIS loci, used the values as thresholds in our proposed loci selection algorithm, and obtained eight loci that could satisfy the criteria. This loci set generated by our method not only have fewer number of loci, but also demonstrate higher ) and lower in the concerned population. In addition, in the respective simulated 1000 cases of true trio and false trio paternity tests, the generated 8-loci set demonstrated higher reliability than CODIS in terms of the combined paternity index (CPI). Therefore, it can be concluded that, given either a specific or several separated population(s), the proposed algorithm has the capability to generate an optimized loci set that can be utilized in both identity testing and paternity testing with minimized number of loci. We also compared the study of Kemp et al. [16] on cattle, goat and sheep. Kemp identified 97 loci for individual identification across the three species. Through our algorithm optimized, 18 loci are satisfactory for this task. To summarize, our algorithm can be used for individual identification (on human) or across groups. After comparison with existing research, our results are better than previous studies.
Acknowledgements
Not applicable.
About this supplement
This article has been published as part of BMC Bioinformatics Volume 20 Supplement 24, 2019: The International Conference on Intelligent Biology and Medicine (ICIBM) 2019. The full contents of the supplement are available online at https://bmcbioinformatics.biomedcentral.com/articles/supplements/volume-20-supplement-24.
Abbreviations
- CPD,
Combined power of discrimination
- CPI
Combined paternity index
- HE
Heterozygosity
- MPF,
Maximum profile frequency
- NGS
Next-generation sequencing
- PD
Power of discrimination
- PE
Power of exclusion
- PI
Paternity index
- PM, Mℓ
Probability of matching
- RMP,
Random-match probability
- STR
Short tandem repeat
- WGS
Whole genome sequence
Authors’ contributions
YL downloaded and processed the raw data, summarized the output data and prepared a draft. YL, JX implemented the algorithm, conducted the experiments. MC build on-line tools and the web interface. SCL proposed the topic, designed the algorithm, supervised this project, revised the manuscript. CFW supported the funding and advised the project. All authors read and approved the final manuscript.
Funding
This work was supported by the National Natural Science Foundation of China (Grant No. 773 31671287 and 31601007), Well-bred Program of Shandong Province (Grant No. 2017LZGC020), Taishan Leading Industry Talents- Agricultural Science of Shandong Province (Grant No. LJNY201713), and Shandong Province Modern Agricultural Technology System Donkey Industrial Innovation Team (Grant No. SDAIT-27).
Availability of data and materials
The source and on-line tools can be found in https://spe.deepomics.org
Ethics approval and consent to participate
Not applicable.
Consent for publication
Not applicable.
Competing interests
The authors declare that they have no competing interests.
Footnotes
Publisher’s Note
Springer Nature remains neutral with regard to jurisdictional claims in published maps and institutional affiliations.
Yilin Liu and Jiao Xu contributed equally to this work.
Contributor Information
Yilin Liu, Email: yilin9705@gmail.com.
Jiao Xu, Email: jiaox96@gmail.com.
Miaoxia Chen, Email: 1161670902@qq.com.
Changfa Wang, Email: wangcf1967@163.com.
Shuaicheng Li, Email: shuaicli@cityu.edu.hk.
References
- 1.Richard G-F, Kerrest A, Dujon B. Comparative genomics and molecular dynamics of dna repeats in eukaryotes. Microbiol Mol Biol Rev. 2008;72(4):686–727. doi: 10.1128/MMBR.00011-08. [DOI] [PMC free article] [PubMed] [Google Scholar]
- 2.Gulcher J. Microsatellite markers for linkage and association studies. Cold Spring Harb Protoc. 2012;2012(4):068510. doi: 10.1101/pdb.top068510. [DOI] [PubMed] [Google Scholar]
- 3.Ruitberg CM, Reeder DJ, Butler JM. Strbase: a short tandem repeat dna database for the human identity testing community. Nucleic Acids Res. 2001;29(1):320–2. doi: 10.1093/nar/29.1.320. [DOI] [PMC free article] [PubMed] [Google Scholar]
- 4.Butler John M. Short tandem repeat typing technologies used in human identity testing. BioTechniques. 2007;43(4):Sii–Sv. doi: 10.2144/000112582. [DOI] [PubMed] [Google Scholar]
- 5.Müller S, Flekna G, Müller M, Brem G. Use of canine microsatellite polymorphism in forensic examinations. J Hered. 1999;90(1):55–6. doi: 10.1093/jhered/90.1.55. [DOI] [PubMed] [Google Scholar]
- 6.Thomson J, Ayres KL, Pilotti V, Barrett M, Walker J, Debenham P. Analysis of disputed single-parent/child and sibling relationships using 16 str loci. Int J Leg Med. 2001;115(3):128–34. doi: 10.1007/s004140100212. [DOI] [PubMed] [Google Scholar]
- 7.Van Eenennaam A, Weaber R, Drake D, Penedo M, Quaas R, Garrick D, Pollak E. Dna-based paternity analysis and genetic evaluation in a large, commercial cattle ranch setting. J Anim Sci. 2007;85(12):3159–69. doi: 10.2527/jas.2007-0284. [DOI] [PubMed] [Google Scholar]
- 8.Grubwieser P, Zimmermann B, Niederstätter H, Pavlic M, Steinlechner M, Parson W. Evaluation of an extended set of 15 candidate str loci for paternity and kinship analysis in an austrian population sample. Int J Leg Med. 2007;121(2):85–9. doi: 10.1007/s00414-006-0079-9. [DOI] [PubMed] [Google Scholar]
- 9.Francisco L, Langsten A, Mellersh C, Neal C, Ostrander E. A class of highly polymorphic tetranucleotide repeats for canine genetic mapping. Mamm Genome. 1996;7(5):359–62. doi: 10.1007/s003359900104. [DOI] [PubMed] [Google Scholar]
- 10.van Asch B, Alves C, Gusmão L, Pereira V, Pereira F, Amorim A. A new autosomal str nineplex for canine identification and parentage testing. Electrophoresis. 2009;30(2):417–23. doi: 10.1002/elps.200800307. [DOI] [PubMed] [Google Scholar]
- 11.Menotti-Raymond MA, David VA, Wachter LL, Butler JM, O’Brien SJ. An str forensic typing system for genetic individualization of domestic cat (felis catus) samples. J Forensic Sci. 2005;50(5):2004317–10. doi: 10.1520/JFS2004317. [DOI] [PubMed] [Google Scholar]
- 12.Singh A, Gaur A, Shailaja K, Bala BS, Singh L. A novel microsatellite (str) marker for forensic identification of big cats in india. Forensic Sci Int. 2004;141(2-3):143–7. doi: 10.1016/j.forsciint.2004.01.015. [DOI] [PubMed] [Google Scholar]
- 13.Bowling A, Eggleston-Stott M, Byrns G, Clark R, Dileanis S, Wictum E. Validation of microsatellite markers for routine horse parentage testing. Anim Genet. 1997;28(4):247–52. doi: 10.1111/j.1365-2052.1997.00123.x. [DOI] [PubMed] [Google Scholar]
- 14.Chen J-W, Uboh CE, Soma LR, Li X, Guan F, You Y, Liu Y. Identification of racehorse and sample contamination by novel 24-plex str system. Forensic Sci Int Genet. 2010;4(3):158–67. doi: 10.1016/j.fsigen.2009.08.001. [DOI] [PubMed] [Google Scholar]
- 15.Jan C, Fumagalli L. Polymorphic dna microsatellite markers for forensic individual identification and parentage analyses of seven threatened species of parrots (family psittacidae) PeerJ. 2016;4:2416. doi: 10.7717/peerj.2416. [DOI] [PMC free article] [PubMed] [Google Scholar]
- 16.Kemp SJ, Hishida O, Wambugu J, Rink A, Teale A, Longeri M, Ma R, Da Y, Lewin H, Barendse W, et al. A panel of polymorphic bovine, ovine and caprine microsatellite markers. Anim Genet. 1995;26(5):299–306. doi: 10.1111/j.1365-2052.1995.tb02663.x. [DOI] [PubMed] [Google Scholar]
- 17.Ng J, Satkoski J, Premasuthan A, Kanthaswamy S. A nuclear dna-based species determination and dna quantification assay for common poultry species. J Food Sci Technol. 2014;51(12):4060–5. doi: 10.1007/s13197-012-0893-7. [DOI] [PMC free article] [PubMed] [Google Scholar]
- 18.Pontius JU, Mullikin JC, Smith DR, Team AS, Lindblad-Toh K, Gnerre S, Clamp M, Chang J, Stephens R, Neelam B, et al. Initial sequence and comparative analysis of the cat genome. Genome Res. 2007;17(11):1675–89. doi: 10.1101/gr.6380007. [DOI] [PMC free article] [PubMed] [Google Scholar]
- 19.Tellam RL, Worley KC. The genome sequence of taurine cattle: a window to ruminant biology and evolution. Neuroimage. 2006;32:1850. doi: 10.1016/j.neuroimage.2006.05.002. [DOI] [PMC free article] [PubMed] [Google Scholar]
- 20.Yang Y, Xie B, Yan J. Application of next-generation sequencing technology in forensic science. Genomics Proteome Bioinform. 2014;12(5):190–7. doi: 10.1016/j.gpb.2014.09.001. [DOI] [PMC free article] [PubMed] [Google Scholar]
- 21.Berglund EC, Kiialainen A, Syvänen A-C. Next-generation sequencing technologies and applications for human genetic history and forensics. Invest Genet. 2011;2(1):23. doi: 10.1186/2041-2223-2-23. [DOI] [PMC free article] [PubMed] [Google Scholar]
- 22.Li H, Durbin R. Fast and accurate short read alignment with burrows–wheeler transform. bioinformatics. 2009;25(14):1754–60. doi: 10.1093/bioinformatics/btp324. [DOI] [PMC free article] [PubMed] [Google Scholar]
- 23.Consortium IHGS, et al. Initial sequencing and analysis of the human genome. Nature. 2001;409(6822):860. doi: 10.1038/35057062. [DOI] [PubMed] [Google Scholar]
- 24.Gymrek Melissa, Golan David, Rosset Saharon, Erlich Yaniv. lobSTR: A short tandem repeat profiler for personal genomes. Genome Research. 2012;22(6):1154–1162. doi: 10.1101/gr.135780.111. [DOI] [PMC free article] [PubMed] [Google Scholar]
- 25.Consortium GP, et al. A global reference for human genetic variation. Nature. 2015;526(7571):68. doi: 10.1038/nature15393. [DOI] [PMC free article] [PubMed] [Google Scholar]
- 26.Evett IW, Weir BS. Interpreting DNA Evidence: Statistical Genetics for Forensic Scientists. MA: Sinauer Associates Sunderland; 1998. [Google Scholar]
- 27.Hale ML, Burg TM, Steeves TE. Sampling for microsatellite-based population genetic studies: 25 to 30 individuals per population is enough to accurately estimate allele frequencies. PloS ONE. 2012;7(9):45170. doi: 10.1371/journal.pone.0045170. [DOI] [PMC free article] [PubMed] [Google Scholar]
- 28.Budowle B, Moretti TR, Niezgoda SJ, Brown BL. Second European Symposium on Human Identification, vol. 7388. Madison: Promega Corporation; 1998. Codis and pcr-based short tandem repeat loci: law enforcement tools. [Google Scholar]
- 29.Gjertson DW, Brenner CH, Baur MP, Carracedo A, Guidet F, Luque JA, Lessig R, Mayr WR, Pascali VL, Prinz M, et al. Isfg: recommendations on biostatistics in paternity testing. Forensic Sci Int Genet. 2007;1(3-4):223–31. doi: 10.1016/j.fsigen.2007.06.006. [DOI] [PubMed] [Google Scholar]
Associated Data
This section collects any data citations, data availability statements, or supplementary materials included in this article.
Data Availability Statement
The source and on-line tools can be found in https://spe.deepomics.org