Abstract
A number of studies have revealed that there is an increasing incidence of early-onset colorectal cancer (CRC) in young adults (before the age of 50 years) and a progressive decline in CRC among older patients, after the age of 50 years (late-onset CRC). However, the etiology of early-onset CRC is not fully understood. The aim of the present study was to identify key genes associated with the development of early-onset CRC through weighted gene co-expression network analysis (WGCNA). The GSE39582 dataset was downloaded from the Gene Expression Omnibus database, and the data profiles of tissues from patients diagnosed before the age of 50 years were selected. The top 10,000 genes with the highest variability were used to construct the WGCNA. Hub genes were identified from the modules associated with clinical traits using gene significance >0.2 and module membership >0.8 as the cut-off criteria. Gene Ontology and pathway analyses were subsequently performed on the hub genes and a protein-protein interaction network (PPI) was constructed. The diagnostic value of module hub genes with a degree score >5 in the PPI network was verified in samples from patients with CRC diagnosed before the age of 50 years obtained from The Cancer Genome Atlas. Eight co-expressed gene modules were identified in the WGCNA and two modules (blue and turquoise) were associated with the tumor-node-metastasis stage. A total of 140 module hub genes were identified and found to be enriched in ‘mitochondrial large ribosomal subunit’, ‘structural constituent of ribosome’, ‘poly (A) RNA binding’, ‘collagen binding’, ‘protein ubiquitination’ and ‘ribosome pathway’. Twenty-six module hub genes were found to have a degree score >5 in the PPI network, seven of which [secreted protein acidic and cysteine rich (SPARC), decorin (DCN), fibrillin 1 (FBN1), WW domain containing transcription regulator 1 (WWTR1), transgelin (TAGLN), DEAD-box helicase 28 (DDX28) and cold shock domain containing C2 (CSDC2)], had good prognostic values for patients with early-onset CRC, but not late-onset CRC. Therefore, SPARC, DCN, FBN1, WWTR1, TAGLN, DDX28 and CSDC2 may contribute to the development of early-onset CRC and may serve as potential diagnostic biomarkers.
Keywords: early-onset colorectal cancer, weighted gene co-expression network, hub gene, tumor-node-metastasis stage
Introduction
Colorectal cancer (CRC) is the third most common cancer in males, and the second most common in females, with an incidence of ~1.1 million new cases and 551,269 mortalities per year worldwide in 2018 (1,2). Although there has been significant progress in cancer screening programs, the survival rate of patients with CRC remains unsatisfactory (3). In the past 20 years, the 5-year survival rate of patients with early-stage CRC was 69%, while that of patients with advanced-stage disease was 12% (4). The high mortality of CRC is in part due to limitations in the currently available therapies, which are the result of a limited understanding of the molecular mechanisms underlying CRC (5). Several factors are associated with the development of CRC, including smoking, obesity and alcohol consumption (6). In addition, it is estimated that genetic factors account for ~30% of CRC cases (7). However, the precise molecular mechanism remains unclear. It has been reported that early- and late-onset CRC may evolve in distinct ways, and there may be different molecular mechanisms according to the age at onset (8). Compared with late-onset CRC in patients who were diagnosed after the age of 50 years, early-onset CRC, before the age of 50 years, is more frequently associated with aggressive histology and distant metastasis (9). Although numerous efforts have been made to elucidate the genetic mechanism underlying CRC, the treatment of early-onset CRC remains challenging (10,11). Therefore, there is an urgent need to uncover the mechanisms of this disease.
High-throughput platforms have been widely used to search for genetic biomarkers for CRC. Microarrays have the capacity to analyze genes implicated in the development of CRC (12–14). Sun et al (15) used integrated bioinformatics analysis to identify seven genes that may serve as novel biomarkers for CRC. He et al (16) identified four long non-coding RNAs associated with the progression of CRC by analyzing gene data cohorts and constructing a competing endogenous RNA network. Zhang et al (17) used a bioinformatics approach to demonstrate that the hypermethylation of CpG islands in transforming growth factor β induced was associated with poor disease-free survival rates in patients with CRC. Furthermore, Yu et al (18) constructed a weighted gene co-expression network analysis (WGCNA) and revealed that ribosomal proteins play a key role in the development of CRC. However, to the best of the authors' knowledge, no previous studies have uncovered the mechanism of early-onset CRC.
In the present study, the GSE39582 dataset (11) was downloaded from the Gene Expression Omnibus (GEO) database and the gene expression data and clinical information of patients who were diagnosed with CRC before the age of 50 years were selected for further investigation. WGCNA was subsequently used to identify the most relevant modules in early-onset CRC. Gene Ontology (GO) and Kyoto Encyclopedia of Genes and Genomes (KEGG) analyses were performed on the hub genes and a protein-protein interaction (PPI) network was constructed. The diagnostic values of the hub genes that had a high degree score of protein-protein connection in the PPI network were analyzed. The genes identified in the present study may shed new light on the molecular mechanisms underlying the progression of early-onset CRC, and may serve as novel prognostic biomarkers.
Materials and methods
Data collection and preprocessing
The normalized gene expression dataset GSE39582 (19) and the corresponding clinical data were retrieved from the GEO database (www.ncbi.nlm.nih.gov/geo) using a GPL570 platform (Affymetrix Human Genome U133 Plus 2.0 Array). The GSE39582 dataset contained the gene expression information of 566 CRC tissues and 19 adjacent non-tumorous colorectal mucosal samples from patients with CRC. In order to explore the key genes associated with the progression of early-onset CRC, 53 CRC samples from patients in the GSE39582 dataset who were diagnosed before the age of 50 years were selected and used as the discovery dataset. Therefore, the gene expression information and clinical traits of the aforementioned 53 CRC samples were used in the present study. Ten clinical traits were studied in the present study, and included sex, age, tumor-node-metastasis (TNM) stage, T stage, M stage, N stage, recurrence-free survival (RFS) event (time from surgery to the first recurrence that was capped at 5 years), RFS days, overall survival (OS) event (time from surgery to death) and OS days. Prior to WGCNA, the probes without known gene symbols were filtered, and the collapse Rows function (version 1.17.0) (20) was used to merge the retained probes and gene symbols in expression profiles in the dataset. In the present study, the sample quality of the discovery dataset was assessed by sample clustering, according to the inter-array correlation (IAC) (21); an IAC >0.2 in the sample clustering tree was considered as the criterion for screening outlier samples. Based on this criterion, no samples were eliminated from the present study.
Co-expression module detection
The R package WGCNA (version 1.66) (22) was used to generate the gene co-expression network for the selected genes in the GSE39582 dataset. According to the variation of median absolute deviation (23), the expression profile of the top 10,000 genes and information about their clinical traits were used to construct the WGCNA. The threshold for identifying outlier samples was set as 0.2. All genes were then analyzed with each other using the Pearson's correlation test, and a matrix of similarity was constructed based on this analysis. A soft power of β=6 was selected based on the scale-free topology criterion of >0.85 (22). The adjacency matrix of gene expression data from all patients with early-onset CRC was then clustered using topological overlap matrix analysis. Finally, the dynamic tree cut algorithm in the R package WGCNA (version 1.66) (22), was applied to the dendrogram for module identification with the mini-size of module gene numbers set as 200.
Identification of clinically significant modules
In the present study, the module eigengene (ME) was used to represent each module, and was determined by the first principal component obtained from the principal component analysis of the expression matrix of each gene. In addition, the Pearson's correlation between the ME of each module and clinical information was defined as module significance (MS). The gene modules with an ME >0.3 and an MS <0.05 were considered significant in relation to clinical traits. All genes in these significant modules were selected for further analysis.
Screening and functional annotation of module hub genes
Hub genes are usually considered to be important in the majority of biological processes in the gene module (24). In the present study, all genes in the significant modules were screened to identify the hub genes, based on a gene significance (GS) >0.2 and module membership (MM) >0.8. The corresponding module hub gene information was subsequently uploaded onto the Database for Annotation, Visualization, and Integrated Discovery (DAVID; david.abcc.ncifcrf.gov) (version 6.8) to perform GO (http://geneontology.org/) and KEGG (https://www.genome.jp/kegg/) analyses. P<0.05 was used as the screening threshold.
PPI network construction and key gene screening
The Search Tool for the Retrieval of Interacting Genes (STRING; version 11.0; www.string-db.org) is a database that provides information for known and predicted PPIs (25). In the present study, STRING was used to analyze the PPIs among the module hub genes associated with tumor TNM stage in patients with early-onset CRC. A confidence score >0.4 was chosen to construct the PPI network, which was subsequently visualized using Cytoscape software (version 3.7.0) (26). Genes with ≥5 degrees were considered to be the key genes in the PPI network (27).
Validation of key genes in The Cancer Genome Atlas (TCGA) samples
The prognostic value of the key genes identified from the analysis of the PPI network was tested in the publically available TCGA-COAD (colon adenocarcinoma) dataset (https://portal.gdc.cancer.gov/). The TCGA-COAD dataset contains 480 patients with CRC, after screening out patients without information of diagnostic age, 419 patients were included as the validation dataset, which contained 53 patients with early-onset CRC and 366 patients with late-onset CRC. The associations between the key genes and the prognosis of patients with early-onset CRC were evaluated using Kaplan-Meier survival analysis in Prism (version 6.01; GraphPad Software, Inc.). All the patients were divided into high-expression and moderate-low expression groups according to the quartile method. Kaplan-Meier curves were constructed to determine the OS time and the log-rank test was used to compare the survival distribution. In addition, to further verify whether the key genes were uniquely associated with early-but not late-onset CRC, survival analysis validation of the key genes was performed using TCGA late-onset CRC samples. P<0.05 was considered to indicate a statistically significant difference.
Results
Construction of the co-expression network and identification of key modules
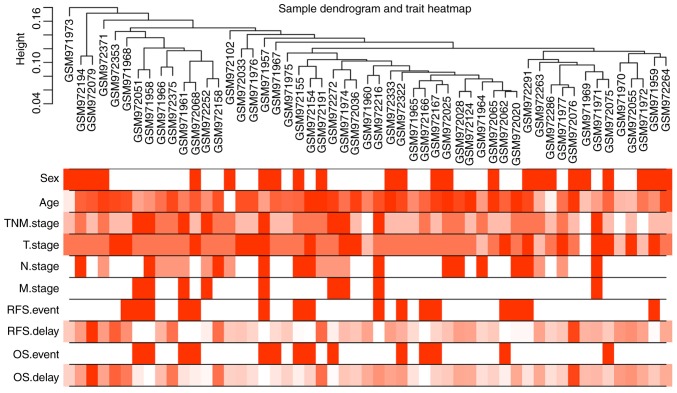
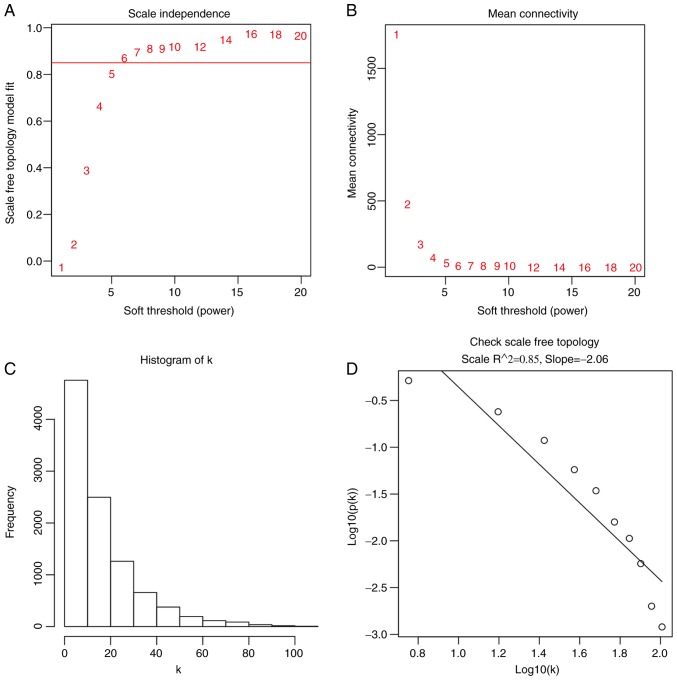
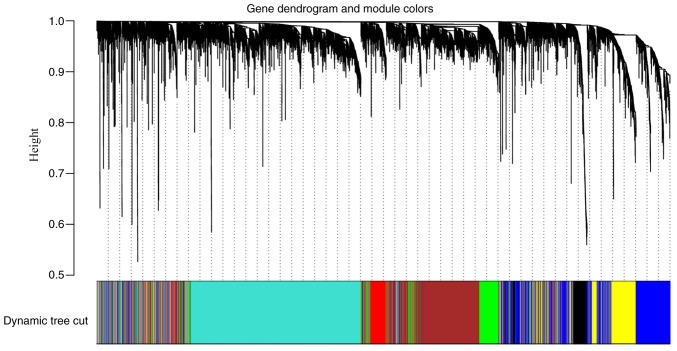
Following the exclusion of late-onset patients, 53 early-onset CRC samples and the corresponding clinical information were used for WGCNA (Fig. 1) using a soft power of β=6 as the soft threshold (Fig. 2). A total of seven co-expressed modules were obtained, and genes, which were not assigned to a specific module were distributed in the grey module (Fig. 3). The seven co-expressed modules were used for further analysis.
Figure 1.
Sample clustering tree and clinical trait heat map of tumor samples. The cut height was set as 0.2 and there was no deviated sample. The ten traits studied in the present study included sex, age, TNM, TNM-T, TNM-N and TNM-M stage, RFS survival event, RFS delay time, OS event and OS delay time. In the heatmap of clinical traits, red color represents male and white color represents female in sex; the red color depth of age, RFS delay time and OS delay time is proportional to time; the red color depth of TNM and TNM-T stage are divided into 4 scales according to stage 1–4; the red color depth of TNM-N stage is divided into 3 scales according to stage 0–2; the red color depth of TNM-M stage is divided into 2 scales according to stage 0–1; the red color depth of RFS event and OS event are divided into 2 scales according to whether the event occurs or not. TNM, tumor-node-metastasis; RFS, recurrence-free survival; OS, overall survival.
Figure 2.
Analysis of network topology for different soft-thresholding powers. (A) Scale independence and (B) mean connectivity of various soft-thresholding values (β). (C) Histogram of connectivity distribution when β=6. (D) Scale-free topology when β=6.
Figure 3.
Clustering dendrograms of all genes, with dissimilarity based on topological overlap, together with assigned module colors. The dynamic tree cut algorithm was applied to the dendrogram for module identification. Different colors represent different gene modules and there are seven co-expressed modules in the weighted gene co-expression network analysis network, including red, brown, green, turquoise, black, blue and yellow.
Identification of significant modules and module hub genes
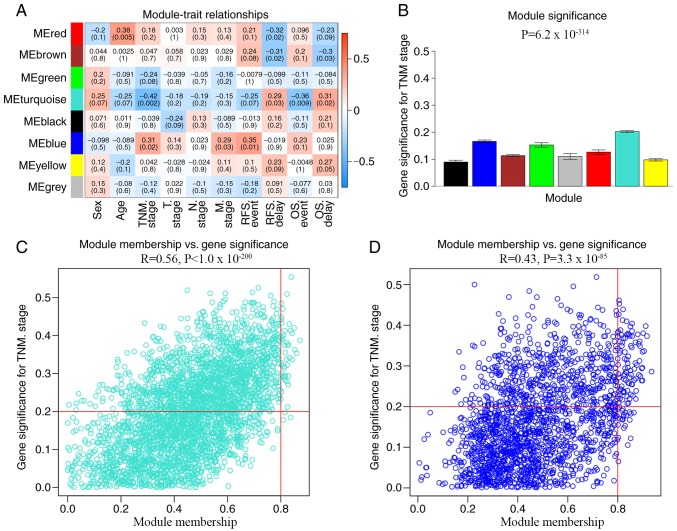
In the WGCNA, the association between modules and clinical data was investigated using Pearson's correlation analysis, and four modules were found to be significantly associated with clinical traits. The red module was significantly associated with age (R=0.38; P=0.005) and RFS delay time (R=−0.32; P=0.02), while the brown module was significantly associated with RFS delay time (R=−0.31; P=0.02) and OS delay time (R=−0.3; P=0.03). The turquoise module was significantly associated with TNM stage (R=−0.42; P=0.002), OS event (R=−0.31; P=0.009) and OS delay time (R=0.31; P=0.02) and the blue module was significantly associated with TNM stage (R=0.31; P=0.02) and RFS event (R=0.35; P=0.01). Considering that TNM stage plays an important role in evaluating the biological behavior and prognosis of CRC (28), the modules associated with TNM stage were considered to be the most important modules in the present study. The modules associated with TNM stage were the blue (R=0.43; P<0.001) and turquoise (R=0.56; P<0.001) modules. The blue and turquoise modules contained 1,874 and 3,331 genes, respectively. All genes in the blue and turquoise modules were screened based on a GS>0.2 and an MM>0.8 (Fig. 4). Finally, 95 blue and 45 turquoise hub genes were screened for further functional analysis.
Figure 4.
Identification of significant modules associated with clinical traits and screening module hub genes. (A) Correlation of module eigengenes with all traits. Each unit contains the corresponding correlation coefficient and P-value. The table is color-coded by correlation according to the color legend. (B) Distribution of TNM stage-related genes in all modules. Modules and enrichment significance are presented on the x- and y-axis, respectively. Scatterplots of GS for metastasis vs. MM in the (C) turquoise and (D) blue modules. The corresponding correlation coefficient and P-value are listed above the scatterplot. The horizontal red lines indicate GS=0.2 and the vertical red lines indicate MM=0.8. TNM, tumor-node-metastasis; GS, gene significance; MM, module membership.
GO function and KEGG pathway annotation of module hub genes
In order to better understand the biological function of the hub genes in the two modules, the 140 hub genes were uploaded onto the DAVID database for GO functional annotation and KEGG pathway analysis. The genes were mainly enriched in four GO terms: ‘mitochondrial large ribosomal subunit’, ‘structural constituent of ribosome’, ‘poly(A) RNA binding’ and ‘collagen binding and protein ubiquitination’. The KEGG pathway enrichment analysis revealed that the module hub genes were significantly involved in pathways associated with ribosomes.
PPI network construction and module analysis
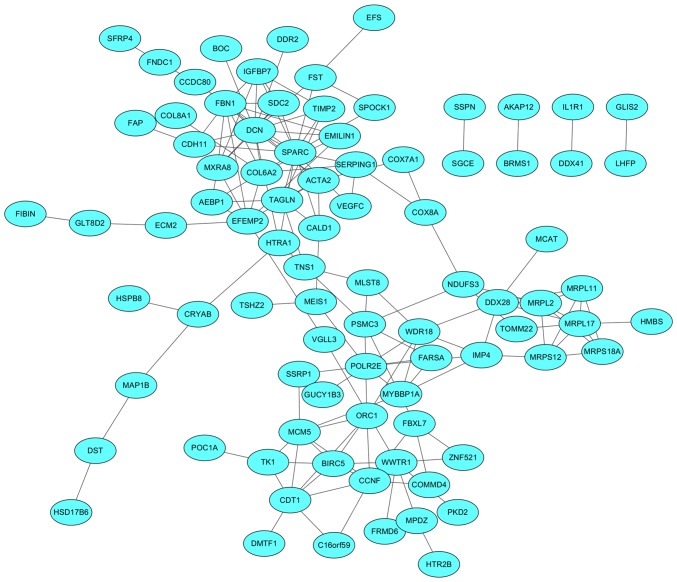
The PPI network was composed of 85 nodes and 152 edges and was exported from the STRING database and visualized using Cytoscape software (Fig. 5). A total of 26 genes with ≥5 degrees were identified in the PPI network and were selected for further validation using TCGA samples.
Figure 5.
Protein-protein interaction network analysis of module hub genes in the turquoise and blue modules.
Validation survival analysis of key genes in TCGA samples
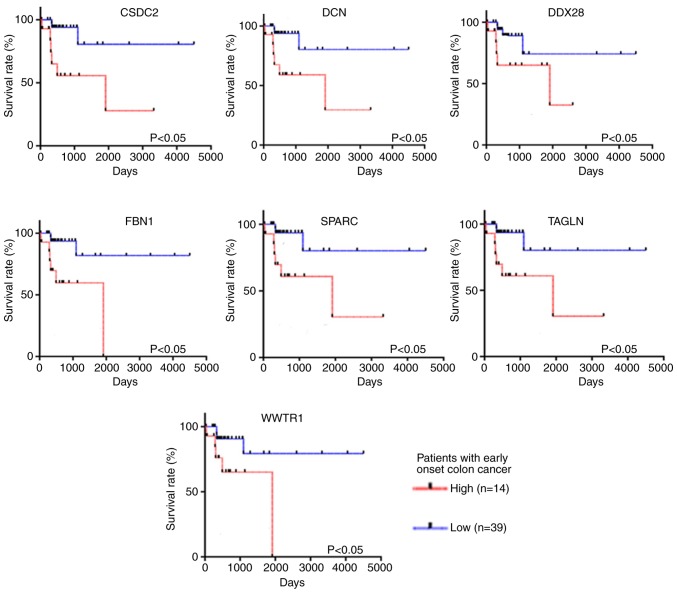
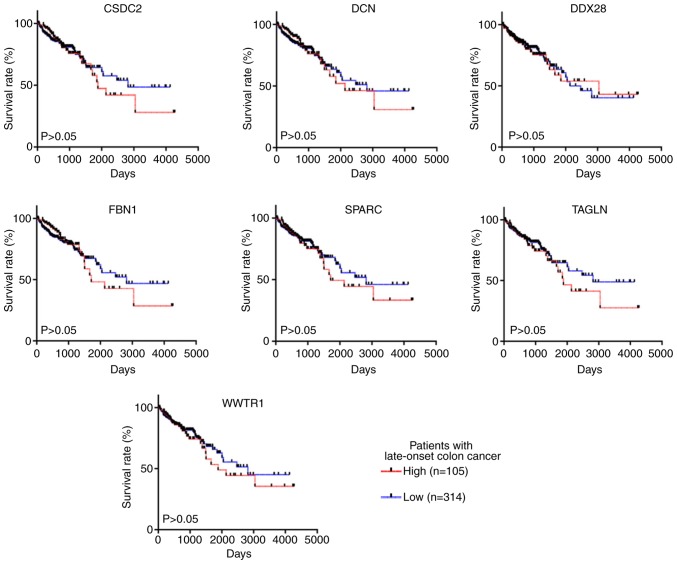
All 26 key genes [acetyl-CoA acetyltransferase 2, baculoviral IAP repeat containing 5, cyclin F, chromatin licensing and DNA replication factor 1, collagen type VI α 2 chain, cold shock domain containing C2 (CSDC2), decorin (DCN), DEAD-box helicase 28 (DDX28), EGF containing fibulin extracellular matrix protein 2, fibrilin 1 (FBN1), insulin like growth factor binding protein 7, IMP U3 small nucleolar ribonucleoprotein 4, minichromosome maintenance complex component 5, mitochondrial ribosomal protein L2, mitochondrial ribosomal protein L11, mitochondrial ribosomal protein L17, mitochondrial ribosomal protein S12, matrix remodeling associated 8, MYB binding protein 1a, origin recognition complex subunit 1, RNA polymerase II subunit E, proteasome 26S subunit-ATPase 3, secreted protein acidic and cysteine rich (SPARC), transgelin (TAGLN), WD repeat domain 1, WW domain containing transcription regulator 1 (WWTR1)] identified from the PPI network were analyzed using TCGA-COAD dataset. All patients in TCGA-COAD dataset who were diagnosed before the age of 50 (n=53) were selected for survival analysis. Patients were divided into high-expression (n=14) and moderate-low expression (n=39) groups according to the quartile method. Kaplan-Meier curves were constructed to determine the OS time. The results revealed that seven genes, including SPARC, DCN, FBN1, WWTR1, TAGLN, DDX28 and CSDC2, remained statistically significant prognostic factors for patients with early-onset CRC (P<0.05; Fig. 6). On the other hand, the expression level of these seven key genes was not significantly associated with OS time in patients with late-onset CRC (P>0.05; Fig. 7).
Figure 6.
Survival analysis of protein-protein interaction hub gene expression levels in patients with early-onset colorectal cancer from The Cancer Genome Atlas Colon Adenocarcinoma dataset. CSDC2, cold shock domain containing C2; DCN, decorin; DDX28, DEAD-box helicase 28; FBN1, fibrillin 1; SPARC, secreted protein acidic and cysteine rich; TAGLN, transgelin; WWTR1, WW domain containing transcription regulator 1.
Figure 7.
Survival analysis of early-onset CRC-related hub gene expression levels in patients with late-onset CRC from The Cancer Genome Atlas Colon Adenocarcinoma dataset. CRC, colorectal cancer; CSDC2, cold shock domain containing C2; DCN, decorin; DDX28, DEAD-box helicase 28; FBN1, fibrillin 1; SPARC, secreted protein acidic and cysteine rich; TAGLN, transgelin; WWTR1, WW domain containing transcription regulator 1.
Discussion
In contrast to the decreasing incidence of late-onset CRC, the incidence and mortality of early-onset CRCs has been increasing (29). According to the latest data, patients with early-onset CRC account for 2–8% of all CRC cases (30,31). Various studies have shown that polygenic changes play a key role in the development of early-onset CRC (10,32). However, there is a limited understanding of the latent molecular mechanism in the development and progression of CRC.
Gene expression data of patients with early-onset CRC extracted from the GEO dataset GSE39582 were investigated in the present study. WGCNA revealed that the functions of the genes associated with TNM stage in early-onset CRC were enriched in ‘mitochondrial large ribosomal subunit’, ‘structural constituent of ribosome’ and ‘poly (A) RNA binding’. PPI network analysis and TCGA-COAD dataset revealed that there were seven genes with an important role in the progression of early-onset CRC, including SPARC, DCN, FBN1, WWTR1, TAGLN, DDX28 and CSDC2.
SPARC, a multifunctional calcium-binding glycoprotein, belongs to a group of matricellular proteins (33,34). Previous studies have shown that SPARC is usually secreted into the extracellular matrix and plays a key role in cellular processes, including proliferation, migration, adhesion and differentiation (33,34). SPARC is highly expressed in oral squamous cell carcinoma and has the potential to promote oral squamous cell carcinoma cell proliferation and metastasis (35). Furthermore, the high expression level of SPARC indicated a poor outcome in patients with esophageal squamous cell carcinoma (36). Additionally, the expression level of SPARC is associated with lymph node metastasis in pancreatic cancer (37). However, a study by Chew et al (38) concluded that high SPARC expresion is associated with improved disease outcome in stage II CRC and may be a prognostic indicator of cancer-specific survival. DCN belongs to the small leucine-rich proteoglycans family (39,40). Accumulating evidence has shown that the DCN expression is dysregulated in several types of cancer, including pancreatic and breast cancer (39,40). The expression of DCN is decreased in renal cell carcinoma, and the ectopic expression of DCN can decrease cell proliferation and metastasis in renal cell carcinoma (41). Overexpression of DCN also has the capacity to decrease CRC cell proliferation and migration by increasing the expression of cyclin dependent kinase inhibitor 1A and E-cadherin (42). However, the present study revealed that DCN was associated with TNM stage, and a high expression of DCN predicted poor prognosis in patients with early-onset CRC. Therefore, further experimental studies are required to investigate the role of DCN in early-onset CRC.
FBN1 encodes fibrillin, which is the primary component of microfibrils in the extracellular matrix (43). A previous study reported that downregulated FBN1 expression plays a key role in the development of germ cell tumors (44). FBN1 is also a target gene of microRNA (miR)-133b and promotes gastric cancer cell proliferation and invasion (45). Moreover, hypermethylated FBN1 was detected in patients with CRC but not in healthy controls, which suggested that hypermethylated FBN1 is a sensitive biomarker for CRC (46). WWTR1 is a transcriptional coactivator with the capacity to combine with various transcription factors and promote their effect (47). WWTR1 is highly expressed in renal cancer and is associated with TNM stage (48). Furthermore, the nuclear localization of WWTR1 is correlated with worse clinical outcomes in lung squamous cell carcinomas compared to adjacent normal lung tissues (49). Furthermore, another study suggested that WWTR1 expression may serve as a prognostic indicator and therapeutic target in CRC (50). TAGLN is an actin stress fiber binding protein that stabilizes the cytoskeleton through actin binding and plays a key role in cancer cell migration, invasion and proliferation (51). A previous study demonstrated that the expression level of TAGLN was decreased in bladder cancer compared to normal bladder mucosae tissues (52). Exogenous TAGLN decreases the migration and proliferation of CRC cells in vitro (53). However, in the present study, patients with early-onset CRC with high TAGLN expression were found to have a lower OS time compared with patients with moderate-low expression. Therefore, TAGLN may be an oncogene in early-onset CRC. DDX28, a conserved mitochondrial matrix protein, is essential for mitochondrial oxidative phosphorylation (54). A previous study revealed that high DDX28 expression was associated with high risk of CRC (55). CSDC2 is an mRNA-binding protein and a target gene of miR-373 (56). CSDC2 plays a key role in decidua development (57). However, its role in cancer development remains unknown.
In conclusion, the present study used WGCNA and other analysis methods, including GO, KEGG, PPI network and survival analysis, to identify seven genes (SPARC, DCN, FBN1, WWTR1, TAGLN, DDX28 and CSDC2) associated with the development and prognosis of early-onset CRC. These genes may serve as novel biomarkers for the diagnosis of early-onset CRC.
Acknowledgements
Not applicable.
Glossary
Abbreviations
- CRC
colorectal cancer
- GEO
Gene Expression Omnibus
- RFS
recurrence-free survival
- OS
overall survival
- WGCNA
weighted gene co-expression network
- GO
Gene Ontology
- KEGG
Kyoto Encyclopedia of Genes and Genomes
- PPI
protein-protein interaction
Funding
No funding was received.
Availability of data and materials
The datasets generated and analyzed during the present study are available in the GEO database (http://www.ncbi.nlm.nih.gov/geo/) and TCGA database (https://portal.gdc.cancer.gov/).
Authors' contributions
XM, ZS and HQ conceived and designed the study. XM, BY and ZZ collected the data and wrote the manuscript. BY and SL performed the data analysis. HQ contributed to the language editing. All authors read and approved the final version of the manuscript.
Ethics approval and consent to participate
Not applicable.
Patient consent for publication
Not applicable.
Competing interests
The authors declare that they have no competing interests.
References
- 1.Dienstmann R, Vermeulen L, Guinney J, Kopetz S, Tejpar S, Tabernero J. Consensus molecular subtypes and the evolution of precision medicine in colorectal cancer. Nat Rev Cancer. 2017;17:79–92. doi: 10.1038/nrc.2016.126. [DOI] [PubMed] [Google Scholar]
- 2.Bray F, Ferlay J, Soerjomataram I, Siegel RL, Torre LA, Jemal A. Global cancer statistics 2018: GLOBOCAN estimates of incidence and mortality worldwide for 36 cancers in 185 countries. CA Cancer J Clin. 2018;68:394–424. doi: 10.3322/caac.21492. [DOI] [PubMed] [Google Scholar]
- 3.Torre LA, Siegel RL, Ward EM, Jemal A. Global cancer incidence and mortality rates and trends-an update. Cancer Epidemiol Biomarkers Prev. 2016;25:16–27. doi: 10.1158/1055-9965.EPI-15-0578. [DOI] [PubMed] [Google Scholar]
- 4.Veenstra CM, Krauss JC. Emerging systemic therapies for colorectal cancer. Clin Colon Rectal Surg. 2018;31:179–191. doi: 10.1055/s-0037-1602238. [DOI] [PMC free article] [PubMed] [Google Scholar]
- 5.Gonzalez N, Prieto I, Del Puerto-Nevado L, Portal-Nuñez S, Ardura JA, Corton M, Fernández-Fernández B, Aguilera O, Gomez-Guerrero C, Mas S, et al. 2017 update on the relationship between diabetes and colorectal cancer: Epidemiology, potential molecular mechanisms and therapeutic implications. Oncotarget. 2017;8:18456–18485. doi: 10.18632/oncotarget.14472. [DOI] [PMC free article] [PubMed] [Google Scholar]
- 6.Jayasekara H, English DR, Haydon A, Hodge AM, Lynch BM, Rosty C, Williamson EJ, Clendenning M, Southey MC, Jenkins MA, et al. Associations of alcohol intake, smoking, physical activity and obesity with survival following colorectal cancer diagnosis by stage, anatomic site and tumor molecular subtype. Int J Cancer. 2018;142:238–250. doi: 10.1002/ijc.31049. [DOI] [PubMed] [Google Scholar]
- 7.Lichtenstein P, Holm NV, Verkasalo PK, Iliadou A, Kaprio J, Koskenvuo M, Pukkala E, Skytthe A, Hemminki K. Environmental and heritable factors in the causation of cancer-analyses of cohorts of twins from Sweden, Denmark, and Finland. N Engl J Med. 2000;343:78–85. doi: 10.1056/NEJM200007133430201. [DOI] [PubMed] [Google Scholar]
- 8.Ballester V, Rashtak S, Boardman L. Clinical and molecular features of young-onset colorectal cancer. World J Gastroenterol. 2016;22:1736–1744. doi: 10.3748/wjg.v22.i5.1736. [DOI] [PMC free article] [PubMed] [Google Scholar]
- 9.Yeo H, Betel D, Abelson JS, Zheng XE, Yantiss R, Shah MA. Early-onset colorectal cancer is distinct from traditional colorectal cancer. Clin Colorectal Cancer. 2017;16:293–299.e6. doi: 10.1016/j.clcc.2017.06.002. [DOI] [PubMed] [Google Scholar]
- 10.Cavestro GM, Mannucci A, Zuppardo RA, Di Leo M, Stoffel E, Tonon G. Early onset sporadic colorectal cancer: Worrisome trends and oncogenic features. Dig Liver Dis. 2018;50:521–532. doi: 10.1016/j.dld.2018.02.009. [DOI] [PubMed] [Google Scholar]
- 11.Burnett-Hartman AN, Powers JD, Chubak J, Corley DA, Ghai NR, McMullen CK, Pawloski PA, Sterrett AT, Feigelson HS. Treatment patterns and survival differ between early-onset and late-onset colorectal cancer patients: The patient outcomes to advance learning network. Cancer Causes Control. 2019;30:747–755. doi: 10.1007/s10552-019-01181-3. [DOI] [PubMed] [Google Scholar]
- 12.Williams SP, Barthorpe AS, Lightfoot H, Garnett MJ, McDermott U. High-throughput RNAi screen for essential genes and drug synergistic combinations in colorectal cancer. Sci Data. 2017;4:170139. doi: 10.1038/sdata.2017.139. [DOI] [PMC free article] [PubMed] [Google Scholar]
- 13.Gao M, Zhong A, Patel N, Alur C, Vyas D. High throughput RNA sequencing utility for diagnosis and prognosis in colon diseases. World J Gastroenterol. 2017;23:2819–2825. doi: 10.3748/wjg.v23.i16.2819. [DOI] [PMC free article] [PubMed] [Google Scholar]
- 14.Xiong W, Ai YQ, Li YF, Ye Q, Chen ZT, Qin JY, Liu QY, Wang H, Ju YH, Li WH, Li YF. Microarray analysis of circular RNA expression profile associated with 5-fluorouracil-based chemoradiation resistance in colorectal cancer cells. Biomed Res Int. 2017;2017:8421614. doi: 10.1155/2017/8421614. [DOI] [PMC free article] [PubMed] [Google Scholar]
- 15.Sun G, Li Y, Peng Y, Lu D, Zhang F, Cui X, Zhang Q, Li Z. Identification of differentially expressed genes and biological characteristics of colorectal cancer by integrated bioinformatics analysis. J Cell Physiol. 2019 doi: 10.1002/jcp.28163. (Epub ahead of print) [DOI] [PubMed] [Google Scholar]
- 16.He M, Lin Y, Xu Y. Identification of prognostic biomarkers in colorectal cancer using a long non-coding RNA-mediated competitive endogenous RNA network. Oncol Lett. 2019;17:2687–2694. doi: 10.3892/ol.2019.9936. [DOI] [PMC free article] [PubMed] [Google Scholar]
- 17.Zhang H, Dong S, Feng J. Epigenetic profiling and mRNA expression reveal candidate genes as biomarkers for colorectal cancer. J Cell Biochem. 2019;120:10767–10776. doi: 10.1002/jcb.28368. [DOI] [PubMed] [Google Scholar]
- 18.Yu C, Hong H, Zhang S, Zong Y, Ma J, Lu A, Sun J, Zheng M. Identification of key genes and pathways involved in microsatellite instability in colorectal cancer. Mol Med Rep. 2019;19:2065–2076. doi: 10.3892/mmr.2019.9849. [DOI] [PMC free article] [PubMed] [Google Scholar]
- 19.Marisa L, de Reynies A, Duval A, Selves J, Gaub MP, Vescovo L, Etienne-Grimaldi MC, Schiappa R, Guenot D, Ayadi M, et al. Gene expression classification of colon cancer into molecular subtypes: Characterization, validation, and prognostic value. PLoS Med. 2013;10:e1001453. doi: 10.1371/journal.pmed.1001453. [DOI] [PMC free article] [PubMed] [Google Scholar]
- 20.Miller JA, Cai C, Langfelder P, Geschwind DH, Kurian SM, Salomon DR, Horvath S. Strategies for aggregating gene expression data: the collapseRows R function. BMC Bioinformatics. 2011;12:322. doi: 10.1186/1471-2105-12-322. [DOI] [PMC free article] [PubMed] [Google Scholar]
- 21.Giorgi FM, Bolger AM, Lohse M, Usadel B. Algorithm-driven artifacts in median polish summarization of microarray data. BMC Bioinformatics. 2010;11:553. doi: 10.1186/1471-2105-11-553. [DOI] [PMC free article] [PubMed] [Google Scholar]
- 22.Langfelder P, Horvath S. WGCNA: An R package for weighted correlation network analysis. BMC Bioinformatics. 2008;9:559. doi: 10.1186/1471-2105-9-559. [DOI] [PMC free article] [PubMed] [Google Scholar]
- 23.Chung N, Zhang XD, Kreamer A, Locco L, Kuan PF, Bartz S, Linsley PS, Ferrer M, Strulovici B. Median absolute deviation to improve hit selection for genome-scale RNAi screens. J Biomol Screen. 2008;13:149–158. doi: 10.1177/1087057107312035. [DOI] [PubMed] [Google Scholar]
- 24.Horvath S, Zhang B, Carlson M, Lu KV, Zhu S, Felciano RM, Laurance MF, Zhao W, Qi S, Chen Z, et al. Analysis of oncogenic signaling networks in glioblastoma identifies ASPM as a molecular target. Proc Natl Acad Sci USA. 2006;103:17402–17407. doi: 10.1073/pnas.0608396103. [DOI] [PMC free article] [PubMed] [Google Scholar]
- 25.Szklarczyk D, Franceschini A, Wyder S, Forslund K, Heller D, Huerta-Cepas J, Simonovic M, Roth A, Santos A, Tsafou KP, et al. STRING v10: Protein-protein interaction networks, integrated over the tree of life. Nucleic Acids Res. 2015;43:D447–D452. doi: 10.1093/nar/gku1003. [DOI] [PMC free article] [PubMed] [Google Scholar]
- 26.Shannon P, Markiel A, Ozier O, Baliga NS, Wang JT, Ramage D, Amin N, Schwikowski B, Ideker T. Cytoscape: A software environment for integrated models of biomolecular interaction networks. Genome Res. 2003;13:2498–2504. doi: 10.1101/gr.1239303. [DOI] [PMC free article] [PubMed] [Google Scholar]
- 27.Liu C, Chen N, Huang K, Jiang M, Liang H, Sun Z, Tian J, Wang D. Identifying hub genes and potential mechanisms associated with senescence in human annulus cells by gene expression profiling and bioinformatics analysis. Mol Med Rep. 2018;17:3465–3472. doi: 10.3892/mmr.2017.8322. [DOI] [PMC free article] [PubMed] [Google Scholar]
- 28.Kawakami H, Zaanan A, Sinicrope FA. Microsatellite instability testing and its role in the management of colorectal cancer. Curr Treat Options Oncol. 2015;16:30. doi: 10.1007/s11864-015-0348-2. [DOI] [PMC free article] [PubMed] [Google Scholar]
- 29.Connell LC, Mota JM, Braghiroli MI, Hoff PM. The rising incidence of younger patients with colorectal cancer: Questions about screening, biology, and treatment. Curr Treat Options Oncol. 2017;18:23. doi: 10.1007/s11864-017-0463-3. [DOI] [PubMed] [Google Scholar]
- 30.Ferlay J, Steliarova-Foucher E, Lortet-Tieulent J, Rosso S, Coebergh JW, Comber H, Forman D, Bray F. Cancer incidence and mortality patterns in Europe: Estimates for 40 countries in 2012. Eur J Cancer. 2013;49:1374–1403. doi: 10.1016/j.ejca.2012.12.027. [DOI] [PubMed] [Google Scholar]
- 31.Siegel RL, Jemal A, Ward EM. Increase in incidence of colorectal cancer among young men and women in the United States. Cancer Epidemiol Biomarkers Prev. 2009;18:1695–1698. doi: 10.1158/1055-9965.EPI-09-0186. [DOI] [PubMed] [Google Scholar]
- 32.Stigliano V, Sanchez-Mete L, Martayan A, Anti M. Early-onset colorectal cancer: A sporadic or inherited disease? World J Gastroenterol. 2014;20:12420–12430. doi: 10.3748/wjg.v20.i35.12420. [DOI] [PMC free article] [PubMed] [Google Scholar]
- 33.Vaz J, Ansari D, Sasor A, Andersson R. SPARC: A potential prognostic and therapeutic target in pancreatic cancer. Pancreas. 2015;44:1024–1035. doi: 10.1097/MPA.0000000000000409. [DOI] [PMC free article] [PubMed] [Google Scholar]
- 34.Feng J, Tang L. SPARC in tumor pathophysiology and as a potential therapeutic target. Curr Pharm Des. 2014;20:6182–6190. doi: 10.2174/1381612820666140619123255. [DOI] [PubMed] [Google Scholar]
- 35.Jing Y, Jin Y, Wang Y, Chen S, Zhang X, Song Y, Wang Z, Pu Y, Ni Y, Hu Q. SPARC promotes the proliferation and metastasis of oral squamous cell carcinoma by PI3K/AKT/PDGFB/PDGFRβ axis. 2019 doi: 10.1002/jcp.28205. (Epub ahead of print) [DOI] [PubMed] [Google Scholar]
- 36.Chen Y, Zhang Y, Tan Y, Liu Z. Clinical significance of SPARC in esophageal squamous cell carcinoma. Biochem Biophys Res Commun. 2017;492:184–191. doi: 10.1016/j.bbrc.2017.08.043. [DOI] [PubMed] [Google Scholar]
- 37.Yu XZ, Guo ZY, Di Y, Yang F, Ouyang Q, Fu DL, Jin C. The relationship between SPARC expression in primary tumor and metastatic lymph node of resected pancreatic cancer patients and patients' survival. Hepatobiliary Pancreat Dis Int. 2017;16:104–109. doi: 10.1016/S1499-3872(16)60168-6. [DOI] [PubMed] [Google Scholar]
- 38.Chew A, Salama P, Robbshaw A, Klopcic B, Zeps N, Platell C, Lawrance IC. SPARC, FOXP3, CD8 and CD45 correlation with disease recurrence and long-term disease-free survival in colorectal cancer. PLoS One. 2011;6:e22047. doi: 10.1371/journal.pone.0022047. [DOI] [PMC free article] [PubMed] [Google Scholar]
- 39.Neill T, Schaefer L, Iozzo RV. Decorin as a multivalent therapeutic agent against cancer. Adv Drug Deliv Rev. 2016;97:174–185. doi: 10.1016/j.addr.2015.10.016. [DOI] [PMC free article] [PubMed] [Google Scholar]
- 40.Zhang W, Ge Y, Cheng Q, Zhang Q, Fang L, Zheng J. Decorin is a pivotal effector in the extracellular matrix and tumour microenvironment. Oncotarget. 2018;9:5480–5491. doi: 10.18632/oncotarget.23869. [DOI] [PMC free article] [PubMed] [Google Scholar]
- 41.Ho TH, Serie DJ, Parasramka M, Cheville JC, Bot BM, Tan W, Wang L, Joseph RW, Hilton T, Leibovich BC, et al. Differential gene expression profiling of matched primary renal cell carcinoma and metastases reveals upregulation of extracellular matrix genes. Ann Oncol. 2017;28:604–610. doi: 10.1093/annonc/mdw652. [DOI] [PMC free article] [PubMed] [Google Scholar]
- 42.Bi X, Pohl NM, Qian Z, Yang GR, Gou Y, Guzman G, Kajdacsy-Balla A, Iozzo RV, Yang W. Decorin-mediated inhibition of colorectal cancer growth and migration is associated with E-cadherin in vitro and in mice. Carcinogenesis. 2012;33:326–330. doi: 10.1093/carcin/bgr293. [DOI] [PMC free article] [PubMed] [Google Scholar]
- 43.Milewicz DM, Guo DC, Tran-Fadulu V, Lafont AL, Papke CL, Inamoto S, Kwartler CS, Pannu H. Genetic basis of thoracic aortic aneurysms and dissections: Focus on smooth muscle cell contractile dysfunction. Annu Rev Genomics Hum Genet. 2008;9:283–302. doi: 10.1146/annurev.genom.8.080706.092303. [DOI] [PubMed] [Google Scholar]
- 44.Cierna Z, Mego M, Jurisica I, Machalekova K, Chovanec M, Miskovska V, Svetlovska D, Kalavska K, Rejlekova K, Kajo K, et al. Fibrillin-1 (FBN-1) a new marker of germ cell neoplasia in situ. BMC Cancer. 2016;16:597. doi: 10.1186/s12885-016-2644-z. [DOI] [PMC free article] [PubMed] [Google Scholar]
- 45.Yang D, Zhao D, Chen X. MiR-133b inhibits proliferation and invasion of gastric cancer cells by up-regulating FBN1 expression. Cancer Biomark. 2017;19:425–436. doi: 10.3233/CBM-160421. [DOI] [PubMed] [Google Scholar]
- 46.Guo Q, Song Y, Zhang H, Wu X, Xia P, Dang C. Detection of hypermethylated fibrillin-1 in the stool samples of colorectal cancer patients. Med Oncol. 2013;30:695. doi: 10.1007/s12032-013-0695-4. [DOI] [PubMed] [Google Scholar]
- 47.Wei J, Wang L, Zhu J, Sun A, Yu G, Chen M, Huang P, Liu H, Shao G, Yang W, Lin Q. The Hippo signaling effector WWTR1 is a metastatic biomarker of gastric cardia adenocarcinoma. Cancer Cell Int. 2019;19:74. doi: 10.1186/s12935-019-0796-z. [DOI] [PMC free article] [PubMed] [Google Scholar]
- 48.Ruan H, Bao L, Song Z, Wang K, Cao Q, Tong J, Cheng G, Xu T, Chen X, Liu D, et al. High expression of TAZ serves as a novel prognostic biomarker and drives cancer progression in renal cancer. Exp Cell Res. 2019;376:181–191. doi: 10.1016/j.yexcr.2019.02.001. [DOI] [PubMed] [Google Scholar]
- 49.Wang Y, Han Y, Guo Z, Yang Y, Ren T. Nuclear TAZ activity distinctly associates with subtypes of non-small cell lung cancer. Biochem Biophys Res Commun. 2019;509:828–832. doi: 10.1016/j.bbrc.2019.01.012. [DOI] [PubMed] [Google Scholar]
- 50.Yuen HF, McCrudden CM, Huang YH, Tham JM, Zhang X, Zeng Q, Zhang SD, Hong W. TAZ expression as a prognostic indicator in colorectal cancer. PLoS One. 2013;8:e54211. doi: 10.1371/journal.pone.0054211. [DOI] [PMC free article] [PubMed] [Google Scholar]
- 51.Dos Santos Hidalgo G, Meola J, Rosa E Silva JC, Paro de Paz CC, Ferriani RA. TAGLN expression is deregulated in endometriosis and may be involved in cell invasion, migration, and differentiation. Fertil Steril. 2011;96:700–703. doi: 10.1016/j.fertnstert.2011.06.052. [DOI] [PubMed] [Google Scholar]
- 52.Liu Y, Wu X, Wang G, Hu S, Zhang Y, Zhao S. CALD1, CNN1, and TAGLN identified as potential prognostic molecular markers of bladder cancer by bioinformatics analysis. Medicine (Baltimore) 2019;98:e13847. doi: 10.1097/MD.0000000000013847. [DOI] [PMC free article] [PubMed] [Google Scholar]
- 53.Li Q, Shi R, Wang Y, Niu X. TAGLN suppresses proliferation and invasion, and induces apoptosis of colorectal carcinoma cells. Tumor Biol. 2013;34:505–513. doi: 10.1007/s13277-012-0575-0. [DOI] [PubMed] [Google Scholar]
- 54.Tu YT, Barrientos A. The Human mitochondrial DEAD-box protein DDX28 resides in RNA granules and functions in mitoribosome assembly. Cell Rep. 2015;10:854–864. doi: 10.1016/j.celrep.2015.01.033. [DOI] [PMC free article] [PubMed] [Google Scholar]
- 55.Loo LW, Cheng I, Tiirikainen M, Lum-Jones A, Seifried A, Dunklee LM, Church JM, Gryfe R, Weisenberger DJ, Haile RW, et al. cis-Expression QTL analysis of established colorectal cancer risk variants in colon tumors and adjacent normal tissue. PLoS One. 2012;7:e30477. doi: 10.1371/journal.pone.0030477. [DOI] [PMC free article] [PubMed] [Google Scholar]
- 56.Place RF, Li LC, Pookot D, Noonan EJ, Dahiya R. MicroRNA-373 induces expression of genes with complementary promoter sequences. Proc Natl Acad Sci USA. 2008;105:1608–1613. doi: 10.1073/pnas.0707594105. [DOI] [PMC free article] [PubMed] [Google Scholar]
- 57.Vallejo G, Mestre-Citrinovitz AC, Winterhager E, Saragueta PE. CSDC2, a cold shock domain RNA-binding protein in decidualization. J Cell Physiol. 2018;234:740–748. doi: 10.1002/jcp.26885. [DOI] [PubMed] [Google Scholar]
Associated Data
This section collects any data citations, data availability statements, or supplementary materials included in this article.
Data Availability Statement
The datasets generated and analyzed during the present study are available in the GEO database (http://www.ncbi.nlm.nih.gov/geo/) and TCGA database (https://portal.gdc.cancer.gov/).


