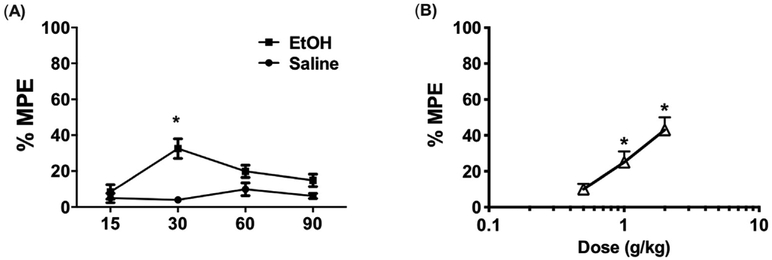
Fig. 1. Antinociceptive effects of ethanol in the Hargreaves test.
(A) Time course of antinociceptive effects of 2 g/kg EtOH in the hot plate assay *P < 0.01 vs saline at a given time point. Data are expressed as mean ± S.E.M. of n = 8–10 per group. (B) Dose response curve of EtOH (0.5–2 g/kg, i.g.) in mice. *P < 0.05 vs 0.5 g/kg EtOH. EtOH = ethanol.

