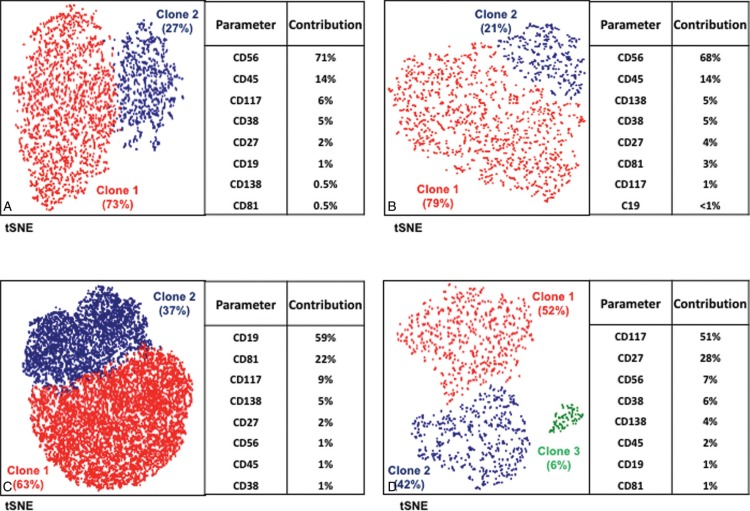
FIGURE 3.
Biphenotypic MRD+ cases. t-SNE projection of clonal PCs from four different MRD+ patients displaying clonal heterogeneity on phenotypic grounds. The relative percentage of each clone within the total tumor PC compartment as well as the contribution of each marker for the automated identification of such clones are shown for each case.

