

Abstract
PEGylation of metal oxide nanoparticles is the common approach to improve their biocompatibility and in vivo circulation time. In this work, we present a combined experimental and theoretical study to determine the operating condition that guarantee very high grafting densities, which are desirable in any biomedical application. Moreover, we present an insightful conformational analysis spanning different coverage regimes and increasing polymer chain lengths. Based on 13C NMR measurements and molecular dynamics simulations, we show that classical and popular models of polymer conformation on surfaces fail in determining the mushroom-to-brush transition point and prove that it actually takes place only at rather high grafting density values.
1. Introduction
The application of TiO2 nanostructures in nanobiotechnology and biomedicine has gained increasing attention during the past few years.1,2 In particular, highly curved crystalline nanoparticles (NPs) offer an enhanced reactivity for an easy conjugation with bioactive molecules, producing useful hybrid multifunctional nanodevices for simultaneous photodynamic therapy, drug delivery, and imaging.3−5
However, in a biological environment, without a proper stabilization, titanium dioxide NPs tend to aggregate and interact with the surrounding media, resulting to be cytotoxic and unfit for clinical treatments.6,7 Polymer grafting on the nanoparticle surface is an effective route to improve solubility, mobility, and tissue penetration and reduce toxicity and undesired interactions. Coating with polyethylene glycol (PEG) is particularly convenient because it is inexpensive, FDA-approved, prevents nanoparticles agglomeration, opsonization from the immune system, and therefore increases the in vivo circulation time.8−11
Control over the grafting density is crucial for determining the polymer corona size and shape, which is directly connected to the system hydration and thus the dynamic behavior. Generally, a high grafting density is desirable to achieve complete coverage and improved biocompatibility.12,13 For this reason, PEG is commonly modified to increase its reactivity toward the nanoparticle surface. Gold nanoparticles are decorated preferentially with thiol-containing PEG.14−16 Metal oxides nanoparticles (SiO2, Fe3O4, and TiO2) can be easily functionalized with PEG molecules terminated with different end groups: silica NPs are generally coated with silane-terminated PEG;17 Fe3O418,19 and TiO220,21 nanoparticles are particularly reactive toward catechol, carboxylic, and phosphonate groups.
The PEG molecular weight (M̅w) is another key factor in determining the features of coated nanoparticles. Long PEG chains with high molecular weight significantly increase the effective size of coated nanoparticles: in some cases, the PEG corona accounts for over 90% of the particle volume. On the other hand, short PEG chains lead to much higher grafting densities.14 Pozzi et al.22 determined that PEG with M̅w = 2000 g mol–1 is the best candidate for liposome nanoparticle PEGylation, providing a balanced compromise between anti-opsonization and efficient uptake. Xue et al.23 demonstrated that iron oxide nanoparticles coated with PEG chains of sufficiently high M̅w (5000 g mol–1) have an increased half-life time in the circulatory system.
From a computational point of view, surface functionalization of TiO2 with PEG was studied for a periodic slab model of a flat surface.24 Modeling PEGylated NPs, in general, and TiO2 NPs, in particular, is a much more complex task and requires large realistic models and sophisticated tools. Studies on spherical PEG brushes based on Monte Carlo or coarse-grained molecular dynamics (MD) approaches are reported in the literature.25,26 Behavior of PEGylated gold nanoparticles in an aqueous medium was simulated by coarse-grained or all-atom MD.27,28 Classical MD was exploited both in the study of poly(methyl methacrylate) (PMMA)-grafted SiO2 nanoparticles and SiO2 nano-objects immersed in a polymeric (PEG) medium.29,30 Binding of different polymers (including PEG) on an Fe3O4 (111) flat surface and surfactant agents and drugs on Fe3O4 nanoparticles were investigated by classical molecular dynamics.31−33 To the best of our knowledge, no computational studies exist on PEGylated TiO2 crystalline anatase nanoparticles.
Characterization of the polymer corona around an inorganic core is fundamental to understand the features of the nanocomposite and design a tailored synthetic route for specific properties. For example, helical or amorphous PEG chains repel proteins, whereas when in the all-trans form, they attract them, probably due to different hydration levels.34 In the pioneering works on flat surfaces by de Gennes35 and Alexander,36 it was reported that, at a low grafting density, the mushroom conformation, where the polymer is unperturbed and coiled, is preferred, while at a very high density, the brush conformation, where the coil is stretched along linear chains, becomes predominant. In general, the assignment is based in terms of Flory radius (RF), which is the mean end-to-end distance of a polymer: if the mean distance (Dm) between polymers anchored to the surface is higher than RF (Dm > RF), then a mushroom conformation is assigned; if Dm < RF, then the polymers will assume a brush conformation. This kind of simplified model has been used for years to define polymer shell structures.37−41 More recently, it has been further refined by Labouta et al.42 according to the following scheme: for RF/Dm < 1, PEG chains assume a mushroom conformation; for 1 < RF/Dm < 2, a brush one; and for RF/Dm > 2, the conformation is of a dense brush.
Daoud and Cotton (DC)43 proposed another model to define the polymer conformation on spherical surfaces according to three different conformational regimes: a central rigid core of constant polymer density (very close to the surface), a concentrated regime where the polymer volume fraction Φ(r) varies linearly from the center of the NP (r–1), and finally the semidiluted regime where Φ(r) varies as r–4/3. During the years, the DC model has been extended and tested with computer simulations.44−46 In particular, Ohno et al.47 postulated the existence of a critical radius in sufficiently dense polymer shells, which divides a concentrated polymer brush region (CPB) from a semidiluted polymer brush region (SDPB). A recent experiment based on small-angle neutron scattering (SANS),16,48 small-angle X-ray scattering (SAXS),49 and dynamic light scattering (DLS) of monodisperse nanoparticles46,47 showed that, for both polymer-grafted gold and iron oxide NPs, the DC model and its extensions give a correct description of the polymer corona size and conformation. SANS and SAXS are complex and costly techniques, and DLS gives reasonable results only for very stable and monodisperse nanoparticles. For these reasons, no experimental study was so far performed on PEGylated TiO2 nanoparticles.
In this work, we combine experiments and theory to get atomistic insight into the metal-oxide NP/PEG/solvent interactions with the final aim to develop a preparation protocol for TiO2-based spherical brushes with the desired coverage and shell conformation. First, we compare the radius of gyration, which is an indicator of the degree of coiling, for a free PEG chain in water from experiments (by DLS measurements) and calculations (classical molecular dynamics simulations) to assess the quality of our computational setup. Then, we investigate the role of the linker type (−OH, −COOH, and −PO(OH)2) in the grafting process using monomer or low M̅w PEG chains and comparing the experimental results with the corresponding quantum chemical calculations for the adsorption of PEG monomers on a 2.2 nm TiO2 spherical NP model (with the density functional tight binding method, see Section 2.2). As a further step, we discriminate between different PEG corona conformations, comparing 13C NMR results with a dihedral angle analysis of spherical brushes from classical MD simulations. Our work provides indications on how to optimize the polymer grafting density on the TiO2 NPs and points out the limits of the accepted theories mentioned above for the polymer conformation definition.
The paper is organized as follows: in Section 2, we report the experimental (Section 2.1) and computational (Section 2.2) details, and in Section 3, we present the experimental results (Section 3.1) and the theoretical simulation (Section 3.2). Finally, in Section 4, we summarize and discuss the results, and in Section 5, we draw relevant conclusions on the role of the linker and molecular weight of the polymer on the grafting density and conformation of the PEG corona around TiO2 curved nanoparticles.
2. Experimental and Computational Details
2.1. Experimental Details
2.1.1. Materials and Synthesis
2.1.1.1. General Considerations
Synthesis of anatase TiO2 nanocrystals was performed with the solvothermal method described previously50 and further exemplified in Section S1.1 of the Supporting Information, where the reagents are also detailed. The resulting particles were initially capped with oleic acid (OLAC) and dispersed in hexane. Then, ligands were stripped following the procedure published before.51,52 Here, we only detail the preparation of the ligands and the grafting step.
2.1.1.2. mPEG-Succinic Acid and 4-(2-Methoxyethoxy)-4-oxobutanoic Acid
2-Methoxyethanol and mPEG of different molecular weights were modified with the same procedure;53 we report an example for PEG with M̅w = 5000 g mol–1 (PEG5000). Typically, 0.5 mmol of mPEG (polyethylene glycol monomethyl ether) was added and dissolved in anhydrous dioxane along with triethylamine (TEA) in a round-bottom flask. A solution of 4-dimethylaminopyridine (DMAP, 1 equiv) and succinic anhydride (1.2 equiv) in dioxane was slowly added to the mPEG solution. Then, the reaction was stirred for 24 h at room temperature and in a controlled N2 atmosphere. The solvent was dried in vacuum, and the crude product was precipitated three times in diethyl ether and three times in ethanol (yield 81%). 1H NMR (500 MHz, CDCl3): δ 4.27–4.24 ppm (t, 2H, −CH2CH2OCO), 3.9–3.3 ppm (m, 4H, −CH2CH2– PEG chain), 3.37 ppm (s, 3H, −OCH3), 2.7–2.5 ppm (m, 4H, −CH2CH2-CO(OH)).
2.1.1.3. mPEG-Phosphate and 2-Methoxyethanol 1-Phosphate
2-Methoxyethanol and mPEG of different molecular weights (M̅w = 44, 500, 2000, 5000, 10,000, and 20,000 g mol–1) were modified with the same procedure.18 We report an example for mPEG500: 0.5 mmol of mPEG was dissolved in dry dichloromethane (DCM) and added dropwise to a solution of phosphoryl chloride (POCl3, 1.2 equiv) and TEA (2.4 equiv) in an ice bath. The reaction was slowly brought to room temperature and then stirred for 24 h. Then, 5 mL of deionized water was slowly added to the mixture and left to react for 1 h. The solvent was removed in vacuum, and the crude product was dissolved in DCM and extracted, once with acidic water (HCl, 0.2 mM) and then three times with saturated brine. The organic phase was collected and dried over MgSO3, filtered, and precipitated three times in diethyl ether. 1H NMR (500 MHz, CDCl3): δ 4.12 ppm (m, 2H, CH2CH2–O–P), 3.62 ppm (m, 454H, −CH2CH2– PEG chain), 3.34 ppm (s, 3H, −OCH3). 31P NMR (500 MHz, CDCl3): δ 2.01 ppm (s, 1P, OP(OH)2).
2.1.1.4. Grafting-to of mPEG Derivatives on Anatase Nanocrystals
The decoration of the crystalline NPs was done with a grafting-to approach using functionalized mPEG of different molecular weights. A precise amount of the mPEG-functionalized polymer was dissolved in water and diluted to a concentration of 4 mM. The stripped crystalline anatase NPs, in the form of a powder, were added in the solution, and the mixture was sonicated for 10 min. Once the dispersion became homogeneous, the solution was stirred in different experimental conditions. A set of grafting experiments was carried at room temperature in water, while a second set of experiments was carried in DCM at reflux conditions. The product was then purified by centrifugation three times with DCM and dried in vacuum at 60 °C overnight.
2.1.2. Characterization
The hydrodynamic diameter and size distributions of the particles were determined by dynamic light scattering (DLS) in deionized water and DCM (0.1 mg mL–1). Measurements were performed at 25 °C on a Malvern Zetasizer equipped with a continuous wave 1 mW He–Ne laser operating at 632.8 nm and an avalanche photodiode detector, Q.E. > 50% at 633 nm, placed at 173° with respect to the incident beam. The reported data were the average of at least three different measurements of the size distribution as the function of the intensity.
Colloid stability was evaluated with ζ-potential analysis; the measure was taken at 25 °C in deionized water, with a sample concentration of 0.1 mg mL–1 and using a Malvern Zetasizer instrument (see Table S1).
Nitrogen adsorption–desorption isotherms were measured at liquid nitrogen temperature using an ASAP 2010 analyzer (Micro-metrics). The samples were outgassed for 12 h at 473 K. The surface area was calculated using the Brunauer–Emmett–Teller (BET) model.54 For X-ray characterization, a D8 Advance powder diffractometer (Bruker) was used with Cu Kα1 radiation (λ = 1.5418 Å) and a secondary-beam monochromator. The powder was added on a quartz sample holder and measured.
The amount and definition of the tethered ligand on the NP surface was verified with attenuated total reflection (ATR)–FTIR and thermogravimetric analysis (TGA).
Fourier transform infrared (FTIR) characterization was performed using a PerkinElmer Spectrum 100 instrument scanning from 650 to 4000 cm–1 with a resolution of 4 cm–1 for 64 scans. The sample, in the form of a powder, was added on the sample holder and directly analyzed over the Si crystal with the Universal ATR (UATR).
TGA was carried out with a Mettler Toledo TGA/DSC1 STARe System at a constant gas flow (50 cm3 min–1). The thermal profile is the following: 25 °C for 5 min (air); 25–800 °C with a rate 10 °C min–1 (air).
Thermal properties were determined by differential scanning calorimetry (DSC) using a Mettler Toledo DSC 1 instrument with a heating and cooling rate of 20 or 10 °C min–1 under nitrogen gas flow (80 mL min–1).
1H, 31P, and 13C NMR spectra were recorded using a Bruker AMX-500 spectrometer operating at 500 MHz. Samples were dissolved in deuterated water using standard 5 mm NMR tubes.
2.2. Computational Details
2.2.1. Models and Methods
All the molecular dynamics (MD) calculations were carried out with the AMBER16 simulation package.55 The simulations were performed with periodic boundary conditions in all directions and with an integration time step of 0.5 fs. The systems were initially subject to a minimization of 50,000 steps, then they were heated up to the target temperature of 300 K for 500 ps using a Langevin thermostat (γ = 1 ps–1).56 Finally, after 5 ns of equilibration, the production run was performed for 25 ns in the NVT ensemble.
For water, the TIP3P57 model was used, while for TiO2, a simplified version of the Matsui–Akaogi force field58 as reported by Luan et al.59 To describe polyethylene PEG, we generated a Generalized Amber Force Field (GAFF).60
For all the geometry optimization and adsorption energy evaluation, we used the SCC-DFTB approach61 as implemented in the DFTB+ open-source code.62 DFTB is an approximated DFT-based method, which allows to keep a quantum accuracy at an extremely reduced computational cost. Further information about this method can be found in refs (63) and (64). In this work, we employed the MATORG+HBD set of parameters we developed previously65 using a threshold of 10–6 charge atomic unit (au) for the self-consistent charge (SCC) procedure and 10–4 au for the maximum forces in the geometry relaxation. Long-range van der Waals interactions were taken into account with the inclusion of the semiempirical dispersion correction proposed by Grimme (DFTB-D3).66
The anatase TiO2 spherical nanocrystal model used throughout this work was designed through global optimization with a simulated annealing process at the DFTB level of theory and, successively, optimized with a hybrid density functional (DFT-B3LYP) in a previous work by some of us.67 The stoichiometry of the model is (TiO2)223·10H2O, and it is characterized by an equivalent diameter of 2.2 nm (see Figure S3).
The PEG chain used in the MD simulations is a methoxy-PEG, H3C–[OCH2CH2]n–OH, with n = 11 for a total molecular weight (M̅w) of 516 g mol–1 (we will refer to this model as mPEG500). To functionalize the TiO2 spherical nanocrystal, the chains were first bonded to the 4-fold coordinated Ti atoms of the surface, which we have recently reported68 to be the most reactive one, and then to the 5-fold coordinated Ti atoms, which allowed for the most symmetric and thus most equal distribution of the chains on the NP surface. We considered seven different coverage densities for the mPEG500@NP system in water: σ = 0.225, 0.440, 0.676, 0.901, 1.126, 1.351, and 2.252 chain/nm2 (see Figure 7 for a graphical representation and the stoichiometry and Table S2 for details on the models). The systems were immersed in 6 nm3 (free mPEG500) and 10 nm3 (mPEG500@NP) water boxes with densities of about 1.00 g/cm3.
Figure 7.

Final MD snapshot for the mPEG500@NP systems at different coverages (σ in chain/nm2) in water, with the respective stoichiometry. Titanium, oxygen, carbon, and hydrogen atoms are in cyan, red, green, and white, respectively. The water medium is not shown.
In the case of the quantum chemical binding energy evaluation of water on the nanocrystal surface, we considered one, two, or three molecules of water molecularly (H2O) or dissociatively (OH,H) adsorbed on the undercoordinated surface Ti atoms according to what we have calculated on a previous study of some of us (see Figure S4 and Table S3).68 Regarding the mPEG monomer adsorption, we took into account the same molecules used in the experiments, with three different terminal linkers (see Figure S5): the hydroxyl group mPEG-OH (2-methoxyethanol), the carboxylic group mPEG-COOH (4-(2-methoxyethoxy)-4-oxobutanoic acid), and the phosphonate group PEG-PO(OH)2 (2-methoxyethanol 1-phosphate).
More information on all the methods and models used in this work can be found in Section S2.1 of the Supporting Information.
2.2.2. MD Analysis Indicators and mPEG Monomer Adsorption
During the MD simulations in water, different quantities were evaluated to understand the mPEG500/NP/water interaction and mPEG500 conformation and for comparison with the experiments. A detailed description of how these indicators were obtained is reported in Section S2.2 of the Supporting Information; however, in the following, we briefly report on them. All the values were averaged between 2000 configurations collected every 2.5 ps during the last 5 ns of the production run. In the case of the free mPEG500, we increased the statistics performing three different production runs. The quantities calculated are as follows:
-
1.
Radius of gyration (Rg): root-mean-square distance between each atom in the mPEG500 molecule and the center of mass of the molecule itself, normalized for the number of monomer considered.
-
2.
End-to-end distance (⟨h2⟩1/2): distance between the first and the last heavy atom (oxygen of the −OH head and carbon of the −CH3 tail) of the mPEG500 chain.
-
3.
Mean distance from the surface (MDFS): average distance of the center of mass of each mPEG500 chain grafted to the NP and the closest Ti atom of the surface.
-
4.
OCCO dihedral angle distribution: distribution of the values of all the OCCO dihedral angles for all mPEG500 considered. For the free mPEG500, the distribution is reported in Figure S6.
-
5.
OCCO dihedral angle index (DAI): integral of the OCCO dihedral distribution after the removal of dihedral angles between ±90°. High DAI values indicate numerous trans dihedrals in the polymer chains.
-
6.
H-bonds: average number of hydrogen bonds (per monomer) between water and the O atoms of the mPEG500 chains.
-
7.
mPEG500 volume fraction (Φ(r)): volume fraction of mPEG500 calculated for the last 100 snapshots of the MD simulations using spherical layers of 0.09 nm starting from the center of the NP. For each CH2 unit and O atom of mPEG, we used a volume of 0.02 nm3, for water of 0.03 nm3.
Regarding the binding of the mPEG monomers, we took into account different kinds of adsorption for each molecule. The adsorption sites on the NP curved surface are 4-fold, 5-fold, and hydroxylated Ti atoms (see Figures S3 and S4). Also, undercoordinated superficial O atoms take part to the adsorption process, accepting the proton coming from the −OH dissociation or establishing an H-bond with the remaining −OH groups of the carboxylic or phosphonate linker. The mPEG-OH monomer allows only for a monodentate adsorption mode, the mPEG-COOH monomer for a monodentate, bidentate chelated, and bidentate bridging, while the mPEG-PO(OH)2 monomer for monodentate, bidentate, and tridentate ones (see Figure S7). In all cases, the adsorption was considered to form covalent bonds, while the remaining −OH groups (for mPEG-COOH and mPEG-PO(OH)2) can or cannot undergo a proton transfer to the closest undercoordinated O atoms of the nanoparticle surface. A total of 68 geometry optimizations were performed.
The adsorption energy (ΔEads) of the monomers was compared to the adsorption energy of one, two, or three water molecules (ΔEadswat) for monodentate, bidentate, and tridentate mPEG adsorption modes, respectively. The energy lost in removing water from the NP surface was subtracted to that gained in adsorbing the monomer in order to give the “so-called” competition energy: ΔEads = ΔEads – ΔEadswat. Also, in the case of water adsorption, a total of 68 geometry optimizations were performed.
From the single monomer adsorption, we devised an hypothetical “full coverage” for every linker considered (−OH, −COOH, and −PO(OH)2) as follows: (i) we considered the most stable single monomer configurations according to their adsorption energy; (ii) each site of the nanoparticle can be occupied only once; and (iii) we always tried to achieve the maximum coverage possible. On the basis of the three points just reported, the adsorption energies of the single monomers were properly taken into account and weighted to give an average binding energy per molecule in the full coverage regime (ΔEadsfull). Following the same criteria, we also calculated the competition energy for the full coverage regime (ΔEads). It is important to underline that the full coverage has not been modeled, but we only hypothesized averaged adsorption energies on the basis of the results for the single monomers. Therefore, the binding energy values per molecule reported do not take into account the interaction between different mPEG monomers.
More details on the adsorption modes, adsorption energies, and full coverage design can be found in Section S2.3 of the Supporting Information.
3. Results
In the next sections, we first present the experimental results (Section 3.1) on free methoxy-PEG (mPEG) chains in water, how the chemical nature of the linker influences the grafting of mPEG monomers on the TiO2 nanocrystals surface, the adsorption of mPEG at increasing molecular weight, and then the conformational analysis of the mPEG shell using NMR techniques. Then, in Section 3.2, we present the analysis of the computational results on a single free mPEG500 chain (M̅w = 500 g mol–1) in water, the chemical role of the linker on the monomers adsorption, the grafting density (at different coverage regimes, from σ = 0.225 to 2.252 chain/nm2), and finally the conformation of the various mPEG500@NP model systems considered in this study.
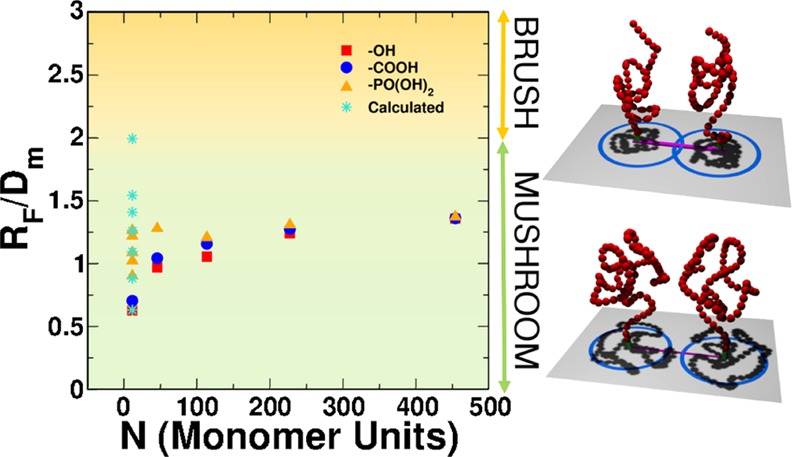
Figure 1 presents an overview of the samples investigated in this work with reference to their RF/Dm value, which was defined in Section 1. The color shading of the plot background refers to the three conformational regimes in the simplified model proposed by Labouta et al.:42RF/Dm < 1, mushroom; 1 < RF/Dm < 2, brush; RF/Dm > 2, dense brush. In the experiments, we varied the M̅w of the grafted mPEG (along the x axis) and the type of terminal linker (square, circle, and triangle symbols in the figure) and increased the grafting density, which we report on the y axis in terms of the RF/Dm value. In the theoretical simulations (star points in Figure 1), we could not increase the M̅w along the x axis due to the computational cost, but we could investigate very high grafting densities (y axis), higher than those experimentally obtained. In this way, we have an interesting overlap of the experimental and computational results at low M̅w and low grafting density, but we may also explore other parts of the plot, which would be not accessible to one or the other approach and thus get a broader complementary overview.
Figure 1.

Plot of the RF/Dm ratio as a function of the number of monomer units present in the mPEG chains. Red squares, blue circles, and yellow triangles refer to −OH-terminated, −COOH-terminated, and −PO(OH)2-terminated mPEG chains, respectively, used in the experiments, whereas turquoise stars refer to the theoretical models. The color shading in the background identifies the three different conformational regimes from the model by Labouta et al.:42RF/Dm < 1, mushroom (green); 1 < RF/Dm < 2, brush (yellow); RF/Dm > 2, dense brush (red). On the right, 3D sketches representing the conformation of the polymers in the different regimes are shown.
Later in the paper, we will also discuss an experimental protocol to push the grafting density at higher values along the y axis (leftmost triangles in Figure 1) and for a larger overlap with the computational results. This comparison will be fundamental to demonstrate that the conformational study of the polymer corona is more complicated than that predicted in the simplified model proposed by Labouta et al.42 and used in Figure 1 to define the mushroom/brush/dense brush regimes.
3.1. Experimental Section
3.1.1. Free mPEG in Water
The size of polymer coils scales as the Flory radius, RF = aNv, where a represents the monomer length (0.35 nm), N is the number of monomer units, and v is the Flory exponent.69 This exponent depends on the polymer–solvent interaction: in a theta solvent, v is equal to 1/2, while in a good solvent, v is equal to is 3/5. In order to confirm that the system under study (i.e., mPEG) presents an analogous behavior, in line with what was reported by Linegar,70 we used the DLS analysis to measure the hydrodynamic radius (Rh) of each polymer. Each DLS experiment was performed at least three times to verify the reproducibility. Considering that Rh = 0.64 Rg, we can derive the radius of gyration (Rg). We assume that Rg is comparable to RF/2, since the Flory model describes the size of a polymer dissolved in a good solvent. The Rg values calculated from DLS are reported in Table 1 and Figure S1. The experimental data are then (well) fitted using an allometric function (y = axb), leading to constants that are, within error, in good agreement with the predicted RF values (see Table 2). On this basis, we can state that the polymer behaves as an ideal random coil dissolved in a good solvent (b = 3/5 as v) and that the Flory equation can be used to calculate the theoretical size of the polymer chains.
Table 1. Results from the DLS Analysis Conducted at 25 °C in Watera.
| water |
|||
|---|---|---|---|
| N (monomer unit) | RF/2 (nm) | Rg (nm) | std. dev. (nm) |
| 11 | 0.8 | 0.9 | 0.1 |
| 45 | 1.7 | 2.3 | 0.2 |
| 114 | 3.0 | 4.3 | 0.3 |
| 227 | 4.5 | 5.0 | 0.2 |
| 455 | 6.9 | 7.2 | 0.4 |
RF/2 represents half of the Flory radius, and Rg is the radius of gyration extrapolated by the Rh value.
Table 2. Fitting Constant of the Allometric Function (y = axb) Used To Fit the DLS Experimental Data.
|
a |
b |
|||
|---|---|---|---|---|
| sample | value | std. dev. | value | std. dev. |
| theoretical RF/2 | 0.175 | 0.600 | ||
| measured Rg water | 0.241 | 0.0865 | 0.562 | 0.045 |
3.1.2. Effect of Different Linkers on the mPEG Monomer Adsorption
Anatase spherical nanocrystals with sharply defined diameter were synthetized and stripped from the oleic acid capping agent following the procedure described in a previous work52 and detailed again in Section S1.1. This step is necessary to avoid any competing effect due to the presence of other chemical species. The tethering efficacy of selected anchoring groups was evaluated through grafting-to of end-functionalized single monomer units. The use of small molecules reduces the entropic effects related to the presence of large polymer chains. These experiments were performed at a fixed time and polymer molar concentration using deionized water as a solvent. Each reaction was conducted for 72 h in order to avoid kinetic effects.
After particle purification, the efficacy of the grafting process was verified through FTIR spectroscopy (Figure 2a), which proves the organic compound covalent attachment to the surface through comparison of the registered spectrum with the characteristic vibrational peaks of the 2-methoxyethanol-grafted nanocrystals. Between 2900 and 3050 cm–1, we can find the peaks related to the stretching of the CH2 groups and the methyl group covered by the large peak of the hydroxyl group of the titanium dioxide NPs (black line in Figure 2a). In the region between 2000 and 1000 cm–1, the spectra of the grafted NPs are similar, except the case of 2-methoxyethanol 1-phosphate (yellow line, −PO(OH)2) in which we see a weak signal at 1060 cm–1 assigned to the P–O vibrational peak. It is possible to detect two distinctive peaks at 1650 and 1570 cm–1 related to the succinic moiety carried by 4-(2-methoxyethoxy)-4-oxobutanoic acid (blue line, −COOH).
Figure 2.

(a) FTIR spectra of the grafted crystalline anatase NPs, in the same experimental condition, with modified ethylene oxide monomers: yellow line, −PO(OH)2; blue line, −COOH; red line, −OH. (b) Example of TGA of single monomer units functionalized with −PO(OH)2 (yellow line), −COOH (blue line), and −OH (red line) grafted on anatase NPs. The weight loss between 150 and 750 °C is used to assess the coverage.
The number of grafted molecules was established by analyzing the TGA traces, exemplified in Figure 2b for the three ligands and different end groups. After mass normalization, the number of grafted chains is calculated using eq 1:
| 1 |
where Wloss% represents the weight loss percentage from the thermogravimetric analysis in the range between 150 and 750 °C, M̅wmolecule is the molecular weight of the grafted molecule, and Na is the Avogadro’s number.
Knowing the specific surface area (SSA), provided by BET measurements, which were shown to agree with transmission electron microscopy (TEM) for similar systems,52 the coverage density σ can be easily calculated using eq 2
| 2 |
The results are reported in Table 3. It is clear that the largest number of organic molecules are grafted though the hydroxyl end group, followed by the carboxylic end group, and finally by the phosphonate end group. What drives the tethering process is probably the size of the anchoring group.
Table 3. Grafting Densities (chain/nm2) of the Different Monomers Considereda.
| σ |
|||||
|---|---|---|---|---|---|
| sample | linker | M̅w (g mol–1) | Wloss (%) | molecules/nm2 | std. err. |
| 2-methoxyethanol | –OH | 76 | 5.21 | 2.50 | 0.04 |
| 4-(2-methoxyethoxy)-4-oxobutanoic acid | –COOH | 176 | 8.25 | 1.76 | 0.03 |
| 2-methoxyethanol 1-phosphate | –PO(OH)2 | 156 | 6.46 | 1.53 | 0.03 |
The molecular weight and weight loss from TGA are also reported for each sample.
3.1.3. Effect of Different Linkers at Increasing M̅w Adsorption
The NPs were then grafted with different mPEG chains (M̅w: 44, 500, 2000, 5000, 10,000, and 20,000 g mol–1) and the respective phosphonate and succinic acid derivatives. By infrared spectroscopy, we proved the presence of the covalently attached polymer on the surface through comparison between the characteristic vibrational peaks of the mPEG chains and those of the polymer-grafted nanocrystals as shown in Figure S2a of the Supporting Information.
As discussed in the previous section, the amount of the grafted polymer was established by analyzing the TGA traces, exemplified in Figure S2b for the three ligands with M̅w = 500 g mol–1 and different end groups.
In order to relate the amount of the grafted polymer with the expected conformation, we assume that a single grafted chain acts as a non-interacting rigid sphere tethered on the surface in a single point. In these conditions, it is possible to calculate an experimental mean distance (Dm), deduced by TGA and BET analysis following eq 3:
| 3 |
where Σ represents the footprint of the chain grafted on the surface, which is experimentally evaluated by eq 4:
| 4 |
where σexp is the experimental grafting density calculated using eq 2. All the various steps are displayed in Table 4, together with the respective Flory radius (RF). Theoretical RF values used to determine the RF/Dm ratio are close to the experimental data provided by the radius of gyration derived from the hydrodynamic radius obtained with DLS analysis. Data in Table 4 was used to plot the dependence of the grafting density σ, the footprint Σ, and the mean distance Dm with the number of monomer units in Figure S8 for a graphical presentation of the results.
Table 4. List of the Experiments Conducted for This Worka.
| σ |
Σ |
Dm |
||||||||
|---|---|---|---|---|---|---|---|---|---|---|
| sample | N (monomer unit) | Wloss (%) | chain/nm2 | std. err. | nm2/chain | std. err. | nm | std. err. | RF (nm) | conformation |
| PEG500-OH | 11 | 3.1 | 0.2206 | 0.0330 | 4.53 | 0.68 | 2.4 | 0.36 | 1.5 | mushroom |
| PEG2000-OH | 45 | 5.5 | 0.1000 | 0.0020 | 10.00 | 0.20 | 3.6 | 0.07 | 3.5 | mushroom |
| PEG5000-OH | 114 | 5.4 | 0.0396 | 0.0010 | 25.28 | 0.64 | 5.7 | 0.31 | 6.0 | mushroom |
| PEG10000-OH | 227 | 6.4 | 0.0238 | 0.0006 | 42.09 | 1.06 | 7.3 | 0.18 | 9.1 | brush |
| PEG20000-OH | 455 | 6.7 | 0.0124 | 0.0003 | 80.39 | 1.94 | 10.1 | 0.24 | 13.8 | brush |
| PEG500-COOH | 11 | 3.9 | 0.2787 | 0.0093 | 3.59 | 0.12 | 2.1 | 0.07 | 1.5 | mushroom |
| PEG2000-COOH | 45 | 6.3 | 0.1157 | 0.0030 | 8.64 | 0.22 | 3.3 | 0.21 | 3.5 | mushroom |
| PEG5000-COOH | 114 | 6.4 | 0.0476 | 0.0010 | 21.03 | 0.44 | 5.2 | 0.11 | 6.0 | brush |
| PEG10000-COOH | 227 | 6.8 | 0.0251 | 0.0006 | 39.81 | 0.95 | 7.1 | 0.17 | 9.1 | brush |
| PEG20000-COOH | 455 | 6.7 | 0.0125 | 0.0003 | 80.06 | 1.92 | 10.1 | 0.24 | 13.8 | brush |
| PEG500-PO(OH)2 | 11 | 6.2 | 0.4567 | 0.0230 | 2.19 | 0.11 | 1.7 | 0.08 | 1.5 | mushroom |
| PEG2000-PO(OH)2 | 45 | 9.2 | 0.1747 | 0.0190 | 5.72 | 0.62 | 2.7 | 0.29 | 3.5 | brush |
| PEG5000-PO(OH)2 | 114 | 7.0 | 0.0518 | 0.0073 | 19.29 | 2.72 | 5.0 | 0.70 | 6.0 | brush |
| PEG10000-PO(OH)2 | 227 | 7.1 | 0.0265 | 0.0013 | 37.75 | 1.85 | 6.9 | 0.34 | 9.1 | brush |
| PEG20000-PO(OH)2 | 455 | 6.9 | 0.0127 | 0.0003 | 78.74 | 1.86 | 10.0 | 0.24 | 13.8 | brush |
Each experiment is conducted in water at 25 °C with [mPEG] = 6.7 M. Each line corresponds to at least three experiments, all the values corresponds to the arithmetic mean of each experiment with its standard deviation. The grafting density σ is calculated following eq 2, Σ is the footprint of a single chain and calculated following eq 4, Dm corresponds to the mean distance evaluated using eq 3, RF represents the Flory radius, and the conformation is deduced using the method illustrated in the main text.
As reported by Labouta et al.,42 the ratio between the Flory dimension and the average distance between adjacent mPEG chains (RF/Dm) can be used as an indicator for mPEG conformation: values below 1.0 indicate a mushroom regime, while those above 1.0 indicate brush. As RF/Dm approaches zero, interchain interactions become more and more scarce, and areas of bare particle between mPEG chains begin to dominate the particle surface. On the other hand, RF/Dm values equal to or larger than 2.0 represent denser brush configurations.
We used this guideline to construct the rightmost column of Table 4, but, for visual effectiveness, in Figure 3, we inserted the experimental data within a map of the different predicted regimes (mushroom, brush, and dense brush) as a function of the RF/Dm ratio and the monomer units (N).
Figure 3.
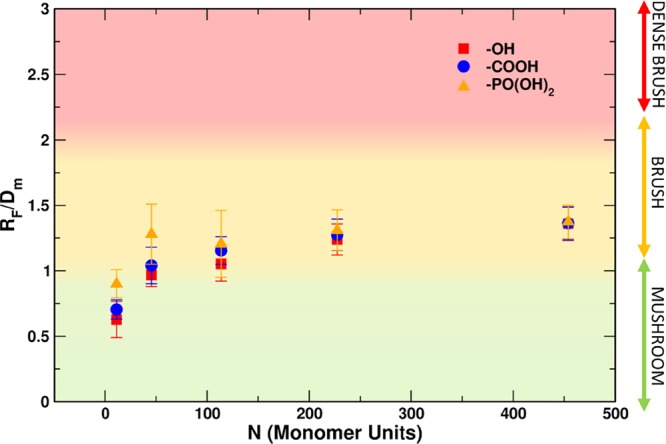
Plot ratio of RF/Dm as a function of the number of monomer units in the mPEG chains. Three sets of samples were synthesized in deionized water. Red squares, blue circles, and yellow triangles refer to −OH-terminated, −COOH-terminated, −PO(OH)2-terminated mPEG chains, respectively, as obtained from the experiments. The color shading in the plot refers to the different conformational regimes as identified by the simplistic model: RF/Dm < 1, mushroom (green); 1 < RF/Dm < 2 brush (yellow); RF/Dm > 2, dense brush (red).
It is observed that, at a high molecular weight, all the data converge to the same value of RF/Dm. At a lower molecular weight, the anchoring group plays a key role. In fact, the absolute mass of OH-functionalized short chains can be as low as 3%, less than half the corresponding PO(OH)2 derivatized polymer. It is reported in the literature that the best anchoring group for titanium dioxide surfaces are the phosphor end-group class of molecules71−74 (phosphonic acids, phosphoesters, phosphonate, etc.) followed by carboxylate end groups (maleate, carboxylic acid, anhydride, etc.) and hydroxyl groups. In general, all the classes of molecules can bind the highly reactive titanium dioxide nanoparticle surface, because it presents several undercoordinated titanium sites. We can calculate the grafting density (σ) and compare the grafting behavior of the different polymers. If we plot the σ versus the number of monomer units (N) in a double log axis (see Figure 4), then it is possible to appreciate and better understand the grafting behavior of the different sets of samples as a function of their end groups. Data points can be linearly fitted. The slopes obtained increase, indicating an increasing impact of the end group on the grafting reaction, going from mPEG-OH to mPEG-COOH and finally mPEG-PO(OH)2. With the proper chemical reaction, it is possible to modulate the grafting density.
Figure 4.
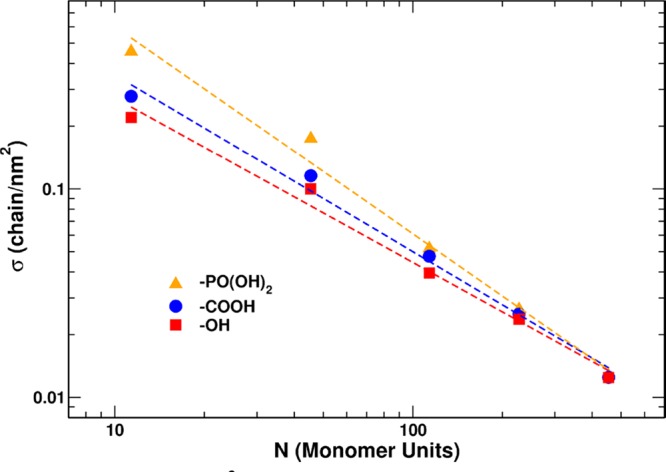
Plot of the grafting density σ (chain/nm2) versus the number of monomer units in the mPEG chains (N) using a double log axis. Experiments conducted in deionized water are represented. Red squares, blue circles, and yellow triangles represent −OH-terminated, −COOH-terminated, and −PO(OH)2-terminated mPEG samples, respectively. The dashed lines represent the best linear fitting of the curves.
Therefore, the role of the anchoring group in the economy of the grafting-to process is particularly relevant, especially at a low molecular weight. Many researchers have exploited this concept to enhance the NP surface chemical reactivity: the surface is first functionalized with a bifunctional linker, with one functional moiety being used for grafting on the surface and the other free to tether another molecule that would not spontaneously bind to the surface. This approach is found to be useful especially with silica nanoparticles (silanization process) that are effectively covered by alkoxysilane groups that bear another reactive group, such as a primary amine, acrylate or methacrylate, aldehyde, etc., that can easily react with a functionalized polymer.75,76
The fundamental reasons of this effect are rooted in the energetics of all interfacial interactions between the three components of the system: NP, polymer, and solvent. Due to the strength of the interaction between water molecules and titanium oxide NPs,68,77 there is an effective competition between water and the anchoring group of the polymer chains. Another interaction ought to be considered is the one between the polymer chain and the NP surface. It is known that polyethylene oxide interacts with the titanium dioxide NPs surface,24,78 minimizing its high surface energy. It should be noted that the polymers used have a chain size comparable or even larger than the anatase NPs. The experimental data shows that, at a high molecular weight, few polymer chains are necessary to effectively passivate the anatase surface: it appears that the ethylene oxide monomer units interact with the titanium dioxide surface and lower the surface energy. Still, results seem to indicate that dense brushes are basically unattainable in these conditions.
3.1.4. Increased Coverage of mPEG500@NP Samples
To investigate denser coverages, we varied the experimental conditions of the grafting-to process to obtain different samples for comparison. For instance, we performed a set of reactions at higher temperatures and higher starting molar concentrations. This requires a different reaction environment, since mPEG tends to separate from water at high temperatures.79 A first attempt was made using 500 g mol–1 mPEG functionalized with the phosphonate group in dichloromethane (DCM) at a reflux temperature of 42 °C, constantly increasing the starting molar concentration of the polymer reagent. The sum of these factors should improve the number of chains grafted on the NP, particularly because a higher temperature enhances the mobility of the mPEG chain, providing the necessary energy to achieve less favored stretched conformations. Additionally, increasing the concentration of the polymer in solution leads to a higher probability of a chain to stick on to the anatase surface.
In Figure 5, in line with a previous study,17 there is a detectable increase in the grafting density σ (Figure 5a) as the starting concentration of mPEG increases, reaching values that are 55% higher than the starting number of grafted polymers. It is possible to verify the effect of the larger amount of the tethered polymer on its conformation by plotting the RF/Dm ratio (Figure 5b) as a function of the starting molar concentration of the functionalized mPEG (same values as for the leftmost yellow triangles in Figure 1). It is possible to appreciate a shift to higher densities, but not up to the dense brush regime for this relatively low molecular weight (500 g mol–1). Still, these results are encouraging since they provide a tool to get more dense coverage of grafted polymers on TiO2 NPs.
Figure 5.
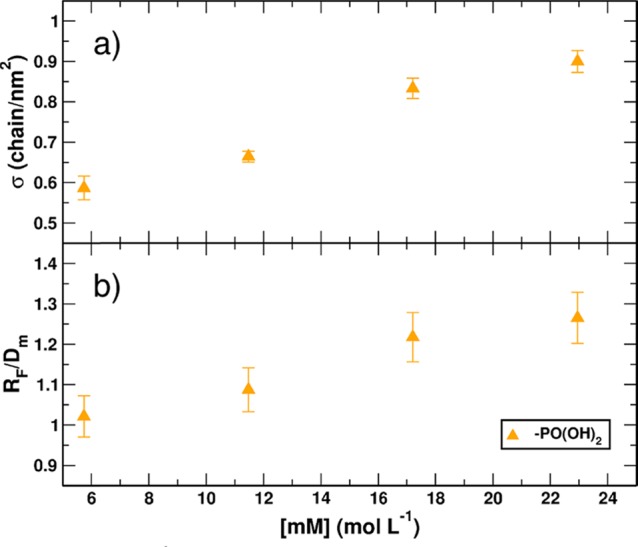
Plotted data of the (a) σ (chain/nm2) and (b) RF/Dm ratio as a function of the starting molar concentration (M). Both plots report data obtained from experiments conducted with phosphonate-terminated 500 g mol–1 mPEG in DCM at 42 °C with constantly increasing molar concentration of the polymer.
3.1.5. NMR Analysis of Free mPEG and mPEG@NP Samples
One of the few tools that can be used to probe the polymer behavior in the native environment (dispersion) is 13C NMR spectroscopy. The chemical shift of polymers in solution depends on the partition between gauche and trans conformation over the experimental time. Another measurable effect of the polymer–surface interaction is the signal linewidth: both the proximity to the surface and the reduction of the chain mobility due to the interaction with nearby chains lower the spin–spin relaxation and thus increase the signal width.52,80,81
In the case of PEG, at given a composition and temperature, the partition between the gauche and trans conformations can be predicted by the Karlström model.79,82 The chemical shift of a theoretical PEG chain for the gauche conformation in water is estimated to be 71.58 ppm, whereas for the trans chain, it resonates at 73.83 ppm. Those values are referenced against HMDS (hexamethyldisilane). Here, we use the resonance of acetone methyl carbons at 30.89 ppm as an internal reference. The values become 69.15 and 71.40, respectively. When mPEG is dissolved in a good or theta solvent, it can have different conformations, ultimately producing a chemical shift given by the weighted average of those of the two conformers.
First, we measured the spectrum of mPEG500 in water, obtaining a single main peak at 70.26 ppm with 4.53 Hz linewidth, surrounded by resonance peaks of the end groups. The peak is reported in detail in Figure 6. Using the values provided by Karlström, this corresponds to about 50% gauche conformations. The spectrum of mPEG5000 is very similar, except for the disappearance of the end groups, which are numerically negligible when the number of ethylene glycol units is increased by a factor of 10.
Figure 6.
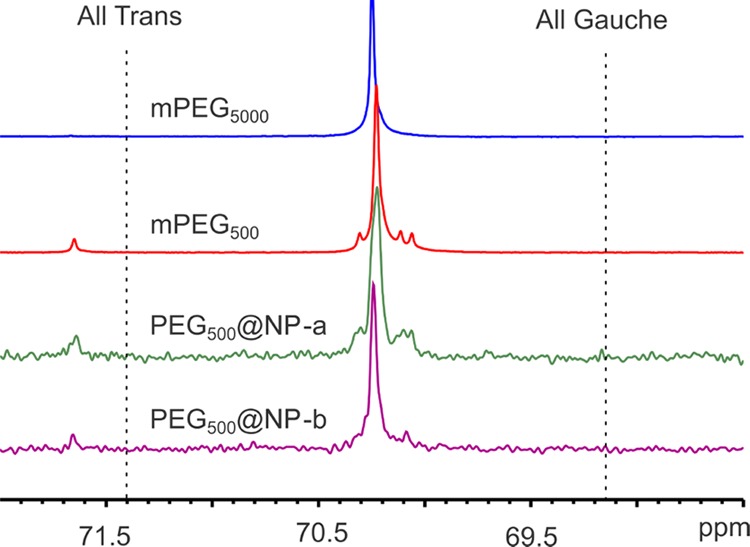
Detail of the 13C NMR solution spectra of, from top to bottom, free polymers mPEG5000 and mPEG500 and the crystalline anatase nanoparticles grafted with mPEG500-PO(OH)2 in water and DCM. All spectra are acquired in deuterated water at 30 °C. Lines corresponding to the theoretical all-trans and all-gauche conformations are also presented.
Then, we measured the NP grafted with the phosphonate derivative of mPEG500 in water (NP-a in Figure 6). This spectrum is much noisier, since the amount of mPEG500 on the surface of the nanocrystal is globally less than the equilibrium concentration of mPEG500 in water. Still, the chemical shift is the same as before, indicating that, locally, the chains have a similar configuration as free mPEG500.
For comparison, the NPs were prepared in DCM with excess mPEG500 phosphonate, RF/Dm around 1.3, and grating density of σ = 0.900 chain/nm2 (rightmost points in Figure 5). Despite possessing a very high coverage, greater than what can be achieved in water, this sample produces a very similar spectrum (NP-b in Figure 6), indicating that, from the dynamical and conformational point of view, the polymer chains can be assimilated to a free polymer dispersion. In turn, this suggests that, up to this coverage, mPEG500 is behaving mostly as a free polymer with just one tethering point and little effect on the conformation or dynamics.
3.2. Computational Section
3.2.1. Free mPEG500 in Water
First, we investigated the conformation of the free mPEG500 chain in water to validate the force fields that we have generated and establish a reference of the ideal behavior for the free polymer in water. The calculated end-to-end distance (⟨h2⟩1/2) and the radius of gyration (Rg) are 1.43 ± 0.40 nm and 0.60 ± 0.08 nm, respectively. These values are in good agreement (see Table S4) with other molecular dynamics simulations for PEG of similar size,83−85 experimental data in the literature obtained from static light scattering (SLS) measurements,86,87 and data from this work reported in Table 1. The average number of H-bonds per monomer is calculated to be 0.99 ± 0.08, which is slightly smaller than 1.08, calculated by Oelmeier et al. for a PEG chain of comparable length.88 This discrepancy might be due to the geometric criteria used to calculate the H-bond number, which are not reported in the reference. Finally, to highlight the dynamic structural changes of the mPEG500 polymer chain in water, we have evaluated the conformation of the molecule considering the variation of each OCCO dihedral angle. The distribution of dihedral angles (reported in Figure S6) is mainly centered around the gauche(−) or gauche(+) configuration, that is, between ±30.00° and ± 90.00°, with a certain number of higher angles values up to ±120.00°. In particular, the distribution is peaked at −70.50° and + 71.50°, in good agreement with both molecular dynamic study,88 where it is reported that a distribution equally peaked at −73.43° and +74.14°, and crystallographic data,89 which indicate −74.95° as a gauche dihedral angle for the PEG molecular crystal.
3.2.2. mPEG Monomer Adsorption on the NP at Low and Full Coverage
The mPEG monomer interacts with the curved NP surface in several different ways depending on the linker used to attach it. In the case of the 2-methoxyethanol molecule (mPEG-OH), the linker is the hydroxyl group, which allows only a monodentate adsorption mode through dissociative adsorption on an undercoordinated Ti atom on the NP surface. In some cases, molecular (only on some 5-fold coordinated Ti atoms) or “upon-condensation” (only on hydroxylated Ti atoms) adsorption has been considered (see Section S2.3 and Figure S7a). For a single mPEG-OH monomer, the ΔEads values in vacuum vary from −1.0 to −2.0 eV, indicating an overall favorable binding of the monomer on the NP surface. However, if we consider the energy we lose upon the substitution of a water molecule with mPEG-OH, which is likely to be a closer situation to the real adsorption process, the values of ΔEadscomp are considerably smaller, between −0.0 and −0.7 eV, indicating a strong water–PEG competition. All the adsorption modes considered for mPEG-OH and relative biding energies are reported in Table S6.
For the 4-(2-methoxyethoxy)-4-oxobutanoic acid molecule (mPEG-COOH), which has a carboxylic group as a linker, the main adsorption modes are monodentate, bidentate chelated, and bidentate bridging (see Figure S7b).90 When monodentate, ΔEads is computed to be slightly higher than for the mPEG-OH case, ranging from −1.0 to −2.5 eV, since the carbonyl group establishes H-bonds with the dissociated proton adsorbed on the surface of the nanoparticle. For both bidentate chelated and bridging case, ΔEads is quite similar and goes from −1.8 to −3.2 eV. When the linker binds in a bidentate fashion to the NP, two molecules of water are replaced; therefore, the loss in energy is quite important, and ΔEadscomp is decreased to −0.0/–0.9 eV. All the adsorption modes considered for mPEG-COOH and relative biding energies are reported in Table S7.
The last case investigated is the −PO(OH)2-terminated mPEG monomer (2-methoxyethanol 1-phosphate molecule). The main adsorption modes are the monodentate, bidentate and tridentate, as suggested also in different studies (see Figure S7c).91,92 In general, the ΔEads values are quite larger with respect to the mPEG-OH and mPEG-COOH cases. In the monodentate case, since the two remaining −OH groups can establish H-bonds with the undercoordinated O atoms of the surface, the monomer ΔEads varies between −1.3 and – 2.6 eV. The bidentate adsorption mode has ΔEads, which varies between −2.0 and – 4.0 eV (the remaining −OH group establishes H-bonds). In the case of the tridentate adsorption mode, ΔEads has a broad range of values. Since the phosphonate group has a trigonal pyramidal geometry, if the adsorption Ti atoms sites are geometrically not well displaced, the ΔEads is only around −1.0 eV, if they are in the correct pattern the binding is very strong and ΔEads reaches values up to −5.0 eV. All the adsorption modes considered for the phosphonate-terminated monomer and relative biding energies are reported in Table S8.
In the experiments, the grafting density of small molecules, bound through the same linkers considered here, is very high;92,93 therefore, to have a more realistic picture, we should cover the NP surface as much as we can. We obtained the ideally highest possible coverage, occupying the undercoordinated Ti atoms, according to the procedure detailed in Section 2.2.2 and Section S2.3. The models conceived for the different linkers allow for the coverage of 76 (mPEG-OH), 78 (mPEG-COOH), and 82 (mPEG-PO(OH)2) Ti superficial atoms, as reported in Table 5. Since there is a total of 100 Ti undercoordinated atoms, which can act as binding sites, the obtained coverage for these models is about 80%. We considered this as full coverage since no additional monomers could be added (according to what was stated in Section 2.2.2 and Section S2.3).
Table 5. Adsorption Energy in Vacuum (ΔEadsfull) and Compared to That in Water (ΔEads) in eV, Coverage Density σ, Number of Molecules, and Number of Ti Adsorption Sites Occupied for the Different Linker mPEG Molecules in the Full Coverage Regimea.
| linker | σ (molecules/nm2) | no. of molecules | no. of occupied sites | ΔEadsfull | ΔEadsfull – comp |
|---|---|---|---|---|---|
| –OH | 3.423 | 76 | 76 | –1.63 | –0.45 |
| –COOH | 2.883 | 64 | 82 (74) | –2.28 | –0.68 |
| –PO(OH)2 | 2.52 | 56 | 82 (78) | –2.44 | –0.84 |
Data reported in parentheses refer to values obtained considering the water competition if they differ from those in vacuum.
In the case of the −OH linker, the average adsorption energy per molecule (ΔEadsfull) at this full coverage is −1.6 eV (Table 5). If we subtract the energy lost by removing the water molecules (ΔEads), then the net adsorption energy decrease to ΔEadsfull – comp = −0.4 eV, which, however, still indicates an exothermic process.
There is a also strong competition with water in the case of the carboxylic group at full coverage (see Table 5) with a decrease in energy of about 1.2 eV. However, for PEG-COOH, both ΔEadsfull and ΔEads are more negative than mPEG-OH, indicating the stronger character of the linker.
For the full coverage of mPEG-PO(OH)2, we computed the most favorable adsorption energy: ΔEadsfull = −2.44 eV in vacuum and ΔEads = −0.84 eV in water (see Table 5). The loss in energy is 1.6 eV.
From what we have seen in this section, we can safely infer that, independently from the linker used, we have the formation of stable adducts. There is a clear trend in the values of both ΔEadsfull and ΔEads: mPEG-PO(OH)2 > mPEG-COOH > mPEG-OH. In addition, the −OH anchoring group is small and binds only in a monodentate fashion, the −COOH group is larger and also has a bidentate binding mode, and the −PO(OH)2 is the largest one and also presents a tridentate adsorption mode. For this reason, the trend of the grafting density (σ) obtained for each monomer type is mPEG-OH > mPEG-COOH > mPEG-PO(OH)2 (see Table 5), in agreement with the experimental data from this work, reported in Table 3, and a previous study where the coverage achieved with phosphonic acid and carboxylic acid on TiO2 nanoparticles was compared.93
3.2.3. Conformational Analysis of PEG500 Polymer Adsorption on the NP (mPEG500@NP) in Water at Increasing Coverage
In this section, we investigate the dynamical behavior of PEG chains around the TiO2 nanocrystal at different coverage regimes, from low (σ = 0.225 chain/nm2) to very high (σ = 2.252 chain/nm2), when the system is immersed in water. The chain distribution on the NP surface was based on the criterion that most binding sites (according to Tables S3 and S6) are first used as anchoring points. Representations of the last MD snapshot for the various grafting densities values are reported in Figure 7. The mean distance from the surface (MDFS) calculated for these systems is essentially constant (see Table S5), in the range between 1.00 ± 0.11 and 0.98 ± 0.03 nm, till a quite high coverage density, σ = 1.351 chain/nm2. This means that the polymers arrange at the same distance from the NP surface independently from the grafting density. Only at σ = 2.252 chain/nm2 that the distance increases to an average value of 1.09 ± 0.01 nm, indicating a possible stretching of the chains.
An important parameter to take into account, when analyzing the dynamic behavior of mPEG in aqueous solutions, is the number of H-bonds per monomer, which is reported in Figure 8a as a function of the grafting density. At a low coverage (σ < 0.5 chain/nm2), the grafted polymers are more hydrated than the free one due to the higher density of water around the NP, which was previously observed.68,94 As the polymer density increases, the surface effect on water is shielded by the presence of mPEG500, and the fraction of volume accessible to the solvent, close to the surface, decreases (see Figure 8b where the volume fraction Φ(r) of mPEG500 is reported as a function of the distance from the NP barycenter). The result is that the number of H-bonds per monomer decreases; particularly for σ > 1.351 chain/nm2, there is a net jump toward low values.
Figure 8.
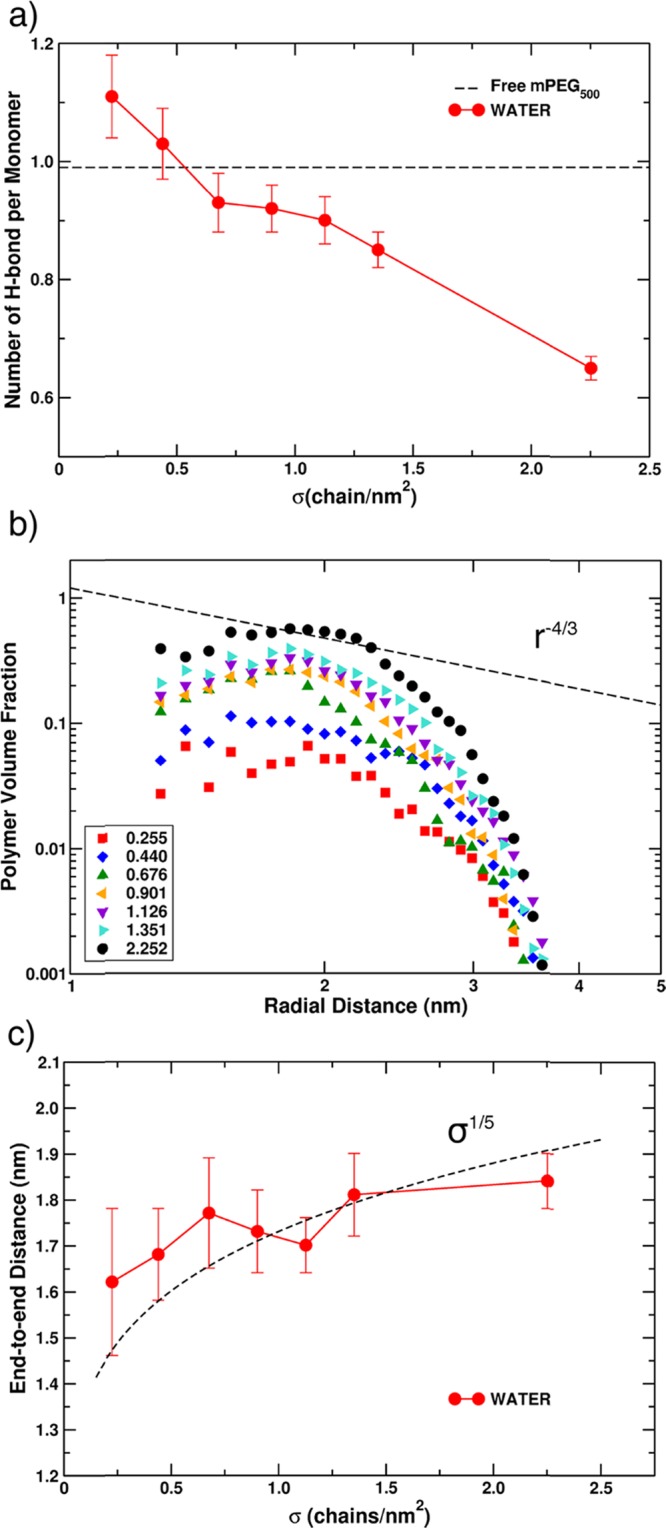
(a) Number of H-bonds per monomer for all mPEG500@NP at different grafting densities σ (chain/nm2). (b) Volume fraction Φ(r) of mPEG500 around the nanoparticle as a function of the radial distance (in nm) from the NP barycenter. (c) End-to-end distance (height of the polymer corona, in nm) for all mPEG500@NP as a function of the grafting density σ (in chain/nm2).
Since we are studying the conformation of polymers grafted to a spherical crystalline nanoparticle immersed in water, it is interesting to discuss the applicability of the Daoud and Cotton theoretical model,43 developed for star-like polymers, to the systems under study. This model predicts that, for star-like brushes, with a sufficiently high coverage density, there is a polymer region defined as semidilute (see Section 1), where the polymer volume fraction decreases with r according to Φ(r) ∝ r–4/3. If we look at the dashed line in Figure 8b and compare it with the black circle points for our highest grafting density, we may conclude that our findings are in agreement with the model. In addition, further extensions of the originally proposed model26,44,45 predict that, for very small particles, in the semidilute and good solvent conditions, the average brush height (H) scales as H ∝ σ1/5. The average brush height can be approximated with the end-to-end distance, as proposed by Dahal et al.27 and done in Figure 8c. The fitting with the model equation H ∝ σ1/5 is good. The small discrepancies observed can be attributed to statistical fluctuations.
Another relevant indicator for the conformation analysis of mPEG500@NP in water is the OCCO dihedral angle index (DAI). As detailed in Section 2.2.2, this indicator is proportional to the number of OCCO trans dihedral angles in the mPEG500 chains. Therefore, high DAI values are evidence of more stretched chains and therefore brush-like conformations.
In Figure 9, the DAI value is reported as a function of the grafting densities for all the mPEG500@NP systems considered in this work. We also show the DAI value for free mPEG500 and brush reference models (i.e., a reference system for very stretched and interacting mPEG500 chains). The brush reference model was developed and reported in a recent work by some of us95 and corresponds to a highly covered flat (101) anatase TiO2 surface (σ = 2.573 chain/nm2).
Figure 9.
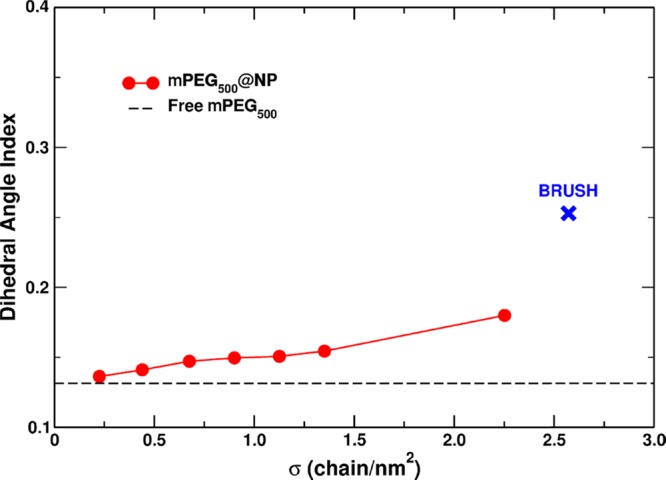
Dihedral angle index (DAI) calculated for the free mPEG500 chain (dashed black line), brush (blue cross) reference systems, and all the different grafting densities of PEG500@NP systems (red dots).
From Figure 9, we can also infer the role played by the surface curvature on the PEG chain conformation. Despite the similar grafting density (σ = 2.252 chain/nm2 for the most covered mPEG500@NP system and σ = 2.573 chain/nm2 for PEG on the flat (101) surface), the conformation of mPEG500 grafted to the flat surface is much more stretched than that on the curved nanoparticle (as proven by the much higher DAI value). This can be explained considering that, in the case of the flat surface, the volume available to each PEG chain is constant when moving away from the surface, whereas in the case of the spherical NP, it progressively increases, allowing the PEG chain to coil. For nanoparticles with increasing size and consequent decreasing surface curvature, at an equal grafting density, we expect a gradually increasing stretching effect on the polymer chain.
We observe that, at a low coverage (σ < 0.440 chain/nm2), mPEG500 chains grafted to the NP have the same configuration as free mPEG500 (similar low DAI value), indicating a strong mPEG/solvent interaction. As the density increases, the DAI slightly increases as well, but it remains surprisingly close to the free mPEG500 value, at least up to a grafting density of σ = 1.351 chain/nm2, still very far from the reference brush DAI value (0.25). Only for the highest coverage considered (σ = 2.252 chain/nm2), one may observe an increase in the DAI and therefore deduce that a transition to the brush conformation is occurring. In other words, an evident difference between the conformation of the free polymer and the grafted systems appears only at a rather high coverage (at least for σ > 1.351 chain/nm2).
4. Discussion
The comparison between experimental measurements and theoretical simulations is fundamental to establish: the controlling factors for an enhanced grafting density, and the conformation of the polymer corona around titanium dioxide nanocrystals. In the analysis of mPEG monomers adsorption in Sections 3.1.2 and 3.2.2, we have neglected the entropic contributions of the polymer chains (due to the small size) to the adsorption energy and focused on the surface chemistry of the linker used to anchor the PEG chains to the nanocrystals. Both experiments and calculations agree that, given a sufficiently long reaction time, the key factor in the adsorption process is the small size of the anchoring group: the smaller the group, the larger the number of total adsorbed monomers, that is, −OH > −COOH > −PO(OH)2 (see grafting densities in Table 3 for experiments and Table 5 for calculations).
However, when mPEG chains are sufficiently long, the entropic factors come into play, and there is a cost to order the chains on the surface. This cost is expected to be better counterbalanced by a strongly binding linker. Quantum chemical calculations show the highest binding energy for the −PO(OH)2 linker (see Table 5). Indeed, experimental TGA data (see Table 4) confirm that for 500 g mol–1 < M̅w < 5000 g mol–1, the highest grafting density is observed for mPEG-PO(OH)2. For longer mPEG chains (M̅w > 5000 g mol–1), the entropic contribution becomes so large to cancel any enthalpy effect due to the linker binding energy (see Figure 4).
Analyzing our results according to the simplified model for polymers conformation by Labouta et al.42 (as done in Figure 1), we observe that the higher M̅w of mPEG, the higher the RF/Dm ratio: we go from a mushroom conformation (M̅w = 500 g mol–1) to a brush one (M̅w > 500 g mol–1). In standard conditions, the dense brush regime is never reached. However, a higher coverage can be obtained by tuning various parameters. In Section 3.1.4, we discussed that, for a fixed mPEG M̅w (500 g mol–1), the factors determining an enhanced grafting density are the solvent, temperature, and mPEG concentration. It was shown elsewhere by some of us24,95 that water competes with mPEG adsorption; therefore, the choice of DCM, which is a much less interacting solvent, is crucial to increase the grafting density. This, together with a higher initial polymer concentration and higher reaction temperature (42 °C), provides the conditions to obtain an RF/Dm ratio of 1.3 (see Figure 5), which is still not enough to assign the dense brush conformation to the sample, according to the model above.
However, we observe that the simplistic conformation assignment by Labouta et al.,42 indicating a mushroom-to-brush transition at RF/Dm = 1.0, is not supported by our 13C NMR analysis (Section 3.1.5). In Figure 6, we have a clear indication that the mPEG500@NP-b sample with the highest grafting density (σ = 0.900 chain/nm2 and RF/Dm = 1.3) shows the same chemical shift of free mPEG500 in water. Hence, the grafted mPEG is expected to have a random coil conformation and should still be considered in the mushroom regime. The same is found with simulations; the dihedral angle index (DAI) analysis in Section 3.2.3 gives a clear indication that till a grafting density of 1.351 chain/nm2, corresponding to an RF/Dm ratio of 1.5, the DAI index of the mPEG500@NP sample is close to that of free mPEG500 in water. A transition to a brush-like conformation is noticed only for RF/Dm = 2.0, corresponding to a very high grafting density (σ = 2.252 chain/nm2), which we could not obtain experimentally. On the basis of our experimental and theoretical results, the simplistic conformation analysis graphically shown in Figure 1, at the beginning of this paper, should be revised to the new one reported here in Figure 10.
Figure 10.

Plot ratio RF/Dm as a function of the number of monomer units present in the mPEG chains. The data reported are the same in Figure 1. Red squares, blue circles, and yellow triangles refer to −OH-terminated, −COOH-terminated, and −PO(OH)2-terminated mPEG chains, respectively, as obtained from the experiments, while turquoise stars refer to theoretical models. Now, the color shading is changed according to our results. Mushroom regime represents RF/Dm < 2 (green), while the brush regime is reached only for very high densities, RF/Dm > 2 (yellow). On the right, 3D sketches representing the conformation of the polymers in the different regimes are reported.
The new analysis proposed in Figure 10 is corroborated by other more accurate models for star brushes, such as the Daoud and Cotton one43 and its successive extensions.44−46 The DC model works only when the polymer is in the brush conformation. Our data in Figure 8b of Section 3.2.3 fits the DC model only for the highest grafting density (σ = 2.252 chain/nm2), which correspond to an RF/Dm value of 2.0. For this reason, we assign the change in conformation at this RF/Dm value (see change in background shading) in Figure 10.
5. Conclusions
In conclusion, this work reports for the first time a comprehensive combined experimental and theoretical investigation on the PEGylation of titanium dioxide curved nanocrystals. We not only determine the best synthetic protocol for obtaining a very high grafting density but also present an insightful conformational analysis, based on computational and 13C NMR data, that we use to fit existing and popular models in the literature, such as those by Labouta et al.42 and Daoud and Cotton.43
In standard conditions, we found that the most binding linker is the phosphonate group, also leading to the highest grafting density for the methoxy-PEG chains, when the molecular weight is between 500 and 5000 g mol–1. For larger M̅w, the role of the linker becomes negligible.
We have developed a procedure to further increase the grafting densities by changing the operating conditions. In particular, we have substituted the solvent from water to dichloromethane and increased the temperature from 25 to 42 °C and the starting polymer concentration from 6.7 to 23.0 M. The grafting density has reached the value of σ = 0.900 chain/nm2 to be compared with σ = 0.457 chain/nm2 in the previous conditions.
Regarding the conformational analysis, we have proved that the classical assignment by Labouta et al.42 of the mushroom-to-brush transition at about RF/Dm = 1.0, where RF and Dm are the Flory radius and the mean distance of the grafted polymer on the nanocrystal surface, respectively, is too crude. Our 13C NMR measurements and molecular dynamics simulations show that up to σ = 0.900 chain/nm2 and RF/Dm = 1.3, the mPEG polymer chains are still in a mushroom conformation. We have established that the transition takes place at approximately RF/Dm = 2.0. We have shown that our new assignment is confirmed by the more sophisticated Daoud and Cotton model. We wish to notice that the approaches that we have used, that is, 13C NMR and computational simulations, are much less demanding than the experimental measurements by SANS or SAXS,16,48,49 which could be an alternative approach.
The study we have performed in this work could be applied to other PEGylated nanocrystals, providing a valuable and rational basis for the design of coated systems to be employed in many biomedical applications.
Acknowledgments
The authors are grateful to Lorenzo Ferraro for his technical help and Stefano Motta for fruitful discussions. The project has received funding from the European Research Council (ERC) under the European Union’s HORIZON2020 research and innovation programme (ERC grant agreement no. 647020).
Supporting Information Available
The Supporting Information is available free of charge on the ACS Publications website at DOI: 10.1021/acs.chemmater.9b02329.
Synthetic details; data of the experimental characterization of the anatase TiO2 nanocrystal by XRD, TEM, DLS, and ζ-potential; radius of gyration calculated from DLS; FTIR and TGA spectra for grafted mPEG500@NP samples; details on the generation of the AMBER force field for the mPEG chain; anatase TiO2 spherical NP model; graphical representation of DFTB binding energy distribution for molecular and dissociated water; structure and chemical formula of mPEG monomers with different terminal linkers; definition of the molecular dynamics analysis indicators; values of the gyration radius and end-to-end distance for the mPEG500 chain in water calculated from the molecular dynamics simulations; averaged distribution of OCCO dihedral angles of the free mPEG500 chain in water; mPEG monomer adsorption description and binding energy definition; graphical representation of the mPEG monomer adsorption mode considered; DFTB binding energy of the mPEG-OH, mPEG-COOH, and mPEG-PO(OH)2 monomer adsorption on the anatase TiO2 nanocrystal with different binding modes; and definition of the mPEG monomer full cover and relative binding energies definition (PDF)
The authors declare no competing financial interest.
Supplementary Material
References
- Rajh T.; Dimitrijevic N. M.; Bissonnette M.; Koritarov T.; Konda V. Titanium Dioxide in the Service of the Biomedical Revolution. Chem. Rev. 2014, 114, 10177–10216. 10.1021/cr500029g. [DOI] [PubMed] [Google Scholar]
- Ghosh S.; Das A. P. Modified Titanium Oxide (TiO2) Nanocomposites and Its Array of Applications: A Review. Toxicol. Environ. Chem. 2015, 97, 491–514. 10.1080/02772248.2015.1052204. [DOI] [Google Scholar]
- Nosaka Y.; Nosaka A. Y. Generation and Detection of Reactive Oxygen Species in Photocatalysis. Chem. Rev. 2017, 117, 11302–11336. 10.1021/acs.chemrev.7b00161. [DOI] [PubMed] [Google Scholar]
- Lopez T.; Ortiz E.; Alvarez M.; Navarrete J.; Odriozola J. A.; Martinez-Ortega F.; Páez-Mozo E. A.; Escobar P.; Espinoza K. A.; Rivero I. A. Study of the Stabilization of Zinc Phthalocyanine in SolGel TiO2 for Photodynamic Therapy Applications. Nanomedicine 2010, 6, 777–785. 10.1016/j.nano.2010.04.007. [DOI] [PubMed] [Google Scholar]
- Mano S. S.; Kanehira K.; Sonezaki S.; Taniguchi A. Effect of Polyethylene Glycol Modification of TiO2 Nanoparticles on Cytotoxicity and Gene Expressions in Human Cell Lines. Int. J. Mol. Sci. 2012, 13, 3703–3717. 10.3390/ijms13033703. [DOI] [PMC free article] [PubMed] [Google Scholar]
- Hamzeh M.; Sunahara G. I. In Vitro Cytotoxicity and Genotoxicity Studies of Titanium Dioxide (TiO2) Nanoparticles in Chinese Hamster Lung Fibroblast Cells. Toxicol. In Vitro 2013, 27, 864–873. 10.1016/j.tiv.2012.12.018. [DOI] [PubMed] [Google Scholar]
- Trouiller B.; Reliene R.; Westbrook A.; Solaimani P.; Schiestl R. H. Titanium Dioxide Nanoparticles Induce DNA Damage and Genetic Instability in Vivo in Mice. Cancer Res. 2009, 69, 8784–8789. 10.1158/0008-5472.CAN-09-2496. [DOI] [PMC free article] [PubMed] [Google Scholar]
- Jokerst J. V.; Lobovkina T.; Zare R. N.; Gambhir S. S. Nanoparticle PEGylation for Imaging and Therapy. Nanomedicine 2011, 6, 715–728. 10.2217/nnm.11.19. [DOI] [PMC free article] [PubMed] [Google Scholar]
- Schöttler S.; Becker G.; Winzen S.; Steinbach T.; Mohr K.; Landfester K.; Mailänder V.; Wurm F. R. Protein Adsorption is ¨ Required for Stealth Effect of Poly(Ethylene Glycol)- and Poly- (Phosphoester)-Coated Nanocarriers. Nat. Nanotechnol. 2016, 11, 372–377. 10.1038/nnano.2015.330. [DOI] [PubMed] [Google Scholar]
- Gamucci O.; Bertero A.; Gagliardi M.; Bardi G. Biomedical Nanoparticles: Overview of Their Surface Immune-Compatibility. Coatings 2014, 4, 139–159. 10.3390/coatings4010139. [DOI] [Google Scholar]
- Zhang F.; Lees E.; Amin F.; Rivera Gil P.; Yang F.; Mulvaney P.; Parak W. J. Polymer-Coated Nanoparticles: a Universal Tool for Biolabelling Experiments. Small 2011, 7, 3113–3127. 10.1002/smll.201100608. [DOI] [PubMed] [Google Scholar]
- Karakoti A. S.; Das S.; Thevuthasan S.; Seal S. PEGylated Inorganic Nanoparticles. Angew. Chem., Int. Ed. 2011, 50, 1980–1994. 10.1002/anie.201002969. [DOI] [PubMed] [Google Scholar]
- Uz M.; Bulmus V.; Altinkaya S. A. Effect of PEG Grafting Density and Hydrodynamic Volume on Gold Nanoparticle–Cell Interactions: An Investigation on Cell Cycle, Apoptosis, and DNA Damage. Langmuir 2016, 32, 5997–6009. 10.1021/acs.langmuir.6b01289. [DOI] [PubMed] [Google Scholar]
- Rahme K.; Chen L.; Hobbs R. G.; Morris M. A.; O’Driscoll C.; Holmes J. D. PEGylated Gold Nanoparticles: Polymer Quantification as a Function of PEG Lengths and Nanoparticle Dimensions. RSC Adv. 2013, 3, 6085–6094. 10.1039/C3RA22739A. [DOI] [Google Scholar]
- Qian W.; Murakami M.; Ichikawa Y.; Che Y. Highly Efficient and Controllable PEGylation of Gold Nanoparticles Prepared by Femtosecond Laser Ablation in Water. J. Phys. Chem. C 2011, 115, 23293–23298. 10.1021/jp2079567. [DOI] [Google Scholar]
- Maccarini M.; Briganti G.; Rucareanu S.; Lui X.-D.; Sinibaldi R.; Sztucki M.; Lennox R. B. Characterization of Poly(ethylene oxide)-Capped Gold Nanoparticles in Water by Means of Transmission Electron Microscopy, Thermogravimetric Analysis, Mass Density, and Small Angle Scattering. J. Phys. Chem. C 2010, 114, 6937–6943. 10.1021/jp9118088. [DOI] [Google Scholar]
- Ma K.; Zhang D.; Cong Y.; Wiesner U. Elucidating the Mechanism of Silica Nanoparticle PEGylation Processes Using Fluorescence Correlation Spectroscopies. Chem. Mater. 2016, 28, 1537–1545. 10.1021/acs.chemmater.6b00030. [DOI] [Google Scholar]
- Lu C.; Bhatt L. R.; Jun H. Y.; Park S. H.; Chai K. Y. Carboxyl-Polyethylene Glycol-Phosphoric Acid: A Ligand for Highly Stabilized Iron Oxide Nanoparticles. J. Mater. Chem. 2012, 22, 19806–19811. 10.1039/c2jm34327d. [DOI] [Google Scholar]
- Zirbs R.; Lassenberger A.; Vonderhaid I.; Kurzhals S.; Reimhult E. Melt-grafting for the Synthesis of Core–shell Nanoparticles with Ultra-high Dispersant Density. Nanoscale 2015, 7, 11216–11225. 10.1039/C5NR02313K. [DOI] [PubMed] [Google Scholar]
- Kotsokechagia T.; Zaki N. M.; Syres K.; de Leonardis P.; Thomas A.; Cellesi F.; Tirelli N. PEGylation of Nanosubstrates (Titania) with Multifunctional Reagents: At the Crossroads between Nanoparticles and Nanocomposites. Langmuir 2012, 28, 11490–11501. 10.1021/la3012958. [DOI] [PubMed] [Google Scholar]
- Yamaguchi S.; Kobayashi H.; Narita T.; Kanehira K.; Sonezaki S.; Kudo N.; Kubota Y.; Terasaka S.; Houkin K. Sonodynamic Therapy Using Water-Dispersed TiO2-Polyethylene Glycol Compound on Glioma Cells: Comparison of Cytotoxic Mechanism with Photodynamic Therapy. Ultrason. Sonochem. 2011, 18, 1197–1204. 10.1016/j.ultsonch.2010.12.017. [DOI] [PubMed] [Google Scholar]
- Pozzi D.; Colapicchioni V.; Caracciolo G.; Piovesana S.; Capriotti A. L.; Palchetti S.; De Grossi S.; Riccioli A.; Amenitsch H.; Laganà A. Effect of Polyethyleneglycol (PEG) Chain Length on the Bio-Nano-Interactions between PEGylated Lipid Nanoparticles and Biological Fluids: From Nanostructure to Uptake in Cancer Cells. Nanoscale 2014, 6, 2782–2792. 10.1039/c3nr05559k. [DOI] [PubMed] [Google Scholar]
- Xue W.; Liu Y.; Zhang N.; Yao Y.; Ma P.; Wen H.; Huang S.; Luo Y. E.; Fan H. Effects of Core Size and PEG Coating Layer of Iron Oxide Nanoparticles on the Distribution and Metabolism in Mice. Int. J. Nanomed. 2018, 13, 5719–5731. 10.2147/IJN.S165451. [DOI] [PMC free article] [PubMed] [Google Scholar]
- Selli D.; Valentin C. D. Ab Initio Investigation of Polyethylene Glycol Coating of TiO 2 Surfaces. J. Phys. Chem. C 2016, 120, 29190–29201. 10.1021/acs.jpcc.6b09554. [DOI] [PMC free article] [PubMed] [Google Scholar]
- Lindberg E.; Elvingson C. Monte Carlo Simulation of Polymer Brushes Attached to a Spherical Surface. J. Chem. Phys. 2001, 114, 6343–6352. 10.1063/1.1355236. [DOI] [Google Scholar]
- Lo Verso F.; Yelash L.; Egorov S. A.; Binder K. Effect of the Solvent Quality on the Structural Rearrangement of Spherical Brushes: Coarse-Grained Models. Soft Matter 2012, 8, 4185–4196. 10.1039/c2sm06836b. [DOI] [Google Scholar]
- Dahal U.; Wang Z.; Dormidontova E. E. Hydration of Spherical PEO-Grafted Gold Nanoparticles: Curvature and Grafting Density Effect. Macromolecules 2018, 51, 5950–5961. 10.1021/acs.macromol.8b01114. [DOI] [Google Scholar]
- Lin J.; Zhang H.; Morovati V.; Dargazany R. PEGylation on Mixed Monolayer Gold Nanoparticles: Effect of Grafting Density, Chain Length, and Surface Curvature. J. Colloid Interface Sci. 2017, 504, 325–333. 10.1016/j.jcis.2017.05.046. [DOI] [PubMed] [Google Scholar]
- Hong B.; Panagiotopoulos A. Z. Molecular Dynamics Simulations of Silica Nanoparticles Grafted with Poly(ethylene oxide) Oligomer Chains. J. Phys. Chem. B 2012, 116, 2385–2395. 10.1021/jp2112582. [DOI] [PubMed] [Google Scholar]
- Eslami H.; Rahimi M.; Müller-Plathe F. Molecular Dynamics Simulation of a Silica Nanoparticle in Oligomeric Poly(methyl methacrylate): A Model System for Studying the Interphase Thickness in a Polymer–Nanocomposite via Different Properties. Macromolecules 2013, 46, 8680–8692. 10.1021/ma401443v. [DOI] [Google Scholar]
- Qiang L.; Yang T.; Li Z.; Wang H.; Chen X.; Cui X. Molecular Dynamics Simulations of the Interaction Between Fe3O4 and Biocompatible Polymer. Colloids Surf., A 2014, 456, 62–66. 10.1016/j.colsurfa.2014.04.058. [DOI] [Google Scholar]
- Harris R. A.; van der Walt H.; Shumbula P. M. Molecular Dynamics Study on Iron Oxide Nanoparticles Stabilised with Sebacic Acid and 1,10-Decanediol Surfactants. J. Mol. Struct. 2013, 1048, 18–26. 10.1016/j.molstruc.2013.05.026. [DOI] [Google Scholar]
- Hosseini nasr A.-S.; Akbarzadeh H.; Tayebee R. Adsorption Mechanism of Different Acyclovir Concentrations on 1–2 nm Sized Magnetite Nanoparticles: A Molecular Dynamics Study. J. Mol. Liq. 2018, 254, 64–69. 10.1016/j.molliq.2018.01.081. [DOI] [Google Scholar]
- Harder P.; Grunze M.; Dahint R.; Whitesides G. M.; Laibinis P. E. Molecular Conformation in Oligo(ethylene glycol)-Terminated Self-Assembled Monolayers on Gold and Silver Surfaces Determines Their Ability To Resist Protein Adsorption. J. Phys. Chem. B 1998, 102, 426–436. 10.1021/jp972635z. [DOI] [Google Scholar]
- de Gennes P. G. Polymers at an Interface; a Simplified View. Adv. Colloid Interface Sci. 1987, 27, 189–209. 10.1016/0001-8686(87)85003-0. [DOI] [Google Scholar]
- Alexander S. Adsorption of Chain Molecules with a Polar Head a Scaling Description. J. Phys. France 1977, 38, 983–987. 10.1051/jphys:01977003808098300. [DOI] [Google Scholar]
- Damodaran V. B.; Fee C. J.; Ruckh T.; Popat K. C. Conformational Studies of Covalently Grafted Poly(ethylene glycol) on Modified Solid Matrices Using X-ray Photoelectron Spectroscopy. Langmuir 2010, 26, 7299–7306. 10.1021/la9041502. [DOI] [PubMed] [Google Scholar]
- Kim M.; Schmitt S.; Choi J.; Krutty J.; Gopalan P. From Self-Assembled Monolayers to Coatings: Advances in the Synthesis and Nanobio Applications of Polymer Brushes. Polymer 2015, 7, 1346–1378. 10.3390/polym7071346. [DOI] [Google Scholar]
- Backmann N.; Kappeler N.; Braun T.; Huber F.; Lang H.-P.; Gerber C.; Lim R. Y. H. Sensing Surface PEGylation with Microcantilevers. Beilstein J. Nanotechnol. 2010, 1, 3–13. 10.3762/bjnano.1.2. [DOI] [PMC free article] [PubMed] [Google Scholar]
- Unsworth L. D.; Tun Z.; Sheardown H.; Brash J. L. Chemisorption of Thiolated Poly(ethylene oxide) to Gold: Surface Chain Densities Measured by Ellipsometry and Neutron Reflectometry. J. Colloid Interface Sci. 2005, 281, 112–121. 10.1016/j.jcis.2004.08.022. [DOI] [PubMed] [Google Scholar]
- Cruje C.; Chithrani D. B. Polyethylene Glycol Functionalized Nanoparticles for Improved Cancer Treatment. Rev. Nanosci. Nanotechnol. 2014, 3, 20–30. 10.1166/rnn.2014.1042. [DOI] [Google Scholar]
- Labouta H. I.; Gomez-Garcia M. J.; Sarsons C. D.; Nguyen T.; Kennard J.; Ngo W.; Terefe K.; Iragorri N.; Lai P.; Rinker K. D.; et al. Surface-Grafted Polyethylene Glycol Conformation Impacts the Transport of PEG-Functionalized Liposomes through a Tumour Extracellular Matrix Model. RSC Adv. 2018, 8, 7697–7708. 10.1039/C7RA13438J. [DOI] [PMC free article] [PubMed] [Google Scholar]
- Daoud M.; Cotton J. P. Star Shaped Polymers: A Model for the Conformation and Its Concentration Dependence. J. Phys. France 1982, 43, 531–538. 10.1051/jphys:01982004303053100. [DOI] [Google Scholar]
- Dan N.; Tirrell M. Polymers Tethered to Curves Interfaces: A Self-Consistent-Field Analysis. Macromolecules 1992, 25, 2890–2895. 10.1021/ma00037a016. [DOI] [Google Scholar]
- Wijmans C. M.; Zhulina E. B. Polymer Brushes at Curved Surfaces. Macromolecules 1993, 26, 7214–7224. 10.1021/ma00078a016. [DOI] [Google Scholar]
- Dukes D.; Li Y.; Lewis S.; Benicewicz B.; Schadler L.; Kumar S. K. Conformational Transitions of Spherical Polymer Brushes: Synthesis, Characterization, and Theory. Macromolecules 2010, 43, 1564–1570. 10.1021/ma901228t. [DOI] [Google Scholar]
- Ohno K.; Morinaga T.; Takeno S.; Tsujii Y.; Fukuda T. Suspensions of Silica Particles Grafted with Concentrated Polymer Brush: Effects of Graft Chain Length on Brush Layer Thickness and Colloidal Crystallization. Macromolecules 2007, 40, 9143–9150. 10.1021/ma071770z. [DOI] [Google Scholar]
- Hore M. J. A.; Ford J.; Ohno K.; Composto R. J.; Hammouda B. Direct Measurements of Polymer Brush Conformation Using SmallAngle Neutron Scattering (SANS) from Highly Grafted Iron Oxide Nanoparticles in Homopolymer Melts. Macromolecules 2013, 46, 9341–9348. 10.1021/ma401975a. [DOI] [Google Scholar]
- Grünewald T. A.; Lassenberger A.; van Oostrum P. D. J.; Rennhofer H.; Zirbs R.; Capone B.; Vonderhaid I.; Amenitsch H.; Lichtenegger H. C.; Reimhult E. Core–Shell Structure of Monodisperse Poly(Ethylene Glycol)-Grafted Iron Oxide Nanoparticles Studied by Small-Angle X-Ray Scattering. Chem. Mater. 2015, 27, 4763–4771. 10.1021/acs.chemmater.5b01488. [DOI] [PMC free article] [PubMed] [Google Scholar]
- Dinh C. T.; Nguyen T. D.; Kleitz F.; Do T. O. Shape-Controlled Synthesis of Highly Crystalline Titania Nanocrystals. ACS Nano 2009, 3, 3737–3743. 10.1021/nn900940p. [DOI] [PubMed] [Google Scholar]
- Dong A.; Ye X.; Chen J.; Kang Y.; Gordon T.; Kikkawa J. M.; Murray C. B. A Generalized Ligand-Exchange Strategy Enabling Sequential Surface Functionalization of Colloidal Nanocrystals. J. Am. Chem. Soc. 2011, 133, 998–1006. 10.1021/ja108948z. [DOI] [PubMed] [Google Scholar]
- Tawfilas M.; Mauri M.; De Trizio L.; Lorenzi R.; Simonutti R. Surface Characterization of TiO2 Polymorphic Nanocrystals through 1H-TD-NMR. Langmuir 2018, 34, 9460–9469. 10.1021/acs.langmuir.8b01216. [DOI] [PubMed] [Google Scholar]
- Zalipsky S. Functionalized Poly(Ethylene Glycols) for Preparation of Biologically Relevant Conjugates. Bioconjugate Chem. 1995, 6, 150–165. 10.1021/bc00032a002. [DOI] [PubMed] [Google Scholar]
- Dollimore D.; Spooner P.; Turner A. The Bet Method of Analysis of Gas Adsorption Data and Its Relevance to the Calculation of Surface Areas. Surf. Technol. 1976, 4, 121–160. 10.1016/0376-4583(76)90024-8. [DOI] [Google Scholar]
- Case D. A.; Betz R. M.; Cerutti D. S.; Cheatham T. E. III; Darden T. A.; Duke R. E.; Giese T. J.; Gohlke H.; Goetz A. W.; Homeyer N.; Izadi S.; Janowski P.; Kaus J.; Kovalenko A.; Lee T. S.; LeGrand S.; Li P.; Lin C.; Luchko T.; Luo R.; Madej B.; Mermelstein D.; Merz K. M.; Monard G.; Nguyen H.; Nguyen H. T.; Omelyan I.; Onufriev A.; Roe D. R.; Roitberg A.; Sagui C.; Simmerling C. L.; Botello-Smith W. M.; Swails J.; Walker R. C.; Wang J.; Wolf R. M.; Wu X.; Xiao L.; Kollman P. A.. AMBER 2016; University of California: San Francisco, (2016).
- Loncharich R. J.; Brooks B. R.; Pastor R. W. Langevin Dynamics of Peptides: The Frictional Dependence of Isomerization Rates of N-Acetylalanyl-N’-methylamide. Biopolymers 1992, 32, 523–535. 10.1002/bip.360320508. [DOI] [PubMed] [Google Scholar]
- Jorgensen W. L.; Chandrasekhar J.; Madura J. D.; Impey R. W.; Klein M. L. Comparison of Simple Potential Functions for Simulating Liquid Water. J. Chem. Phys. 1983, 79, 926. 10.1063/1.445869. [DOI] [Google Scholar]
- Matsui M.; Akaogi M. Molecular dynamics simulation of the structural and physical properties of the four polymorphs of TiO2. Mol. Simul. 1991, 6, 239–244. 10.1080/08927029108022432. [DOI] [Google Scholar]
- Luan B.; Huynh T.; Zhou R. Simplified TiO2 force fields for studies of its interaction with biomolecules. J. Chem. Phys. 2015, 142, 234102. 10.1063/1.4922618. [DOI] [PubMed] [Google Scholar]
- Wang J.; Wolf R. M.; Caldwell J. W.; Kollman P. A.; Case D. A. Development and Testing of a General Amber Force Field. J. Comput. Chem. 2004, 25, 1157–1174. 10.1002/jcc.20035. [DOI] [PubMed] [Google Scholar]
- Elstner M.; Porezag D.; Jungnickel G.; Elsner J.; Haugk M.; Frauenheim T.; Suhai S.; Seifert G. Self-Consistent-Charge density-functional Tight-Binding Method for Simulations of Complex Materials Properties. Phys. Rev. B 1998, 58, 7260–7268. 10.1103/PhysRevB.58.7260. [DOI] [Google Scholar]
- Aradi B.; Hourahine B.; Frauenheim T. DFTB+, a Sparse Matrix-Based Implementation of the DFTB Method. J. Phys. Chem. A 2007, 111, 5678–5684. 10.1021/jp070186p. [DOI] [PubMed] [Google Scholar]
- Elstner M.; Seifert G. Density Functional Tight Binding. Philos. Trans. R. Soc., A 2014, 372, 20120483. 10.1098/rsta.2012.0483. [DOI] [PubMed] [Google Scholar]
- Seifert G.; Joswig J.-O. Density-functional Tight Binding - an Approximate Density-Functional Theory Method. Wiley Interdiscip. Rev.: Comput. Mol. Sci. 2012, 2, 456–465. 10.1002/wcms.1094. [DOI] [Google Scholar]
- Selli D.; Fazio G.; Seifert G.; Di Valentin C. Water Multilayers on TiO2 (101) Anatase Surface: Assessment of a DFTB-Based Method. J. Chem. Theory Comput. 2017, 13, 3862–3873. 10.1021/acs.jctc.7b00479. [DOI] [PMC free article] [PubMed] [Google Scholar]
- Grimme S.; Antony J.; Ehrlich S.; Krieg H. A Consistent and Accurate ab initio Parametrization of Density Functional Dispersion Correction (DFT-D) for the 94 Elements H-Pu. J. Chem. Phys. 2010, 132, 154104. 10.1063/1.3382344. [DOI] [PubMed] [Google Scholar]
- Selli D.; Fazio G.; Di Valentin C. Modelling Realistic TiO2 Nanospheres: A Benchmark Study of SCC-DFTB against hybrid DFT. J. Chem. Phys. 2017, 147, 164701. 10.1063/1.4994165. [DOI] [PubMed] [Google Scholar]
- Fazio G.; Selli D.; Ferraro L.; Seifert G.; Di Valentin C. Curved TiO2 Nanoparticles in Water: Short (Chemical) and Long (Physical) Range Interfacial Effects. ACS Appl. Mater. Interfaces 2018, 10, 29943–29953. 10.1021/acsami.8b08172. [DOI] [PMC free article] [PubMed] [Google Scholar]
- Strobl G. R.The Physics of Polymers; 2nd ed.; Springer Verlag: Berlin, Germany, 1997. [Google Scholar]
- Linegar K. L.; Adeniran A. E.; Kostko A. F.; Anisimov M. A. Hydrodynamic Radius of Polyethylene Glycol in Solution Obtained by Dynamic Light Scattering. Colloid J. 2010, 72, 279–281. 10.1134/S1061933X10020195. [DOI] [Google Scholar]
- Mutin P. H.; Guerrero G.; Vioux A. Organic-Inorganic Hybrid Materials Based on Organophosphorus Coupling Molecules: From Metal Phosphonates to Surface Modification of Oxides. C. R. Chim. 2003, 6, 1153–1164. 10.1016/j.crci.2003.07.006. [DOI] [Google Scholar]
- Mutin P. H.; Guerrero G.; Vioux A. Hybrid Materials from Organophosphorus Coupling Molecules. J. Mater. Chem. 2005, 15, 3761–3768. 10.1039/b505422b. [DOI] [Google Scholar]
- Kim P.; Jones S. C.; Hotchkiss P. J.; Haddock J. N.; Kippelen B.; Marder S. R.; Perry J. W. Phosphonic Acid-Modified Barium Titanate Polymer Nanocomposites with High Permittivity and Dielectric Strength. Adv. Mater. 2007, 19, 1001–1005. 10.1002/adma.200602422. [DOI] [Google Scholar]
- Queffélec C.; Petit M.; Janvier P.; Knight D. A.; Bujoli B. Surface Modification Using Phosphonic Acids and Esters. Chem. Rev. 2012, 112, 3777–3807. 10.1021/cr2004212. [DOI] [PubMed] [Google Scholar]
- Tao P.; Li Y.; Rungta A.; Viswanath A.; Gao J.; Benicewicz B. C.; Siegel R. W.; Schadler L. S. TiO2 Nanocomposites with High Refractive Index and Transparency. J. Mater. Chem. 2011, 21, 18623. 10.1039/c1jm13093e. [DOI] [Google Scholar]
- Li C.; Han J.; Ryu C. Y.; Benicewicz B. C. A Versatile Method to Prepare RAFT Agent Anchored Substrates and the Preparation of PMMA Grafted-Nanoparticles. Macromolecules 2006, 39, 3175–3183. 10.1021/ma051983t. [DOI] [Google Scholar]
- Levchenko A. A.; Li G.; Boerio-Goates J.; Woodfield B. F.; Navrotsky A. TiO2 Stability Landscape: Polymorphism, Surface Energy, and Bound Water Energetics. Chem. Mater. 2006, 18, 6324–6332. 10.1021/cm061183c. [DOI] [Google Scholar]
- Borodin O.; Smith G. D.; Bandyopadhyaya R.; Byutner O. Molecular Dynamics Study of the Influence of Solid Interfaces on Poly(Ethylene Oxide) Structure and Dynamics. Macromolecules 2003, 36, 7873–7883. 10.1021/ma0346005. [DOI] [Google Scholar]
- Karlstroem G. A New Model for Upper and Lower Critical Solution Temperatures in poly(ethylene Oxide) Solutions. J. Phys. Chem. 1985, 89, 4962–4964. 10.1021/j100269a015. [DOI] [Google Scholar]
- De Roo J.; Yazdani N.; Drijvers E.; Lauria A.; Maes J.; Owen J. S.; Van Driessche I.; Niederberger M.; Wood V.; Martins J. C.; Infante I.; Hens Z. Probing Solvent–Ligand Interactions in Colloidal Nanocrystals by the NMR Line Broadening. Chem. Mater. 2018, 30, 5485–5492. 10.1021/acs.chemmater.8b02523. [DOI] [Google Scholar]
- Badia A.; Gao W.; Singh S.; Demers L.; Cuccia L.; Reven L. Structure and Chain Dynamics of Alkanethiol-Capped Gold Colloids. Langmuir 1996, 12, 1262–1269. 10.1021/la9510487. [DOI] [Google Scholar]
- Karlström G.; Engkvist O. Theory of Poly(ethylene glycol) in Solution. ACS Symp. Ser. 1997, 680, 16–30. 10.1021/bk-1997-0680.ch002. [DOI] [Google Scholar]
- Stanzione F.; Jayaraman A. Hybrid Atomistic and Coarse-Grained Molecular Dynamics Simulations of Polyethylene Glycol (PEG) in Explicit Water. J. Phys. Chem. B 2016, 120, 4160–4173. 10.1021/acs.jpcb.6b02327. [DOI] [PubMed] [Google Scholar]
- Lee H.; Venable R. M.; MacKerell A. D. Jr.; Pastor R. W. Molecular Dynamics Studies of Polyethylene Oxide and Polyethylene Glycol: Hydrodynamic Radius and Shape Anisotropy. Biophys. J. 2008, 95, 1590–1599. 10.1529/biophysj.108.133025. [DOI] [PMC free article] [PubMed] [Google Scholar]
- Prasitnok K.; Wilson M. R. A Coarse-Grained Model for Polyethylene Glycol in Bulk Water and at a Water/Air Interface. Phys. Chem. Chem. Phys. 2013, 15, 17093–17104. 10.1039/c3cp52958d. [DOI] [PubMed] [Google Scholar]
- Devanand K.; Selser J. C. Asymptotic Behavior and Long-Range Interactions in Aqueous Solutions of Poly(ethylene oxide). Macromolecules 1991, 24, 5943–5947. 10.1021/ma00022a008. [DOI] [Google Scholar]
- Kawaguchi S.; Imai G.; Suzuki J.; Miyahara A.; Kitano T.; Ito K. Aqueous Solution Properties of Oligo- and Poly(ethylene oxide) by Static Light Scattering and Intrinsic Viscosity. Polymer 1997, 38, 2885–2891. 10.1016/S0032-3861(96)00859-2. [DOI] [Google Scholar]
- Oelmeier S. A.; Dismer F.; Hubbuch J. Molecular Dynamics Simulations on Aqueous Two-Phase Systems - Single PEG-Molecules in Solution. BMC Biophys. 2012, 5, 14. 10.1186/2046-1682-5-14. [DOI] [PMC free article] [PubMed] [Google Scholar]
- French A. C.; Thompson A. L.; Davis B. G. High-Purity Discrete PEG-Oligomer Crystals Allow Structural Insight. Angew. Chem., Int. Ed. 2009, 48, 1248–1252. 10.1002/anie.200804623. [DOI] [PubMed] [Google Scholar]
- Weng Y.-X.; Li L.; Liu Y.; Wang L.; Yang G.-Z. Surface-Binding Forms of Carboxylic Groups on Nanoparticulate TiO2 Surface Studied by the Interface-Sensitive Transient Triplet-State Molecular Probe. J. Phys. Chem. B 2003, 107, 4356–4363. 10.1021/jp022534n. [DOI] [Google Scholar]
- Brodard-Severac F.; Guerrero G.; Maquet J.; Florian P.; Gervais C.; Mutin P. H. High-Field 17O MAS NMR Investigation of Phosphonic Acid Monolayers on Titania. Chem. Mater. 2008, 20, 5191–5196. 10.1021/cm8012683. [DOI] [Google Scholar]
- Guerrero G.; Mutin P. H.; Vioux A. Anchoring of Phosphonate and Phosphinate Coupling Molecules on Titania Particles. Chem. Mater. 2001, 13, 4367–4373. 10.1021/cm001253u. [DOI] [Google Scholar]
- Zeininger L.; Portilla L.; Halik M.; Hirsch A. Quantitative Determination and Comparison of the Surface Binding of Phosphonic Acid, Carboxylic Acid, and Catechol Ligands on TiO2 Nanoparticles. Chem. – Eur. J. 2016, 22, 13506. 10.1002/chem.201601920. [DOI] [PubMed] [Google Scholar]
- Koparde V. N.; Cummings P. T. Molecular Dynamics Study of Water Adsorption on TiO2 Nanoparticles. J. Phys. Chem. C 2007, 111, 6920–6926. 10.1021/jp0666380. [DOI] [Google Scholar]
- Selli D.; Motta S.; Di Valentin C. Impact of Surface Curvature, Grafting Density and Solvent Type on the PEGylation of Titanium Dioxide Nanoparticles. J. Colloid Interface Sci. 2019, 519. 10.1016/j.jcis.2019.07.106. [DOI] [PubMed] [Google Scholar]
Associated Data
This section collects any data citations, data availability statements, or supplementary materials included in this article.