

Supplemental Digital Content is available in the text.
Keywords: Fabry disease, inflammation, myocardium, sphingolipid, troponin
Background:
Cardiac response to enzyme replacement therapy (ERT) in Fabry disease is typically assessed by measuring left ventricular mass index using echocardiography or cardiovascular magnetic resonance, but neither quantifies myocardial biology. Low native T1 in Fabry disease represents sphingolipid accumulation; late gadolinium enhancement with high T2 and troponin elevation reflects inflammation. We evaluated the effect of ERT on myocardial storage, inflammation, and hypertrophy.
Methods:
Twenty patients starting ERT (60% left ventricular hypertrophy–positive) were compared with 18 patients with early disease and 18 with advanced disease over 1 year at 3 centers. Cardiovascular magnetic resonance (left ventricular mass index, T1, T2, global longitudinal strain, and late gadolinium enhancement) and biomarkers (high-sensitive troponin-T and NT-proBNP [N-terminal Pro-B-type natriuretic peptide]) at baseline (pre-ERT) and 12 months were performed. Early disease controls were stable, treatment-naïve patients (mainly left ventricular hypertrophy–negative); advanced disease controls were stable, established ERT patients (mainly left ventricular hypertrophy–positive).
Results:
Over 1 year, early disease controls increased maximum wall thickness and left ventricular mass index (9.8±2.7 versus 10.2±2.6 mm; P=0.010; 65±15 versus 67±16 g/m2; P=0.005) and native T1 fell (981±58 versus 959±61 ms; P=0.002). Advanced disease controls increased T2 in the late gadolinium enhancement area (57±6 versus 60±7 ms; P=0.023) with worsening global longitudinal strain (−13.2±3.4 versus −12.1±4.8; P=0.039). Newly treated patients had a small reduction in maximum wall thickness (14.8±5.9 versus 14.4±5.7 mm; P=0.028), stable left ventricular mass index (93±42 versus 92±40 g/m2; P=0.186) and a reduction in T1 lowering (917±49 versus 931±54 ms; P=0.017).
Conclusions:
Fabry myocardial phenotype development is different at different disease stages. After 1 year of ERT initiation, left ventricular hypertrophy–positive patients have a detectable, small reduction in left ventricular mass and storage.
CLINICAL PERSPECTIVE
The leading cause of death in Fabry disease is now cardiac involvement. Treatment response (enzyme replacement therapy [ERT] or oral chaperone) has been typically assessed by measuring left ventricular hypertrophy (maximal wall thickness or left ventricular mass), but this does not quantify myocardial biology. Multiparametric cardiovascular magnetic resonance offers more –a low myocardial native T1 reflects sphingolipid accumulation and a high T2 in late gadolinium enhancement zones corresponds to high troponin and likely reflects inflammation. Using multiparametric cardiovascular magnetic resonance and blood biomarkers, we looked at the changes in Fabry myocardium after 1 year of initiation of ERT compared with other comparator groups (early, ERT naïve patients, and advanced, established on ERT patients). The data shows that Fabry disease myocardial phenotype changes differently with disease stage—early (untreated mainly female, mainly left ventricular hypertrophy–negative) versus advanced (treated, mainly male, mainly left ventricular hypertrophy–positive) patients. In early disease, there were increases in left ventricular mass and more storage whereas in late disease, there were increases in inflammation and reductions in strain with increases in troponin—but all changes were small. Patients starting ERT were different—with a small improvement in left ventricular mass and reduced storage. Combined, the data suggest that there is a small but clear beneficial ERT effect in Fabry disease.
See Editorial by Halliday and Pennell
Fabry Disease (FD) is a rare, X-linked lysosomal storage disorder leading to progressive sphingolipid accumulation affecting multiple organs including the heart.1 Cardiovascular death is the main cause of mortality,2 with left ventricular hypertrophy (LVH) and myocardial fibrosis being among the proposed risk factors for ventricular arrhythmia and sudden cardiac death.3 Enzyme replacement therapy (ERT) has been the mainstay of treatment with oral chaperone newly available for patients with amenable mutations. Timing of initiation of treatment seems important. The presence of overt LVH and myocardial fibrosis has been shown to negatively affect ERT outcome, suggesting the importance of early initiation of treatment.4,5 Cardiac response to ERT is typically assessed by measuring the left ventricular mass LVM index (LVMi) using either transthoracic echocardiography or cardiovascular magnetic resonance (CMR). However, this method does not quantify myocardial biology. The effect of treatment on myocardial storage is not widely reported, as invasive myocardial biopsy was required to measure this previously.6,7
Multiparametric mapping by CMR is now a noninvasive tool to assess myocardial storage and other disease processes such as inflammation. CMR can measure 3 fundamental magnetic tissue constants, T1, T2, and T2*, and display them as color maps. Low native T1 in FD represents sphingolipid accumulation.8,9 Late gadolinium enhancement (LGE) with high T2 and troponin elevation reflect inflammation,10 characteristically initially occurring in the basal inferolateral wall.11 LGE with thinning and no T2/no troponin represents scar. Myocardial strain measured by global longitudinal strain (GLS) using feature-tracking CMR has been recently shown to be impaired with hypertrophy, storage (measured by low native T1), and LGE in FD.12 Understanding the effect of ERT on these now measurable pathways is difficult as it is not acceptable to randomize patients fulfilling treatment criteria. We, therefore, designed an observational study to map the 1-year evolution of these processes in stable untreated and stable treated disease and to compare this to the changes of a group of patients starting ERT for the first time.
Methods
The data that support the findings of this study are available from the corresponding author on reasonable request.
Study Population
This prospective, multicenter, international observational study of 56 FD patients was a part of the Fabry400 study (NCT03199001). Participants were recruited from 3 Fabry clinics (United Kingdom: Royal Free Hospital London, Queen Elizabeth Hospital Birmingham; Australia: Westmead Hospital Sydney). The local research ethics committee approved the study. Written informed consent was obtained from all participants.
Inclusion criteria included gene-positive FD males and females age 18 years who underwent assessment at baseline and 12 months. These were in 3 groups: FD participants starting ERT and 2 further groups: FD patients stable on ERT (established on ERT) and FD ERT naïve participants. These patients were selected from clinic attenders, according to availability and agreement to attend both baseline and follow-up CMR scans. FD is a disease that evolves slowly. Across the different pathological processes measured in this study and reflecting the X-linked nature of the disease and treatment guidelines, change over 1 year in the ERT naive group will reflect early untreated disease (likely more female, more LVH-negative) and changes over 1 year in the ERT treated group will reflect more advanced treated disease trajectory (likely more male, more LVH-positive). The group starting ERT will likely represent an intermediate stage group—but with the potentially powerful impact of 1 year of new ERT detectable when compared with the other 2 groups. Patients on oral chaperone were excluded.
Baseline and 1-year assessment included CMR, estimated glomerular filtration rate, and blood biomarkers. These were high-sensitivity troponin T (Roche Diagnostic; normal range 0–14 ng/L for troponin T) and NT-proBNP (N-terminal pro-B-type natriuretic peptide; Roche Diagnostics; normal range according to age/gender).13 Hematocrit was also collected for extracellular volume fraction (ECV) calculation.
Cardiovascular Magnetic Resonance
All participants underwent CMR at 1.5 Tesla at 4 sites (London, Avanto and Aera; Birmingham, Avanto; Sydney, Avanto; Siemens Healthcare, Erlangen, Germany) using a standard clinical protocol with LGE imaging using phase-sensitive inversion recovery. T1 mapping using a modified Look-Locker inversion recovery sequence and T2 mapping were performed pre–contrast bolus administration (0.1 mmol/kg body weight, Gadoterate meglumine, Dotarem, Guerbet SA, France) on basal left ventricular short-axis slices (Table I in the Data Supplement). Post-T1 mapping was performed 15 minutes after contrast administration for ECV quantification. Contrast was not administered if estimated glomerular filtration rate <30 mL/min per 1.73 m2 or if the patient declined. Paired scans used identical sequences and magnets without upgrades, and phantom controls measured magnet stability for native T1 and T2 sequences.
CMR Analysis
All images were centralized and analyzed using CVI42 software (Circle Cardiovascular Imaging Inc, Calgary, Canada). All analysis was blinded to clinical status. The assessment of LV volumes and LV mass were performed as previously described.14 LVH was defined as maximum wall thickness >12 mm in adults or increased LVMi on CMR according to age and gender-matched normal reference ranges.15 The presence of LGE was assessed by 2 independent observers (Drs Nordin and Augusto). The amount of LGE was quantified using the threshold method of 5 standard deviations above the mean remote myocardium presented in grams. Two-dimensional GLS was obtained by manually drawing epicardial and endocardial contours on the end-diastolic frame of long-axis images (4-chamber, 2-chamber, and 3-chamber views) with strain obtained using applied automatic feature-tracking algorithm as previously described.12
A region of interest for native T1 and ECV was manually drawn in the septum with a 20% offset, taking care to avoid the blood-myocardial boundary. T2 at the LGE area assessment was performed by manually drawing a region of interest over areas corresponding to LGE.10 For cases without LGE, a region of interest was drawn in the basal inferolateral segment. Normal native T1 and T2 reference ranges (mean±2 SD) were defined using age- and gender-matched healthy controls from each individual center, with the group considered as a whole for T2 and split by gender for native T1 as native T1 is known to vary with gender.16,17 The normal native septal T1 ranges (mean, 1 SD, lower limit of normal) for each center were as follows: London center (Avanto), mean 1000±29 ms, lower limit 940 ms in male subgroup, and mean 1034±37 ms, lower limit 960 ms in female subgroup; London center (Aera), mean 994±18 ms, lower limit 958 ms in male subgroup, and mean 1027±22 ms, lower limit 983 ms in female subgroup; Birmingham center, mean 945±13 ms, lower limit 919 ms in males, and mean 966±19 ms, lower limit 928 ms in females; Sydney center, mean 1021±26 ms, lower limit 969 ms in males, and mean 1022±26 ms, lower limit 970 ms in females (Table II in the Data Supplement).
The T1 mapping and ECV standardization in cardiovascular magnetic resonance (T1MES) phantom was scanned as part of the T1MES multicenter study according to the user manual instructions distributed to centers and as previously described.18 Scanner room temperatures were stable throughout the test period at 20±0°C for the 2 London sites and 21±1°C for Birmingham and Sydney sites. Unadjusted for temperature, serial modified Look-Locker inversion recovery T1 times across the 9 tubes were highly stable with site-specific coefficient of variation of 0.805% and 0.751% for the London sites (Avanto and Aera scanners, respectively), 0.625% Birmingham, and 0.846% Sydney. Serial T2 times across the 9 tubes were also stable with site-specific coefficient of variation of 1.10% and 1.07% for the London sites, 1.06% Birmingham, and 1.06% Sydney.
FASTEX Analysis
FAbry STabilization indEX (FASTEX) analysis was performed to evaluate overall clinical stability or progression of FD at follow-up using an online application (www.fastex.online) as previously described.19,20 A FASTEX score of ≥20% is an indication of overall clinical worsening or clinical instability at follow-up.20
Statistical Analysis
Statistical analyses were performed using SPSS 24 (IBM, Armonk, NY). Continuous variables were expressed as mean±SD or median (interquartile range) according to normality using Shapiro-Wilk test; categorical variables were expressed as percentages. Data between baseline and follow-up visits were compared using either paired t test or Wilcoxon signed-rank test according to normality. The coefficient of variation between serial repeated phantom scans was calculated as a compound measure of all causes of change in the estimated native T1 and T2 of all 9 tubes. Two-way mixed ANOVA was performed to test for interaction between groups (ERT status) and time on CMR parameters and blood biomarkers. Tukey post hoc correction was applied for pairwise comparisons between groups. A P value of <0.05 was considered significant.
Results
Fifty-six participants were scanned at baseline and follow-up (mean 1.1±0.2 years). Baseline characteristics are shown in Table 1. Five additional recruited patients were excluded: one patient underwent permanent pacemaker insertion, and 4 patients who started ERT did not attend follow-up.
Table 1.
Baseline Demographic Characteristics of the FD Cohort

Group Initiated on ERT
Twenty participants were scanned at baseline (pre-ERT) and at 1 year, mean age 49±10 years. Ten were on agalsidase alfa (Replagal) and 10 on agalsidase beta (Fabrazyme). Sixty percent (12/20) had baseline LVH; 80% (16/20) had low T1; and 74% (14/19) had LGE. One patient did not received contrast at baseline due to previous allergic reaction. Thirty-five percent (7/20) were males; 35% (7/20) had a known cardiac variant (6 N215S mutation and 1 R301Q mutation). The ERT indication was mainly LVH.
Of those with LVH, 58% (7/12) were males, mean age 53±12 years. All patients with LVH had LGE at baseline. Eighty-three percent (10/12) had low T1 at baseline. The 2 LVH-positive patients with normal native T1 included a female with apical hypertrophy and a male with extensive LGE including the septal area. Eighty-three percent (10/12) had an increase in T1 value after 1 year of ERT. Eight (40%) were LVH-negative. The ERT indication in these 8 patients was still mainly cardiac, for example, LGE on CMR, but also other organ involvement, for example, transient ischemic attack, renal decline, or gastrointestinal symptoms. All LVH-negative patients started on ERT were female, mean age 43±9 years. Of the LVH-negative patients, 71% (5/7) had LGE (one patient did not receive contrast at baseline due to previous allergic reaction) and 75% (6/8) had low native T1 at baseline. Fifty percent (4/8) had an increase in T1 value after 1 year of ERT.
Over 1 year of ERT initiation, there was a small reduction in maximum wall thickness (14.8±5.9 versus 14.4±5.7 mm; P=0.028) but no change in LVMi (93±42 versus 92±40 g/m2; P=0.186). There was a small reduction in T1 lowering (partial normalization; 917±49 versus 931±54 ms; P=0.017). T2 in the LGE area, LGE presence, absence or extent, septal ECV and GLS were unchanged (T2: 55±6 versus 56±6 ms, P=0.609; LGE: 5.6 [0–16.9] versus 4.3 [1.8–18.5] g/m2, P=0.193; ECV: 0.26±0.04 versus 0.26±0.04, P=0.669; and GLS: −16.6±4.0 versus −16.2±3.9, P=0.518), as were troponin and NT-proBNP levels (troponin, 20 [7–34] versus 23 [9–40] ng/L; P=0.550 and NT-proBNP, 18 (12–83) versus 27 (13–114) pmol/L; P=0.230).
After 1 year of ERT, the LVH-positive group has shown a small reduction in LVMi (117±38 versus 114±36 g/m2; P=0.048) and reduction in T1 lowering (partial normalization; 902±47 versus 920±48 ms; P=0.008; Figures 1 and 2). There was no significant change in other parameters in the LVH-positive group (Table 2). All markers were unchanged in the LVH-negative group (Table 2).
Figure 1.
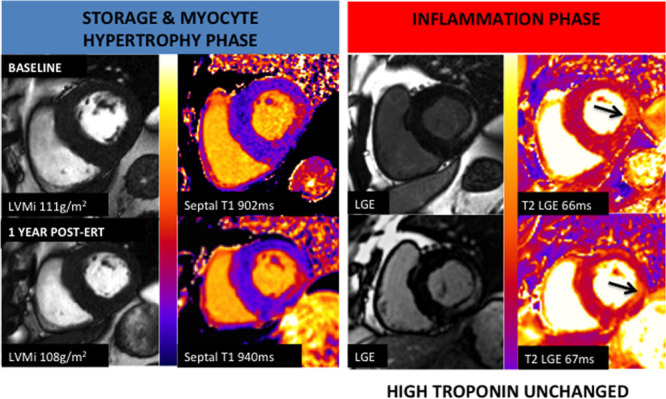
Example case. A 60-year-old Fabry Disease male with left ventricular hypertrophy, low T1 (902 ms), and basal inferolateral late gadolinium enhancement (LGE) before initiation of enzyme replacement therapy (ERT). T2 corresponding to the LGE area is high at 66 ms with high troponin level. After 1 y of initiation of ERT, T1 partially normalized to 940 ms, and limited regression of left ventricular mass index (LVMi) was observed (−4 g/m2). T2 at the LGE area remained high at 67 ms with no significant troponin level change.
Figure 2.

Left ventricular mass indexed (LVMi) and native T1 before and after initiation of enzyme replacement therapy (ERT) at 12 months in left ventricular hypertrophy (LVH)–positive and LVH-negative Fabry Disease. *P<0.05= statistically significant.
Table 2.
CMR and Blood Biomarkers Parameters LVH-Positive and LVH-Negative FD Before Initiation of ERT and 12 months

Advanced Stable Disease Group (Established on ERT)
The 18 patients established on ERT were 53±13 years with median ERT duration of 4.2 (1.4–12.2)years. Ten were on Replagal and 8 on Fabrazyme. Eighty-three percent (15/18) had LVH, and 56% (10/18) were males. Seventy-two percent (13/18) had low T1, and 73% (11/15) had LGE. Three did not receive contrast at baseline due to poor renal function. Eleven percent (2/18) had a known cardiac variant (N215S and I901T mutations). Eighty-three percent (15/18) patients were LVH-positive of which 60% (9/15) were males. Four LVH-positive patients with normal T1 had septal LGE to explain the pseudonormal T1.
Over 1 year, there was no significant difference in maximum wall thickness and LVMi (17.5±4.7 versus 17.8±4.9 mm; P=0.056 and 124±45 versus 125±45 g/m2; P=0.070, respectively). Native T1, ECV, and LGE quantification were unchanged (916±52 versus 912±50 ms, P=0.607; 0.28±0.03 versus 0.28±0.04, P=0.690; and 13 [4–28] versus 15 [6–29] g/m2, P=0.173, respectively). However, there was a significant increase in T2 in the LGE area and troponin at 1 year (T2: 57±6 versus 60±7 ms, P=0.023; troponin 43 [29–90] versus 48 [30–99] ng/L, P=0.036). GLS also became more impaired after 1 year (−13.2±3.4 versus −12.1±4.8; P=0.039), but NT-proBNP was unchanged after 1 year (60 [16–233] versus 70 [21−220] pmol/L; P=0.798). Within this group, comparing LVH-negative and -positive (baseline, follow-up) subgroups was not statistically possible as there were only 3/18 that were LVH-negative.
Group Not on ERT (Treatment Naïve)
The 18 patients not on ERT were 41±12 years. Seventeen percent (3/18) were males. Seventeen percent (3/18) had LVH. Forty-four percent (8/18) had low T1, and 21% (3/14) had LGE. Four patients declined contrast administration. Fifty percent (9/18) had a known cardiac variant (N215S mutation). Eighty-three percent (15/18) patients were LVH-negative of which 93% (14/15) were females.
Over 1 year, there was a small increase in maximum wall thickness and LVMi (9.8±2.7 versus 10.2±2.6 mm; P=0.010 and 65±15 versus 67±16 g/m2; P=0.005). One participant who was LVH-negative with low native T1 at baseline scan was found to progressed to LVH. No patients developed new LGE. There was a reduction in native T1 981±58 versus 959±61 ms, P=0.002; no patient became low T1 (Figure in the Data Supplement). T2, ECV, and GLS were all normal at baseline and unchanged over 1 year (T2: 50±3 versus 50±4 ms, P=0.847; ECV: 0.29±0.04 versus 0.27±0.03, P=0.159; and GLS: −19.2±2.6 versus −19.1±2.3, P=0.880. There was an increase in troponin 1 [1–4] versus 4.5 [1–10] ng/L; P=0.018. NT-proBNP was unchanged 1 [1–12] versus 1 [1–7] pmol/L; P=0.715. Within this group, comparing LVH-positive to LVH-negative (baseline, follow-up) subgroups is not statistically possible as there were only 3/18 that were LVH-positive. Interaction between groups according to ERT status over time is shown in Table 3.
Table 3.
Interaction Between All 3 Groups and Time With Different Parameters and Subgroup Comparisons

Clinical Progression
FASTEX scores, a dynamic measure of overall clinical stability (where interval change of <20% suggest stability), were measured. The rates of a score ≥20% in the groups initiated on ERT, established on ERT, and ERT-naïve were 30%, 33%, and 39%, respectively.
Discussion
In this study, insight into the biology of the FD myocardium is noninvasively gained by serially evaluating the effect of ERT on the FD myocardium after 1 year of initiation using multiparametric CMR and blood biomarkers. These patients were compared with 2 stable control groups—one early untreated group and one advanced treated group. The study found that, over 1 year, early, stable (more female, mainly LVH-negative) treatment-naïve FD have an increase in LV mass and a fall in T1 and a small increase in mean troponin. More advanced, stable on treatment (more male, more LVH-positive) FD has no change in mass, T1, or LGE area—but T2 and troponin increased with increased impairment in myocardial strain (GLS). What did the new ERT treated group do? If ERT had no cardiac effect, then the expectation would be that they would be intermediate between these 2 groups: that is, no or a small increase in mass; no or a small decrease in T1 with no change; or a small increase in T2 and troponin. Instead, we found that in the LVH-positive group, in particular, had a small improvement in LV mass and a small improvement in T1 (partial normalization).
Although we caution against over-interpretation, we believe the best interpretation of these data is this: first, from the advanced stable disease data, it is clear that chronic ERT use does not completely normalize LVH, T1, T2 or troponin, supporting single time point observational data and evidence that ERT in more advanced disease may be less effective.4,21 Second, that the disease is slowly progressing in both early untreated and more advanced treated disease—but in different ways (early disease, more storage, LVH developing; advanced disease more inflammation, increasingly impaired strain; both: slowly increasing troponin). Third, from the newly ERT-treated group (Figure 2), there is a clear signal of an ERT effect with a small reduction in LV mass and normalization of T1 once LVH is present. However, the effect size is small but (Figure 3A and 3B) is in the opposite direction to the treatment-naïve group. Whether the measured effects represent ERT impact solely via endothelial cell clearance (endothelial cell storage will have a small contribution to measured myocardial T1) with downstream alteration in myocardial and systemic perfusion modestly reducing LVH rather than a direct ERT effect on (terminally differentiated) myocytes is unclear. We also acknowledge that the sample size in the newly ERT-treated LVH-negative group is small (n=8); therefore, it is possible that an ERT effect can be seen in this group with a larger sample size.
Figure 3.

Left ventricular mass indexed (LVMi), native T1, T2 at late gadolinium enhancement (LGE) area or basal inferolateral (BIFL) wall if no LGE and troponin levels at baseline and 12 months in all 3 groups. *P<0.05= statistically significant. ERT indicates enzyme replacement therapy.
The changes we observed in myocardial native T1 and T2 times in the study participants were unlikely due to technical instability in the CMR systems across sites or to environmental shifts, since the phantom data suggested a high level of data consistency with no drift over time. Changes were, however, small, each group was also small, and we caution against over-fitting and over-interpreting the data.
The LV mass results with ERT initiation is consistent with previous findings where a decrease in LVMi was observed in FD with LVH and no change observed in those without LVH during the first year,22 although here the changes were small.6,23-25 Our findings are also consistent with a previous 10-year follow-up study where an improvement in LVMi was most apparent in FD after 1 year of ERT treatment particularly in the LVH group, suggesting a temporal effect of ERT.26 After 10 years of ERT, the reduction in LVMi was maintained in males with LVH but not in females, while in the LVH-negative patients, the LVMi was maintained.26 Reductions in LVMi and myocardial Gb3 content have been previously demonstrated by myocardial biopsy.6,7 Data on untreated FD are limited; however, previous studies have demonstrated an increase in LV mass in untreated FD.27,28
Using multiparametric mapping, our group and others have previously shown that T1 is low in FD, even in LVH-negative patients.8,14,29 We have also previously demonstrated that LGE in FD without thinning is likely inflammation using T2 mapping and troponin,10 which is further supported by other studies that included blood inflammatory markers, for example, tumor necrosis factor (TNF), TNF receptor 2, interleukin-6 and matrix metalloprotease-2,30 and myocardial biopsy.31 This is the first prospective study exploring longitudinal change in native T1 and T2 in FD, here also exploring treatment impact. This requires quality control to ensure measurement system stability. The serial measurement supports proposed models of phenotype development developed out of single time point data.32 Future studies—larger, longer, or with new therapeutic approaches (chaperone/gene therapy)—will provide more insights.
Study limitations include no histology, the lack of a full understanding of the quantitative link between storage and T1 lowering, the relatively small sample size reflecting the rarity of the disease, and the study design given the nonavailability of randomization. Patient recruitment will have excluded very advanced disease patients due to contraindications to CMR (for example, patients with permanent pacemaker and implantable cardioverter-defibrillator), and there is a likely recruitment bias whenever patients are recruited from clinic (more likely to recruit those on short follow-up, agreement for research more likely in those worried about their health), meaning control groups may not fully represent population averages—our patients had a more recent diagnosis of FD than we think our total cohort does (median 4 years for controls, 1.4 years for ERT initiators) and high FASTEX scores. The link between pathophysiological process and outcome is unknown.
Conclusions
Over 1 year using multiparametric CMR and biomarkers, the FD myocardial phenotype changes. These changes are different in early (untreated mainly female, mainly LVH-negative) disease compared with more advanced (treated, mainly male, mainly LVH-positive): with early disease, small increases in LV mass and more storage, and with late disease, small increases in inflammation and small reductions in strain—both have small increases in troponin. Intermediate patients starting ERT are different with a small improvement in LV mass and a small improvement in myocardial storage, compatible with a small but clear ERT treatment effect on myocardium. Whether or how these effects translate to patient morbidity or mortality reduction with cumulative lifetime use and whether the effects represent solely endothelial or endothelial and myocardial effects remain unclear.
Acknowledgment
We are grateful for the contributions of the patients and the staff members at all participating Lysosomal Storage Disorder Unit and Inherited Metabolic Disorders Unit.
Sources of Funding
This study is part of the Fabry400 study, which is funded by an investigator-led research grant from Sanofi-Genzyme.
Disclosures
None.
Supplementary Material
Footnotes
The Data Supplement is available at https://www.ahajournals.org/doi/suppl/10.1161/CIRCIMAGING.119.009430.
References
- 1.Zarate YA, Hopkin RJ. Fabry’s disease. Lancet. 2008;372:1427–1435. doi: 10.1016/S0140-6736(08)61589-5. doi: 10.1016/S0140-6736(08)61589-5. [DOI] [PubMed] [Google Scholar]
- 2.Waldek S, Patel MR, Banikazemi M, Lemay R, Lee P. Life expectancy and cause of death in males and females with Fabry disease: findings from the Fabry Registry. Genet Med. 2009;11:790–796. doi: 10.1097/GIM.0b013e3181bb05bb. doi: 10.1097/GIM.0b013e3181bb05bb. [DOI] [PubMed] [Google Scholar]
- 3.Baig S, Edward NC, Kotecha D, Liu B, Nordin S, Kozor R, Moon JC, Geberhiwot T, Steeds RP. Ventricular arrhythmia and sudden cardiac death in Fabry disease: a systematic review of risk factors in clinical practice. Europace. 2018;20(FI2):f153–f161. doi: 10.1093/europace/eux261. doi: 10.1093/europace/eux261. [DOI] [PubMed] [Google Scholar]
- 4.Weidemann F, Niemann M, Breunig F, Herrmann S, Beer M, Störk S, Voelker W, Ertl G, Wanner C, Strotmann J. Long-term effects of enzyme replacement therapy on fabry cardiomyopathy: evidence for a better outcome with early treatment. Circulation. 2009;119:524–529. doi: 10.1161/CIRCULATIONAHA.108.794529. doi: 10.1161/CIRCULATIONAHA.108.794529. [DOI] [PubMed] [Google Scholar]
- 5.Strotmann J, Breunig F, Wanner C, Weidemann F. Progression of Fabry cardiomyopathy. Clin Ther. 2007;29(suppl A):S13–S14. doi: 10.1016/s0149-2918(07)80120-2. doi: 10.1016/s0149-2918(07)80120-2. [DOI] [PubMed] [Google Scholar]
- 6.Hughes DA, Elliott PM, Shah J, Zuckerman J, Coghlan G, Brookes J, Mehta AB. Effects of enzyme replacement therapy on the cardiomyopathy of Anderson-Fabry disease: a randomised, double-blind, placebo-controlled clinical trial of agalsidase alfa. Heart. 2008;94:153–158. doi: 10.1136/hrt.2006.104026. doi: 10.1136/hrt.2006.104026. [DOI] [PubMed] [Google Scholar]
- 7.Eng CM, Guffon N, Wilcox WR, Germain DP, Lee P, Waldek S, Caplan L, Linthorst GE, Desnick RJ International Collaborative Fabry Disease Study Group. Safety and efficacy of recombinant human alpha-galactosidase A replacement therapy in Fabry’s disease. N Engl J Med. 2001;345:9–16. doi: 10.1056/NEJM200107053450102. doi: 10.1056/NEJM200107053450102. [DOI] [PubMed] [Google Scholar]
- 8.Sado DM, White SK, Piechnik SK, Banypersad SM, Treibel T, Captur G, Fontana M, Maestrini V, Flett AS, Robson MD, et al. Identification and assessment of Anderson-Fabry disease by cardiovascular magnetic resonance noncontrast myocardial T1 mapping. Circ Cardiovasc Imaging. 2013;6:392–398. doi: 10.1161/CIRCIMAGING.112.000070. doi: 10.1161/CIRCIMAGING.112.000070. [DOI] [PubMed] [Google Scholar]
- 9.Thompson RB, Chow K, Khan A, Chan A, Shanks M, Paterson I, Oudit GY. T1 mapping with cardiovascular MRI is highly sensitive for Fabry disease independent of hypertrophy and sex. Circ Cardiovasc Imaging. 2013;6:637–645. doi: 10.1161/CIRCIMAGING.113.000482. doi: 10.1161/CIRCIMAGING.113.000482. [DOI] [PubMed] [Google Scholar]
- 10.Nordin S, Kozor R, Bulluck H, Castelletti S, Rosmini S, Abdel-Gadir A, Baig S, Mehta A, Hughes D, Moon JC. Cardiac fabry disease with late gadolinium enhancement is a chronic inflammatory cardiomyopathy. J Am Coll Cardiol. 2016;68:1707–1708. doi: 10.1016/j.jacc.2016.07.741. doi: 10.1016/j.jacc.2016.07.741. [DOI] [PubMed] [Google Scholar]
- 11.Moon JC, Sachdev B, Elkington AG, McKenna WJ, Mehta A, Pennell DJ, Leed PJ, Elliott PM. Gadolinium enhanced cardiovascular magnetic resonance in Anderson-Fabry disease. Evidence for a disease specific abnormality of the myocardial interstitium. Eur Heart J. 2003;24:2151–2155. doi: 10.1016/j.ehj.2003.09.017. doi: 10.1016/j.ehj.2003.09.017. [DOI] [PubMed] [Google Scholar]
- 12.Vijapurapu R, Nordin S, Baig S, Liu B, Rosmini S, Augusto J, Tchan M, Hughes DA, Geberhiwot T, Moon JC, et al. Global longitudinal strain, myocardial storage and hypertrophy in Fabry disease. Heart. 2019;105:470–476. doi: 10.1136/heartjnl-2018-313699. doi: 10.1136/heartjnl-2018-313699. [DOI] [PubMed] [Google Scholar]
- 13.Coats CJ, Parisi V, Ramos M, Janagarajan K, O’Mahony C, Dawnay A, Lachmann RH, Murphy E, Mehta A, Hughes D, et al. Role of serum N-terminal pro-brain natriuretic peptide measurement in diagnosis of cardiac involvement in patients with anderson-fabry disease. Am J Cardiol. 2013;111:111–117. doi: 10.1016/j.amjcard.2012.08.055. doi: 10.1016/j.amjcard.2012.08.055. [DOI] [PubMed] [Google Scholar]
- 14.Nordin S, Kozor R, Baig S, Abdel-Gadir A, Medina-Menacho K, Rosmini S, Captur G, Tchan M, Geberhiwot T, Murphy E, et al. Cardiac phenotype of prehypertrophic fabry disease. Circ Cardiovasc Imaging. 2018;11:e007168. doi: 10.1161/CIRCIMAGING.117.007168. doi: 10.1161/CIRCIMAGING.117.007168. [DOI] [PMC free article] [PubMed] [Google Scholar]
- 15.Maceira AM, Prasad SK, Khan M, Pennell DJ. Normalized left ventricular systolic and diastolic function by steady state free precession cardiovascular magnetic resonance. J Cardiovasc Magn Reson. 2006;8:417–426. doi: 10.1080/10976640600572889. doi: 10.1080/10976640600572889. [DOI] [PubMed] [Google Scholar]
- 16.Piechnik SK, Ferreira VM, Lewandowski AJ, Ntusi NA, Banerjee R, Holloway C, Hofman MB, Sado DM, Maestrini V, White SK, et al. Normal variation of magnetic resonance T1 relaxation times in the human population at 1.5 T using ShMOLLI. J Cardiovasc Magn Reson. 2013;15:13. doi: 10.1186/1532-429X-15-13. doi: 10.1186/1532-429X-15-13. [DOI] [PMC free article] [PubMed] [Google Scholar]
- 17.Rosmini S, Bulluck H, Captur G, Treibel TA, Abdel-Gadir A, Bhuva AN, Culotta V, Merghani A, Fontana M, Maestrini V, et al. Myocardial native T1 and extracellular volume with healthy ageing and gender. Eur Heart J Cardiovasc Imaging. 2018;19:615–621. doi: 10.1093/ehjci/jey034. doi: 10.1093/ehjci/jey034. [DOI] [PMC free article] [PubMed] [Google Scholar]
- 18.Captur G, Gatehouse P, Keenan KE, Heslinga FG, Bruehl R, Prothmann M, Graves MJ, Eames RJ, Torlasco C, Benedetti G, et al. A medical device-grade T1 and ECV phantom for global T1 mapping quality assurance-the T1 Mapping and ECV Standardization in cardiovascular magnetic resonance (T1MES) program. J Cardiovasc Magn Reson. 2016;18:58. doi: 10.1186/s12968-016-0280-z. doi: 10.1186/s12968-016-0280-z. [DOI] [PMC free article] [PubMed] [Google Scholar]
- 19.Camporeale A, Pieroni M, Pieruzzi F, Lusardi P, Pica S, Spada M, Mignani R, Burlina A, Bandera F, Guazzi M, et al. Predictors of clinical evolution in prehypertrophic fabry disease. Circ Cardiovasc Imaging. 2019;12:e008424. doi: 10.1161/CIRCIMAGING.118.008424. doi: 10.1161/CIRCIMAGING.118.008424. [DOI] [PubMed] [Google Scholar]
- 20.Mignani R, Pieruzzi F, Berri F, Burlina A, Chinea B, Gallieni M, Pieroni M, Salviati A, Spada M. FAbry STabilization indEX (FASTEX): an innovative tool for the assessment of clinical stabilization in Fabry disease. Clin Kidney J. 2016;9:739–747. doi: 10.1093/ckj/sfw082. doi: 10.1093/ckj/sfw082. [DOI] [PMC free article] [PubMed] [Google Scholar]
- 21.Weidemann F, Niemann M, Störk S, Breunig F, Beer M, Sommer C, Herrmann S, Ertl G, Wanner C. Long-term outcome of enzyme-replacement therapy in advanced Fabry disease: evidence for disease progression towards serious complications. J Intern Med. 2013;274:331–341. doi: 10.1111/joim.12077. doi: 10.1111/joim.12077. [DOI] [PMC free article] [PubMed] [Google Scholar]
- 22.Arends M, Biegstraaten M, Hughes DA, Mehta A, Elliott PM, Oder D, Watkinson OT, Vaz FM, van Kuilenburg ABP, Wanner C, et al. Retrospective study of long-term outcomes of enzyme replacement therapy in Fabry disease: analysis of prognostic factors. PLoS One. 2017;12:e0182379. doi: 10.1371/journal.pone.0182379. doi: 10.1371/journal.pone.0182379. [DOI] [PMC free article] [PubMed] [Google Scholar]
- 23.Motwani M, Banypersad S, Woolfson P, Waldek S. Enzyme replacement therapy improves cardiac features and severity of Fabry disease. Mol Genet Metab. 2012;107:197–202. doi: 10.1016/j.ymgme.2012.05.011. doi: 10.1016/j.ymgme.2012.05.011. [DOI] [PubMed] [Google Scholar]
- 24.Whybra C, Miebach E, Mengel E, Gal A, Baron K, Beck M, Kampmann C. A 4-year study of the efficacy and tolerability of enzyme replacement therapy with agalsidase alfa in 36 women with Fabry disease. Genet Med. 2009;11:441–449. doi: 10.1097/GIM.0b013e3181a23bec. doi: 10.1097/GIM.0b013e3181a23bec. [DOI] [PubMed] [Google Scholar]
- 25.Wyatt K, Henley W, Anderson L, Anderson R, Nikolaou V, Stein K, Klinger L, Hughes D, Waldek S, Lachmann R, et al. The effectiveness and cost-effectiveness of enzyme and substrate replacement therapies: a longitudinal cohort study of people with lysosomal storage disorders. Health Technol Assess. 2012;16:1–543. doi: 10.3310/hta16390. doi: 10.3310/hta16390. [DOI] [PubMed] [Google Scholar]
- 26.Kampmann C, Perrin A, Beck M. Effectiveness of agalsidase alfa enzyme replacement in Fabry disease: cardiac outcomes after 10 years’ treatment. Orphanet J Rare Dis. 2015;10:125. doi: 10.1186/s13023-015-0338-2. doi: 10.1186/s13023-015-0338-2. [DOI] [PMC free article] [PubMed] [Google Scholar]
- 27.Kampmann C, Linhart A, Baehner F, Palecek T, Wiethoff CM, Miebach E, Whybra C, Gal A, Bultas J, Beck M. Onset and progression of the Anderson-Fabry disease related cardiomyopathy. Int J Cardiol. 2008;130:367–373. doi: 10.1016/j.ijcard.2008.03.007. doi: 10.1016/j.ijcard.2008.03.007. [DOI] [PubMed] [Google Scholar]
- 28.Rombach SM, Smid BE, Linthorst GE, Dijkgraaf MG, Hollak CE. Natural course of Fabry disease and the effectiveness of enzyme replacement therapy: a systematic review and meta-analysis: effectiveness of ERT in different disease stages. J Inherit Metab Dis. 2014;37:341–352. doi: 10.1007/s10545-014-9677-8. doi: 10.1007/s10545-014-9677-8. [DOI] [PubMed] [Google Scholar]
- 29.Pica S, Sado DM, Maestrini V, Fontana M, White SK, Treibel T, Captur G, Anderson S, Piechnik SK, Robson MD, et al. Reproducibility of native myocardial T1 mapping in the assessment of Fabry disease and its role in early detection of cardiac involvement by cardiovascular magnetic resonance. J Cardiovasc Magn Reson. 2014;16:99. doi: 10.1186/s12968-014-0099-4. doi: 10.1186/s12968-014-0099-4. [DOI] [PMC free article] [PubMed] [Google Scholar]
- 30.Yogasundaram H, Nikhanj A, Putko BN, Boutin M, Jain-Ghai S, Khan A, Auray-Blais C, West ML, Oudit GY. Elevated inflammatory plasma biomarkers in patients with fabry disease: a critical link to heart failure with preserved ejection fraction. J Am Heart Assoc. 2018;7:e009098. doi: 10.1161/JAHA.118.009098. doi: 10.1161/JAHA.118.009098. [DOI] [PMC free article] [PubMed] [Google Scholar]
- 31.Frustaci A, Verardo R, Grande C, Galea N, Piselli P, Carbone I, Alfarano M, Russo MA, Chimenti C. Immune-mediated myocarditis in fabry disease cardiomyopathy. J Am Heart Assoc. 2018;7:e009052. doi: 10.1161/JAHA.118.009052. doi: 10.1161/JAHA.118.009052. [DOI] [PMC free article] [PubMed] [Google Scholar]
- 32.Nordin S, Kozor R, Medina-Menacho K, Abdel-Gadir A, Baig S, Sado DM, Lobascio I, Murphy E, Lachmann RH, Mehta A, et al. Proposed stages of myocardial phenotype development in fabry disease. JACC Cardiovasc Imaging. 2019;12(8 pt 2):1673–1683. doi: 10.1016/j.jcmg.2018.03.020. doi: 10.1016/j.jcmg.2018.03.020. [DOI] [PubMed] [Google Scholar]