
Fig. 4.
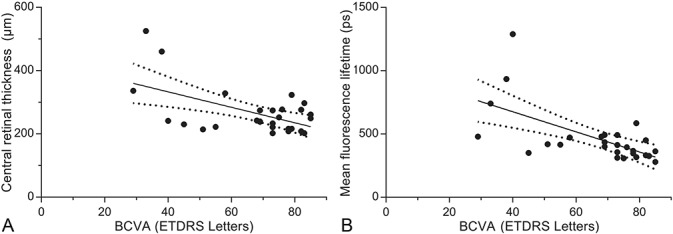
A. Correlation of BCVA (ETDRS letters) with central retinal thickness (r2 = 0.301, P = 0.0025). B. Correlation of BCVA (ETDRS letters) with mean fluorescence lifetimes of the SSC (r2 = 0.39, P = 0.0004).
Official websites use .gov
A
.gov website belongs to an official
government organization in the United States.
Secure .gov websites use HTTPS
A lock (
) or https:// means you've safely
connected to the .gov website. Share sensitive
information only on official, secure websites.
A. Correlation of BCVA (ETDRS letters) with central retinal thickness (r2 = 0.301, P = 0.0025). B. Correlation of BCVA (ETDRS letters) with mean fluorescence lifetimes of the SSC (r2 = 0.39, P = 0.0004).