Abstract
Formation of the three primary germ layers during gastrulation is an essential step in the establishment of the vertebrate body plan and is associated with major transcriptional changes1–5. Global epigenetic reprogramming accompanies these changes6–8, but the role of the epigenome in regulating early cell fate choice remains unresolved, and the coordination between different molecular layers is unclear. Here we describe the first single cell triple-omics map of chromatin accessibility, DNA methylation and RNA expression during the onset of gastrulation in mouse embryos. The initial exit from pluripotency coincides with the establishment of a global repressive epigenetic landscape, followed by the emergence of lineage-specific epigenetic patterns during gastrulation. Notably, cells committed to mesoderm and endoderm undergo widespread coordinated epigenetic rearrangements at enhancer marks, driven by TET-mediated demethylation, and a concomitant increase of accessibility. In striking contrast, the methylation and accessibility landscape of ectodermal cells is already established in the early epiblast. Hence, regulatory elements associated with each germ layer are either epigenetically primed or remodelled prior to cell fate decisions, providing the molecular logic for a hierarchical emergence of the primary germ layers.
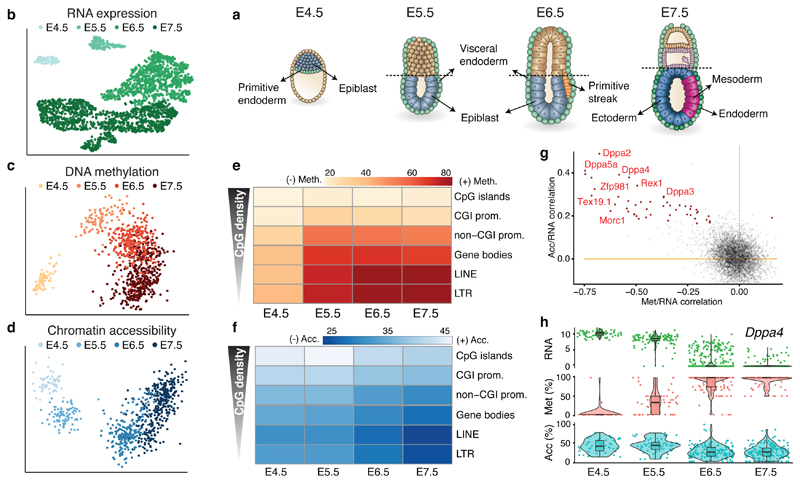
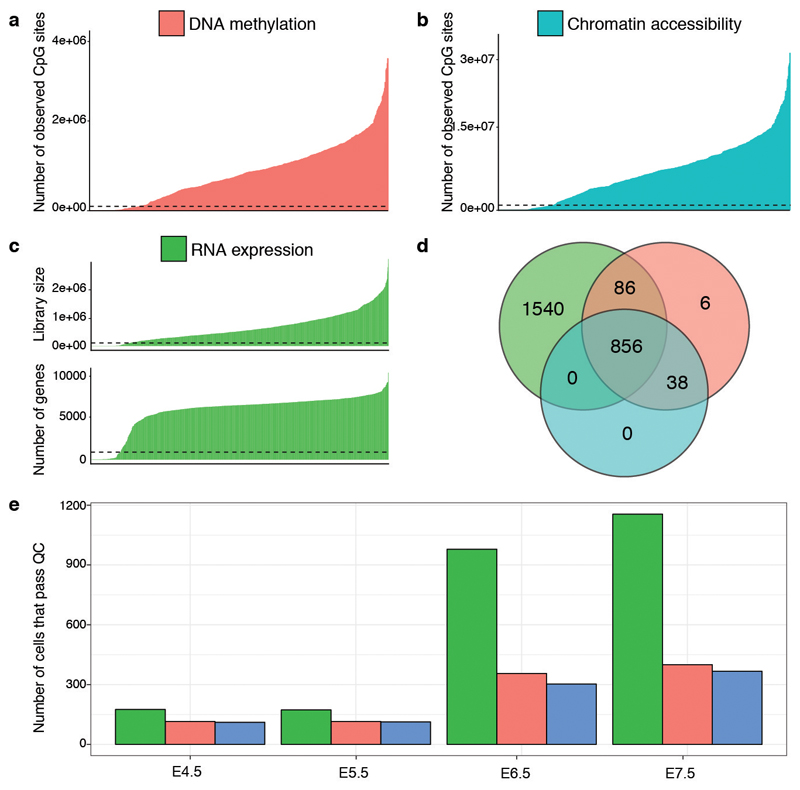
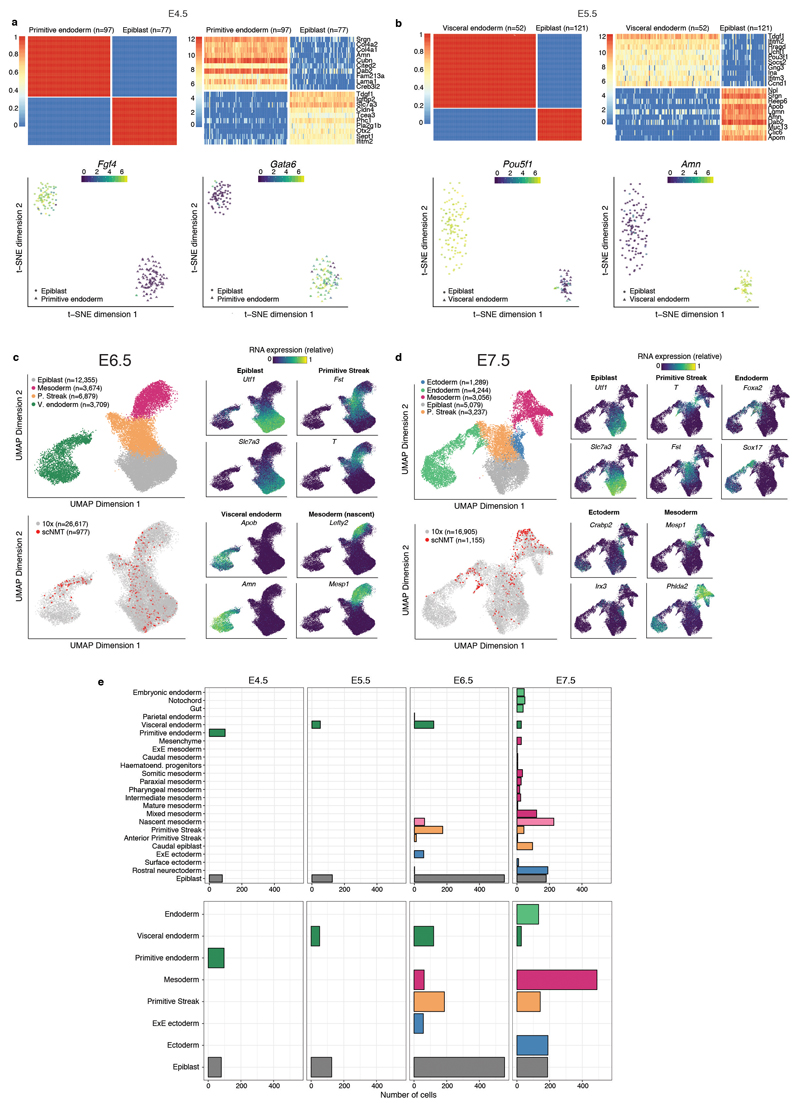
Recent technological advances have enabled the profiling of multiple molecular layers at single cell resolution9–13, providing novel opportunities to study the relationship between the transcriptome and epigenome during cell fate decisions. We applied scNMT-seq (single-cell Nucleosome, Methylome and Transcriptome sequencing12) to profile 1,105 single cells isolated from mouse embryos at four developmental stages (Embryonic Day (E) 4.5, E5.5, E6.5 and E7.5) which comprise the exit from pluripotency and primary germ layer specification (Figure 1a-d, Extended Data Fig. 1). Cells were assigned to a specific lineage by mapping their RNA expression profiles to a comprehensive single-cell atlas4 from the same stages, when available, or using marker genes (Extended Data Fig. 2). By performing dimensionality reduction we show that all three molecular layers contain sufficient information to separate cells by stage (Figure 1b,c,d) and lineage identity (Extended Data Fig. 2,3)
Fig. 1. Single cell triple-omics profiling of mouse gastrulation.
a, Schematic of the developing mouse embryo, with stages and lineages considered in this study labeled. b, Dimensionality reduction of RNA expression data using UMAP. Cells are coloured by stage. Included are 1,061 cells from 28 embryos sequenced using scNMT-seq and 1,419 cells from 26 embryos sequenced using scRNA-seq. (c,d) Dimensionality reduction of c, DNA methylation data and d, chromatin accessibility data from scNMT-seq using Factor analysis (Methods). Cells are coloured by stage. Included are 986 cells for DNA methylation data and 864 cells for chromatin accessibility data. e-f, Heatmap of e, DNA methylation levels (%) and f, chromatin accessibility levels (%) per stage and genomic context. g, Scatter plot of Pearson correlation coefficients of promoter methylation versus RNA expression (x-axis), and promoter accessibility versus RNA expression (y-axis). Each dot corresponds to one gene (n=4927). Black dots depict significant associations for both correlation types (n=39, FDR<10%). Examples of early pluripotency and germ cell markers among the significant hits are labeled. h, Illustrative example of epigenetic repression of Dppa4. Box and violin plots show the distribution of RNA expression (log normalised counts, green), promoter methylation (%, red) and accessibility (%, blue) per stage. Box plots show median levels and the first and third quartile, whiskers show 1.5x the interquartile range. Each dot corresponds to one cell.
Epigenome dynamics on pluripotency exit
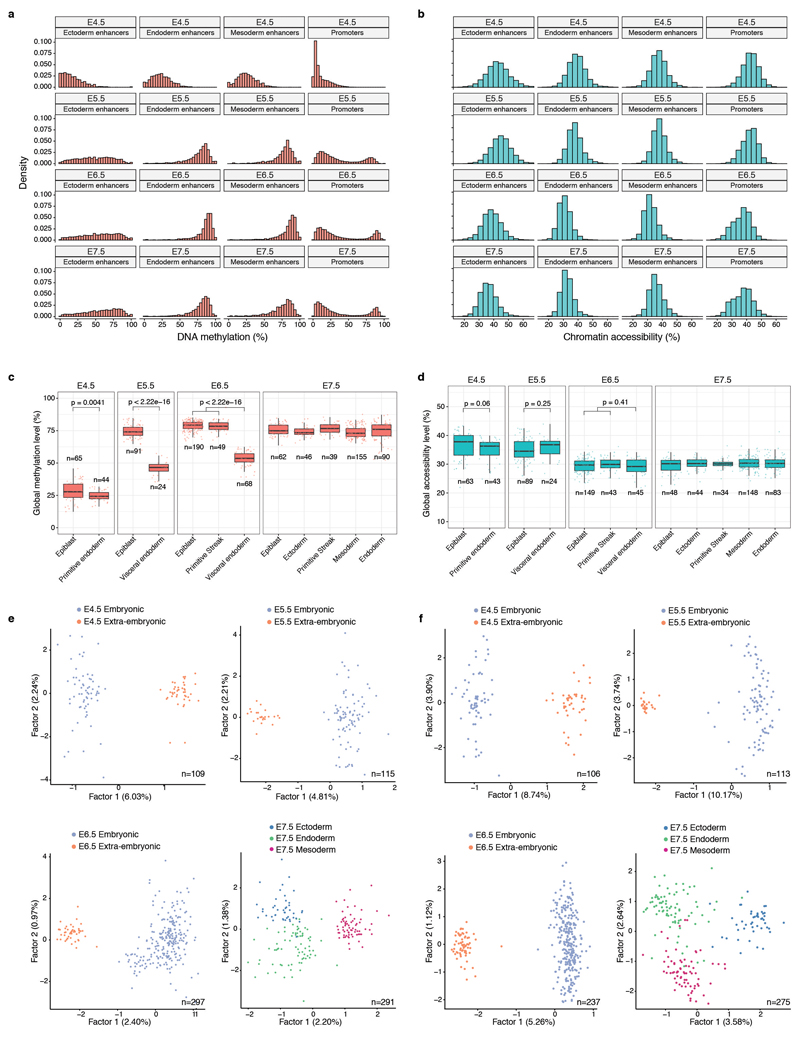
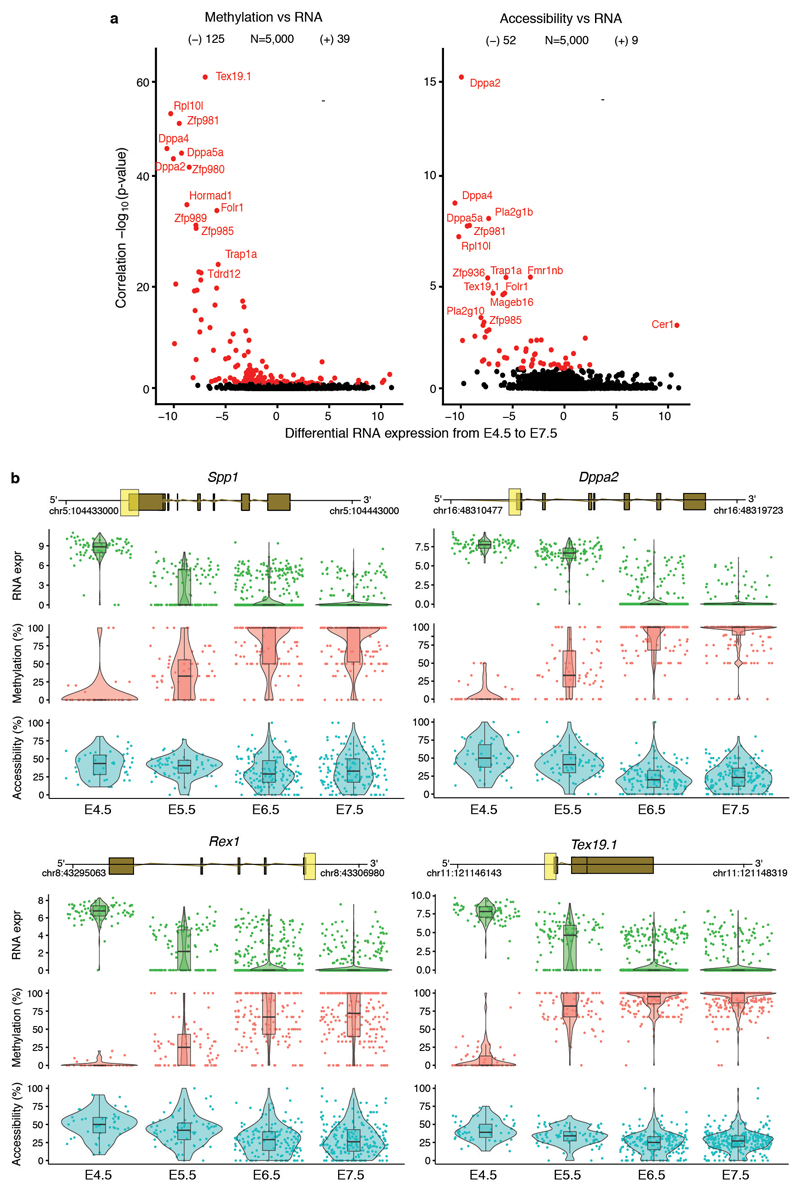
We characterised the changes in DNA methylation and chromatin accessibility during each stage transition. Globally, methylation levels rise from ~25% to ~75% in embryonic tissues and to ~50% in extra-embryonic tissues, mainly driven by a de novo methylation wave from E4.5 to E5.5 that preferentially targets CpG-poor genomic loci6,8,14 (Figure 1e, Extended Data Fig. 3). In contrast, we observed a more gradual decline in global chromatin accessibility from ~38% at E4.5 to ~30% at E7.5 (Figure 1f), with no differences between embryonic and extraembryonic tissues (Extended Data Fig. 3). To relate epigenetic changes to the transcriptional dynamics across stages, we calculated, for each gene and across all embryonic cells, the correlation between its RNA expression and the corresponding DNA methylation or chromatin accessibility levels at its promoter. Out of 5,000 genes tested, we identified 125 genes whose expression shows significant correlation with promoter DNA methylation and 52 that show a significant correlation with chromatin accessibility (Figure 1g, Extended Data Fig. 4, Table S1-2). These loci largely comprise early pluripotency and germ cell markers, such as Dppa4, Rex1, Tex19.1 and Pou3f1 (Figure 1g-h, Extended Data Fig. 4), which are repressed coinciding with the global increase in methylation and decrease in accessibility. In addition, this analysis identified novel genes, including Trap1a and Zfp981 that may have yet unknown roles in development. Notably, only 39 and 9 genes found to be upregulated after E4.5 show a significant correlation between RNA expression and promoter methylation or accessibility, respectively (Extended Data Fig. 4). This suggests that the upregulation of these genes is likely controlled by other regulatory elements.
Characterising germ layer epigenomes
To understand the relationships between all three molecular layers during germ layer commitment we next employed Multi-Omics Factor Analysis (MOFA)15 to cells collected at E7.5. MOFA performs unsupervised dimensionality reduction simultaneously across multiple data modalities, thereby capturing the global sources of cell-to-cell variability via a small number of inferred factors. Importantly, the model leverages multi-modal measurements from the same cells, thereby detecting coordinated changes between the different data modalities.
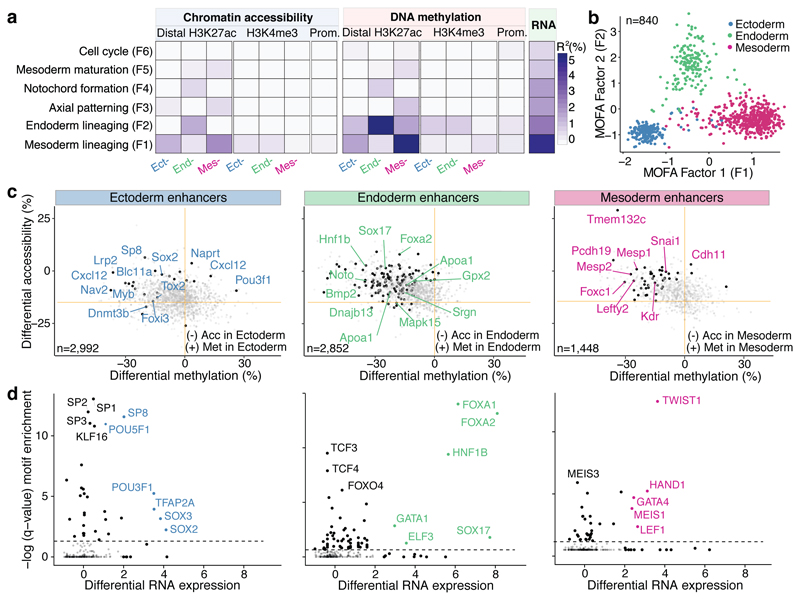
As input to the model we used the RNA-seq data quantified over protein-coding genes and the DNA methylation and chromatin accessibility data quantified over putative regulatory elements. This includes promoters and germ-layer specific ChIP-seq peaks for distal H3K27ac (enhancers) and H3K4me3 (transcription start sites) (Extended Data Fig. 5). MOFA identified 6 factors with the first two (sorted by variance explained) capturing the emergence of the three germ layers (Figure 2a,b). Notably, MOFA links the variation at the gene expression level to concerted methylation and accessibility changes at lineage-specific enhancer marks. In contrast, epigenetic changes at promoters or at H3K4me3-marked regions show much weaker associations with germ layer formation (Figure 2a-c, Extended Data Fig. 6, Table S3-S4). This supports other studies that identified distal enhancers as lineage-driving regulatory regions8,17–19. Inspection of gene-enhancer associations identified enhancers linked to key germ layer markers including Lefty2, Mesp2 (mesoderm), Foxa2, Bmp2 (endoderm), and Blc11a, Sp8 (ectoderm) (Figure 2c, Extended Data Fig. 7). Intriguingly, ectoderm-specific enhancers display fewer associations than their meso- and endoderm counterparts, a finding that is explored further below.
Fig. 2. Multi-omics Factor Analysis reveals coordinated epigenetic and transcriptomic variation at enhancer elements during germ layer commitment.
a, Percentage of variance explained (R2) by each MOFA factor (rows) across data modalities (columns). b, Scatter plot of MOFA Factor 1 (x-axis) and MOFA Factor 2 (y-axis). Cells are coloured according to their lineage assignment (n=840). c, Scatter plots showing differential DNA methylation (%, x-axis) and chromatin accessibility (%, y-axis) at lineage-specific enhancers at E7.5. Comparisons are ectoderm vs non-ectoderm cells (left), endoderm vs non-endoderm cells (middle) and mesoderm vs non-mesoderm cells (right). Black dots depict gene-enhancer pairs with significant changes in RNA expression and methylation or accessibility (Pearson’s chi-squared test, FDR<10%). d, Transcription Factor (TF) motif enrichment at lineage-defining enhancers. Shown is motif enrichment (Fisher’s exact test, -log10 q-value, y-axis) versus differential RNA expression (log fold change, x-axis) of the corresponding TF. The analysis is performed separately for ectoderm- (left), endoderm- (middle) and mesoderm- (right) defining enhancers. TFs with significant motif enrichment (FDR<1%) and differential RNA expression (edgeR quasi-likelihood test, FDR<1%) are labelled.
The four remaining factors correspond to additional transcriptional and epigenetic signatures related to anterior-posterior axial patterning (Factor 3), notochord formation (Factor 4), mesoderm patterning (Factor 5) and cell cycle (Factor 6) (Extended Data Fig. 8).
Finally, we sought to identify transcription factors that could drive or respond to epigenetic changes in germ layer commitment. Integrating differential expression information with motif enrichment at differentially accessible loci revealed that lineage-specific enhancers were enriched for binding sites associated with key developmental transcription factors, including POU3F1, SOX2, SP8 for ectoderm; SOX17, HNF1B, FOXA2 for endoderm; and GATA4, HAND1, TWIST1 for mesoderm (Figure 2d).
Time resolution of enhancer epigenome
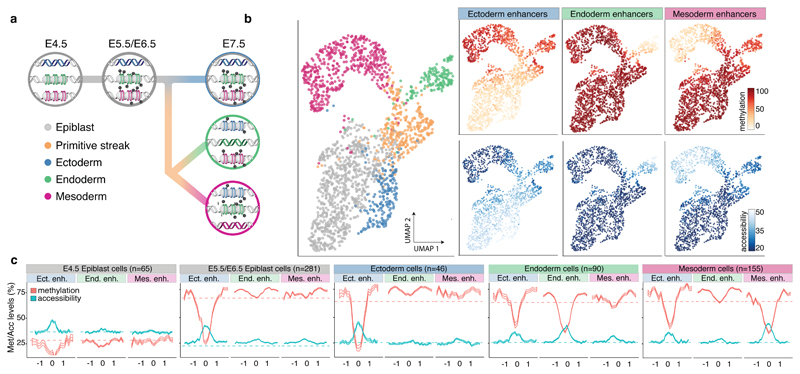
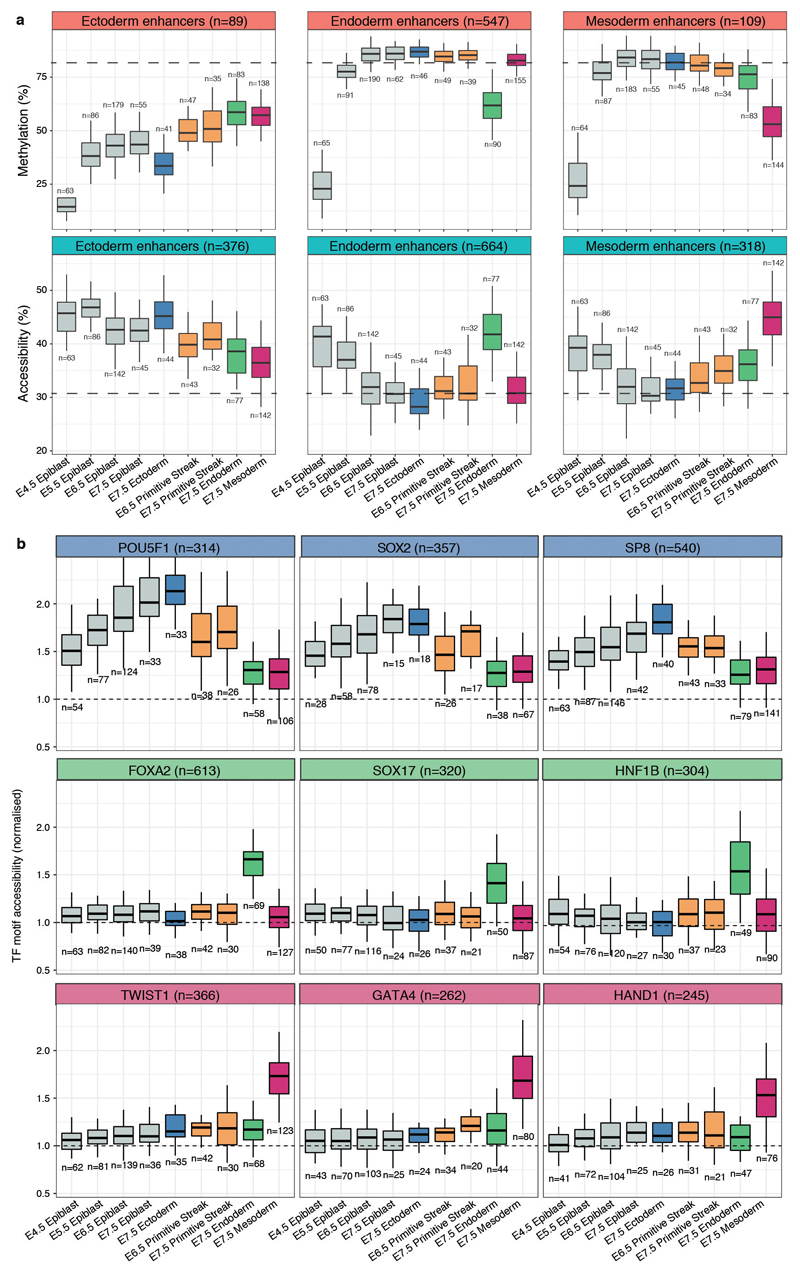
We next asked how the epigenomic patterns associated with germ-layer specification arise during development. DNA methylation levels in endoderm and mesoderm-defining enhancers follow the genome-wide dynamics, increasing from an average of 25% to 80% in all cell types (Figure 3 and Extended Data Fig. 9). Upon lineage specification, they undergo concerted demethylation to ~50% in a cell type specific manner. The opposite pattern is observed for chromatin accessibility; accessibility of meso- and endoderm-defining enhancers initially decreases from ~40% to ~30% (following the genome-wide dynamics) before becoming more accessible (~45%) upon lineage specification. The general dynamics of demethylation and chromatin opening of enhancers during embryogenesis seem thus to be conserved in zebrafish, Xenopus, and mouse19. Reassuringly, when quantifying the H3K27ac levels of lineage-defining enhancers in more differentiated tissues (E10.5 midbrain, E12.5 intestine and E10.5 heart)20,21, we observe that a substantial number of enhancers remain marked by H3K27ac (Extended Data Fig. 5). This indicates that the enhancers established at E7.5 are, to a significant extent, maintained later in development.
Fig. 3. DNA methylation and chromatin accessibility dynamics at lineage-defining enhancers across development.
a, Illustration of the hierarchical model of enhancer epigenetic dynamics associated with germ layer commitment. b, UMAP projection based on the MOFA factors inferred using all embryonic cells (n=1,928). In the left plot the cells are coloured by lineage. In the right plots cells are coloured by average methylation (%, top) or accessibility (%, bottom) at lineage-defining enhancers. For cells with only RNA expression data, the MOFA factors were used to impute the methylation and accessibility levels. c, Profiles of methylation (red) and accessibility (blue) at lineage-defining enhancers across development. Shown are running averages in 50bp windows around the center of the ChIP-seq peaks (2kb upstream and downstream). Solid lines display the mean across cells and shading displays the standard deviation. E5.5 and E6.5 epiblast cells show similar profiles and are combined. Dashed horizontal lines represent genome-wide background levels for methylation (red) and accessibility (blue).
In striking contrast to the mesoderm and endoderm enhancers, the ectoderm enhancers are open and demethylated as early as in the E4.5 epiblast (Figure 3 and Extended Data Fig. 9). Only in cells committed to mesendoderm fate do the ectoderm enhancers become partially repressed. Consistently, when measuring the accessibility dynamics at sites containing sequence motifs for ectoderm-defining TFs (SOX2, SP8), we find that these motifs are already accessible in the epiblast and lose accessibility specifically upon mesendoderm commitment. Conversely, motifs associated with endoderm and mesoderm-defining TFs only become accessible in their respective lineages at E7.5 (Extended Data Fig. 9).
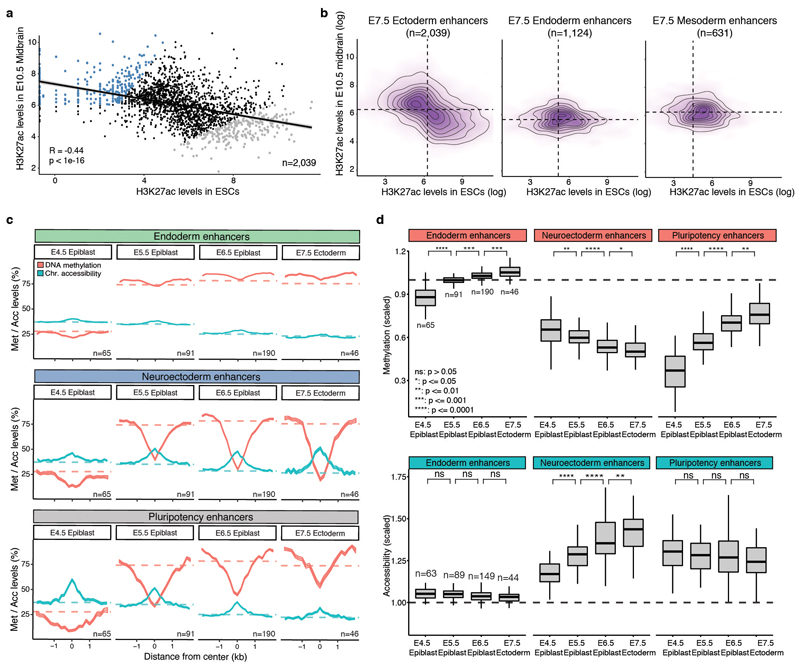
These observations can be explained by either priming of an ectodermal signature in the epiblast or the maintenance of a pluripotency signature in the ectoderm. To investigate this, we overlapped the E7.5 enhancer annotations with published H3K27ac ChIP-seq data from Embryonic Stem Cells (ESCs) and E10.5 midbrain21,22. We observe that the E7.5 ectoderm enhancers display an almost exclusive mixture of pluripotent and neural signatures with notably different DNA methylation and chromatin accessibility dynamics (Extended Data Fig. 10). Pluripotency enhancers show an increase in methylation and a decrease in accessibility over time, suggesting a repression of these enhancers with similar dynamics to promoters of pluripotency genes (Figure 1g-h). In contrast, neuroectoderm enhancers remain hypomethylated and accessible from E4.5 (Extended Data Fig. 10).
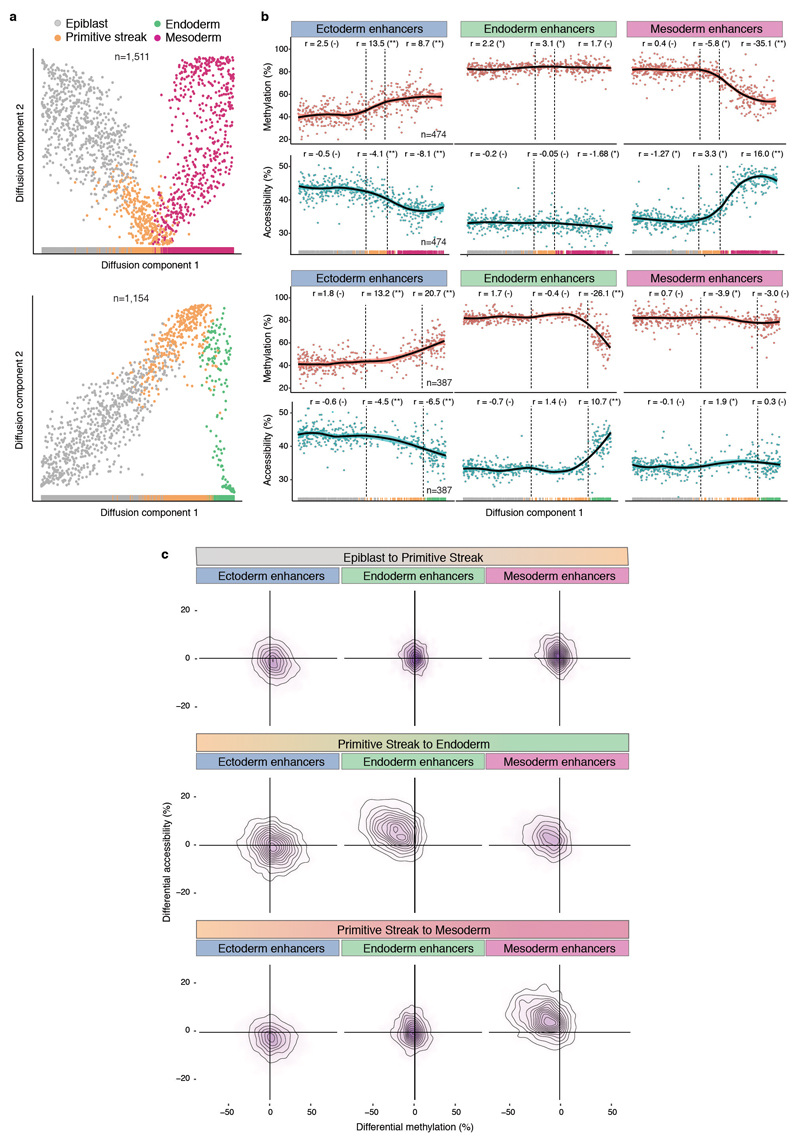
Lastly, to infer temporal dependencies of enhancer activation, we used the RNA expression profiles to order cells across two trajectories, corresponding to mesoderm and endoderm commitment (Extended Data Fig. 11). By plotting the average DNA methylation and chromatin accessibility for each class of lineage-defining enhancers we find that the methylation gain (and accessibility loss) of ectoderm enhancers precedes the demethylation (and accessibility gain) of mesoderm and endoderm enhancers. In both cases, changes in methylation and accessibility co-occur, suggesting tight co-regulation of the two epigenetic layers.
TET enzymes drive enhancer demethylation
TET methylcytosine dioxygenase enzymes have been implicated in enhancer demethylation23,24, and loss-of-function experiments suggest that TET enzymes are vital for gastrulation25,26. To test whether TET enzymes drive lineage-specific demethylation, we differentiated both wild type (WT), and ESCs that were deficient for all three TET enzymes (Tet TKO) into embryoid bodies (EBs) and subjected the cells to scNMT-seq.
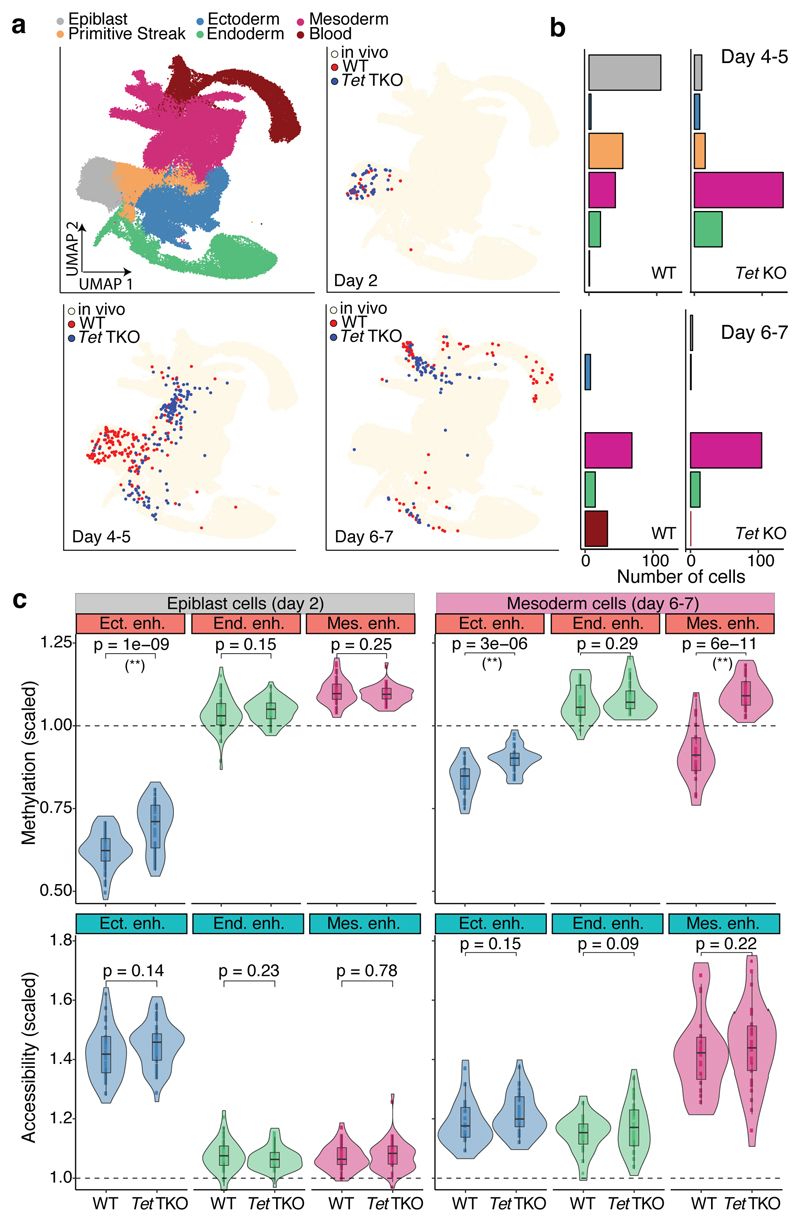
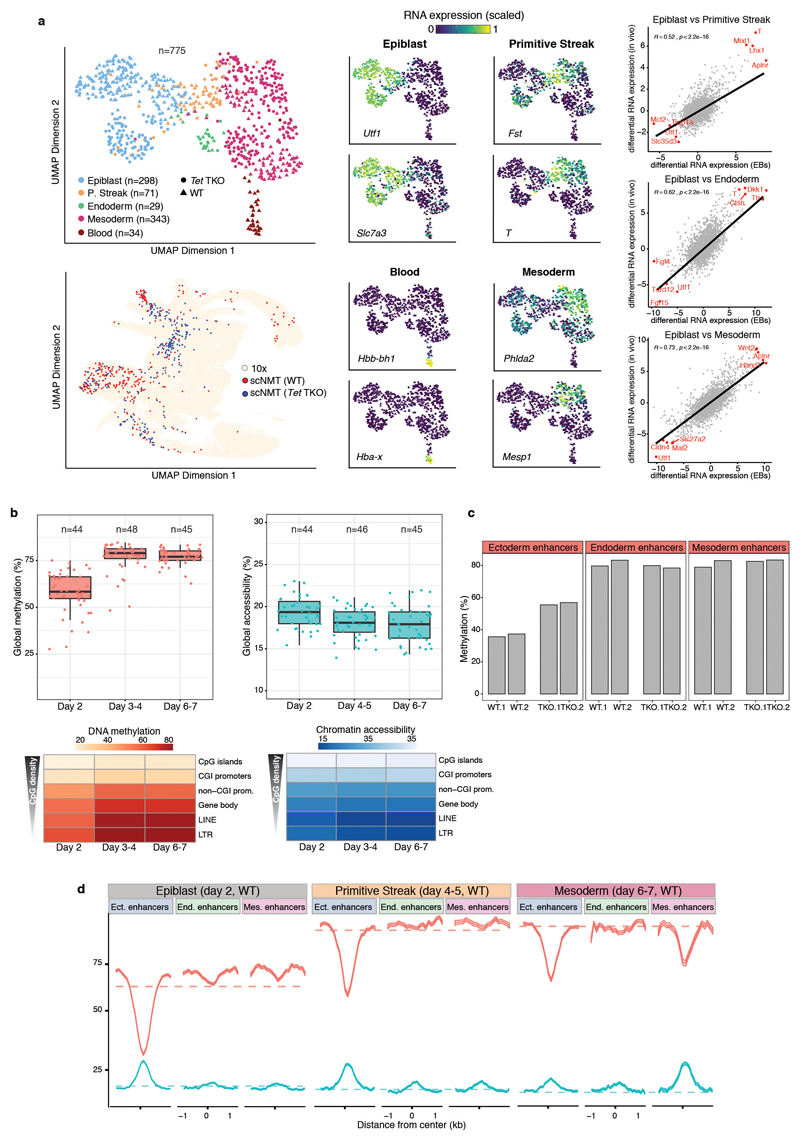
Mapping the RNA expression profiles to the in vivo gastrulation atlas shows that WT EBs recapitulate the transition from a pluripotent epiblast at day 2 of differentiation to the primitive streak between days 4 and 5 (Figure 4a-b). At days 6 and 7 we observe the emergence of mature mesoderm structures including hematopoietic cell types (Figure 4a-b and Extended Data Fig. 12). Expression of marker genes is restricted to the expected lineage and differential expression between lineages agrees with the in vivo results (Extended Data Fig. 12). Moreover, the global dynamics of DNA methylation and chromatin accessibility in WT EBs substantially mirror the in vivo data (Extended Data Fig. 12).
Fig. 4. TET enzymes are required for efficient demethylation of mesoderm-defining enhancers and subsequent blood differentiation in embryoid bodies.
a, UMAP projection of stages E6.5 to E8.5 of the atlas data set (no extraembryonic cells). In the top left plot cells are coloured by lineage assignment. The remaining plots show, for different days of EB differentiation, the nearest neighbours that were used to assign cell type labels to the EB data set. WT cells are red (n=438),Tet TKO cells are blue (n=436). We grouped days 4-5 and 6-7 together due to similarity in the cell types recovered. b, Bar plots showing the cell type numbers for each day of EB differentiation, grouped by genotype. c, Overlaid box and violin plots display the distribution of DNA methylation (top) or chromatin accessibility values (bottom) for lineage-defining enhancers in epiblast-like cells at day 2 (n=46 for WT and n=44 TKO) and mesoderm-like cells at days 6-7 (n=22 for WT and n=32 TKO). The y-axis shows the methylation or accessibility (%) scaled to the genome-wide levels. P-values resulting from comparisons of group means (t-test) are displayed. Asterisks denote significant differences (FDR<10%).
Comparison of WT with Tet TKO differentiation in the epiblast-like cells at day 2 revealed higher DNA methylation in ectoderm enhancers in the Tet TKO cells, but no differences in mesoderm or endoderm enhancers (Figure 4c). Reassuringly, re-analysis of methylation measurements from Tet TKO embryos confirms that the same pattern is observed in vivo25 (Extended Data Fig. 12). Impaired demethylation is also associated with differences in differentiation timing, with Tet TKO cells showing an increased proportion of early mesendoderm differentiation at day 4 to 5 (Figure 4a-b). However, at day 6 to 7 Tet TKO cells fail to properly demethylate lineage-specific enhancers and do not differentiate into mature mesodermal cell types (Figure 4c).
These observations indicate that demethylation of lineage-defining enhancers is at least partially driven by TET proteins. Although enhancer demethylation does not seem to be required for early mesoderm commitment, the lack of hematopoietic cells in the Tet TKO cells suggests demethylation may be important for subsequent lineage progression. Consistently, Tet TKO embryos are able to initiate gastrulation, but by E8.5 they display defects in mesoderm-derived cell types, including heart or somites25.
Discussion
Our results show that pluripotent epiblast cells are epigenetically primed for an ectoderm fate as early as E4.5. This finding supports the existence of a ‘default’ path in the Waddington landscape, providing a potential mechanism for the phenomenon of ‘default’ differentiation of neurectodermal tissue from ESCs27,28. In contrast, endoderm and mesoderm are actively diverted from the default path by demethylation and chromatin opening at the corresponding enhancer elements17,24,25. Hence, the germ layer epigenome is defined during gastrulation by a hierarchical, or asymmetric, epigenetic model (Figure 3a).
More generally, our discovery has important implications for the role of the epigenome in defining lineage commitment. We speculate that asymmetric epigenetic priming, where early progenitors are epigenetically primed for a default cell type, may be a more general feature of lineage commitment in vivo. In support of this hypothesis, two recent studies identified default pathways in foregut specification and osteogenesis29,30. Future studies that use multi-omics approaches to dissect cell populations have the potential to transform our understanding of cell fate decisions, with important implications for stem cell biology.
Methods
Embryos and single cell isolation
All mice used in this study were C57BL/6Babr and were bred and maintained in the Babraham Institute Biological Support Unit. Ambient temperature was ~19-21°C and relative humidity 52%. Lighting was provided on a 12 hour light: 12 hour dark cycle including 15 min ‘dawn’ and ‘dusk’ periods of subdued lighting. After weaning, mice were transferred to individually ventilated cages with 1-5 mice per cage. Mice were fed CRM (P) VP diet (Special Diet Services) ad libitum and received seeds (e.g. sunflower, millet) at the time of cage-cleaning as part of their environmental enrichment. All mouse experimentation was approved by the Babraham Institute Animal Welfare and Ethical Review Body. Animal husbandry and experimentation complied with existing European Union and United Kingdom Home Office legislation and local standards. Sample sizes were determined in order to obtain at least 50 cells for each germ layer. No randomisation or blinding was performed. Sex of embryos was not known at the time of collection. Single-cells from E4.5 to E5.5 embryos were collected as described2. E6.5 and E7.5 embryos were dissected to remove extraembryonic tissues and dissociated in TryplE for 10 minutes at room temperature. Undigested portions were physically removed and the remainder filtered through a 30 μm filter prior to isolation using flow cytometry.
Tet TKO cell culture
Tet[1-/- ,2-/- ,3-/-] (C57BL6/129/FVB) and matching wild-type mouse ES cells31 were cultured in 2i+LIF media (serum-free N2B27 (N2 & B27; Gibco) supplemented with LIF, MEK inhibitor PD0325901 (1 µM) and GSK3 inhibitor CHIR99021 (3 µM), (all Department of Biochemistry, University of Cambridge). ES cells were cultured on tissue culture plastic pre-coated with 0.1% gelatine in H2O and were passaged when approaching confluence (2-3d).
For the embryoid body (EB) differentiation assay, 2x10⁴ ES cells were collected in serum media consisting of DMEM (Life Technologies, 10566-016), 15% Fetal Bovine Serum (FBS) (Gibco, 10270106), 1x non-essential amino acids (NEAA) (Life Technologies, 11140050), 0.1 mM 2-mercaptoethanol (Life Technologies, 31350-010), 2 mM L-Glutamine (Life Technologies, 25030-024) in ultra-low attachment 96-well plates (Sigma-Aldrich, CLS7007). All cells were cultured in a humidified incubator at 37°C in 5% CO2and 20% O2. EBs were collected 2, 4, 5, 6 and 7 days after induction of differentiation and dissociated into single cells using accutase prior to flow sorting. Cell lines were subject to routine mycoplasma testing using the MycoAlert testing kit (Lonza) and tested negative. Cell lines were not authenticated.
scNMT-seq library preparation
Single-cells were flow-sorted (E6.5 and E7.5 stages, using a BD Influx or BD Aria III) or manually picked when cell numbers were too low (E4.5, E5.5). Cells were isolated into 96 well PCR plates containing 2.5μl of methylase reaction buffer (1 × M.CviPI Reaction buffer (NEB), 2 U M.CviPI (NEB), 160 μM S-adenosylmethionine (NEB), 1 U μl−1 RNasein (Promega), 0.1% IGEPAL CA-630 (Sigma)). Samples were incubated for 15 minutes at 37°C to methylate accessible chromatin before the reaction was stopped with the addition of RLT plus buffer (Qiagen) and samples frozen down and stored at -80°C prior to processing. Poly-A RNA was captured on oligo-dT conjugated to magnetic beads and amplified cDNA was prepared according to the G&T-seq32 and Smartseq2 protocols33. The lysate containing gDNA was purified on AMPureXP beads before bisulfite-seq libraries were prepared according to the scBS-seq protocol34.
A subset of embryo cells were processed for scRNA-seq only (1,419 cells after QC). These followed the same protocol but we discarded the gDNA after separation.
A full step-by-step protocol for scNMT-seq is available online: dx.doi.org/10.17504/protocols.io.6jnhcme.
Sequencing
All sequencing was carried out on a NextSeq500 instrument. BS-seq libraries were sequenced in 48-plex pools using 75bp paired end reads in high-output mode. RNA-seq libraries were pooled as either 384 plexes and sequenced using 75bp paired end reads in high-output mode or 192-plexes and sequenced using 75bp paired-end reads in mid-output mode. This yielded a mean raw sequencing depth of 8.5 million (BS-seq) and 1 million (RNA-seq) paired-end reads per cell.
RNA-seq alignment and quantification
RNA-seq libraries were aligned to the GRCm38 mouse genome build using HiSat235 (v2.1.0) using options --dta --sp 1000,1000 --no-mixed --no-discordant, yielding a mean of 681,000 aligned reads per cell. Subsequently, gene expression counts were quantified from the mapped reads using featureCounts36 with the Ensembl gene annotation37 (version 87). Only protein-coding genes matching canonical chromosomes were considered. The read counts were log-transformed and size-factor adjusted38.
BS-seq alignment and methylation/accessibility quantification
BS-seq libraries were aligned to the bisuflite converted GRCm38 mouse genome using Bismark39 (v0.19.1) in single-end nondirectional mode. Following the removal of PCR duplicates, we retained a mean of 1.6 million reads per cell. Methylation calling and separation of endogenous methylation (from A-C-G and T-C-G trinucleotides) and chromatin accessibility (G-C-A, G-C-C and G-C-T trinucleotides) was performed with Bismark using the --NOMe option of the coverage2cytosine script.
Following our previous approach40, individual CpG or GpC sites in each cell were modelled using a binomial distribution where the number of successes is the number of reads that support methylation and the number of trials is the total number of reads. A CpG methylation or GpC accessibility rate for each site and cell was calculated by maximum likelihood. The rates were subsequently rounded to the nearest integer (0 or 1).
When aggregating over genomic features, CpG methylation and GpC accessibility rates were computed assuming a binomial model, with the number of trials being the number of observed CpG sites and the number of successes being the number of methylated CpGs. Importantly, this implies that DNA methylation and chromatin accessibility is quantified as a rate (or a percentage). We avoid binarising DNA methylation and chromatin accessibility values into “low” or “high” states as it is not a good representation of the continuous nature of the data (Extended Data Fig. 3).
ChIP-seq data processing
ChIP-seq data were obtained from the Gene Expression Omnibus under accession GSE125318). Reads were trimmed using Trim Galore (v0.4.5, cutadapt 1.15, single end mode) and mapped to M. musculus GRCm38 using Bowtie241 (v2.3.2). Read 2 was excluded from the analysis for paired end samples because of low quality scores (Phred <25). All analyses were performed using SeqMonk (https://www.bioinformatics.babraham.ac.uk/projects/seqmonk/). For quantitation, read length was extended to 300 bp and regions of coverage outliers and extreme strand bias excluded as these were assumed to be alignment artefacts. Comparison of data sets with different read lengths did not reveal major mapping differences, and thus, mapped, extended reads were merged for samples that were sequenced across more than one lane. Samples were overall similar regarding total mapped read numbers, distribution of reads and ChIP enrichment.
To best represent the underlying ChIP-seq signal, different methods to define enriched genomic regions were used for H3K4me3 and H3K27ac marks. For H3K4me3, a SeqMonk implementation of MACS42 with the local rescoring step omitted was used (p<10-15, fragment size 300 bp), and enriched regions closer than 100 bp were merged. Peaks were called separately for each lineage. For H3K27ac, reads were quantitated per 500 bp tiles correcting per million total reads and excluding duplicate reads. Smoothing subtraction quantitation was used to identify local maxima (value > 1), and peaks closer than 500 bp apart were merged. Lineage-specific peak annotations exclude peaks that are also present in one of the other lineages, and only peaks present in both replicates were considered (Extended Data Fig. 5).
Publicly available ChIP-seq libraries for H3K27ac20–22were processed with Trim Galore and Bowtie2 (see above), and analysed in Seqmonk. Read counts were determined for 1 kb non-overlapping tiles and, separately, for lineage-specific enhancers (average length 1.2 kb). The genomic tiles were used to determine the distribution of H3K27ac across the genome. Enhancers were classified as marked if their read counts were within the top 5% of the distribution.
scRNA-seq and scBS-seq quality control
For RNA expression, cells with less than 100,000 mapped reads and with less than 500 expressed genes were excluded. For DNA methylation and chromatin accessibility, cells with less than 50,000 CpG sites and 500,000 GpC sites covered were discarded, respectively (Extended Data Fig. 1).
Lineage assignment using RNA expression
Lineages were assigned by mapping the RNA expression profiles to a comprehensive single-cell atlas from the same stages4, when available (stages E6.5 and E7.5), or by SC343 elsewise (stages E4.5 and E5.5) (Extended Data Fig. 2). Extraembryonic cells were identified by these methods and excluded from further analyses.
The mapping was performed by matching mutual nearest neighbours44. First, count matrices from both experiments were concatenated and normalised together. Highly variable genes were selected38 from the resulting expression matrix and were used as input for principal components analysis. Subsequently, batch correction was applied to remove the technical variability between the two experiments and a k-nearest neighbours graph was computed between them. For each scNMT-seq cell, the cell type was selected as the mode from a Dirichlet distribution given by the cell type distribution of the top 30 nearest neighbours in the atlas (i.e. majority voting).
Correlation analysis
To identify genes with an association between the mRNA expression and promoter epigenetic status, we calculated, for each gene, the correlation coefficient across all cells between its RNA expression and the corresponding DNA methylation or chromatin accessibility levels at the gene’s promoter (+/- 2kb around transcription start site).
As a filtering criterion, we required, for each genomic feature, a minimum number of 1 CpG (methylation) or 5 GpC (accessibility) measurements in at least 50 cells. Additionally, the top 5,000 most variable genes (across all cells) were selected, according to the rationale of independent filtering45. Two-tailed Student’s t-tests were performed to test for evidence against the null hypothesis of no correlation, and p-values were adjusted for multiple testing using the Benjamini–Hochberg procedure46.
Differential DNA methylation and chromatin accessibility analysis
Differential analysis of DNA methylation and chromatin accessibility was performed using a Fisher exact test independently for each genomic element. Cells were aggregated into two exclusive groups and, for a given genomic element, we created a contingency table by aggregating (across cells) the number of methylated and unmethylated nucleotides. Multiple testing correction was applied using the Benjamini-Hochberg procedure. As a filtering criteria, we required 1 CpG (methylation) and 5 GpC (accessibility) observations in at least 10 cells per group. Non-variable regions were filtered out prior to differential testing.
Motif enrichment
To find transcription factor motifs enriched in lineage-associated sites, we used H3K27ac sites that were identified as differentially accessible between lineages as explained above. We tested for enrichment over a background of all H3K27ac sites using ame (meme suite47 v4.10.1) with parameters --method fisher --scoring avg. Position frequency matrices were downloaded from the Jaspar core vertebrates database48. This is a curated list of experimentally derived binding motifs and not an exhaustive set which means that some important transcription factors will not be analysed due to absence of their motifs.
Differential RNA expression analysis
Differential RNA expression analysis between pre-specified groups of interest was performed using the genewise negative binomial generalised linear model with quasi-likelihood test from edgeR49. Significant hits were called with a 1% False Discovery Rate (Benjamini-Hochberg procedure) and a minimum log2 fold change of 1. Genes with low expression (mean log2 counts < 0.5) were filtered out prior to differential testing45.
Dimensionality reduction for DNA methylation and chromatin accessibility data using Bayesian Factor Analysis
To handle the large amount of missing values in DNA methylation and chromatin accessibility data we used a linear Bayesian Factor Analysis model15. The linearity assumption renders the model output directly interpretable, and more robust to changes in hyperparameters than non-linear methods, particularly with small number of cells. We trained every model using the top 5,000 most variable features and we constrained the latent space to two latent factors, which were used for visualisation (Figure 1c-d, Extended Data Fig. 3). Variance explained estimates were computed using the coefficient of determination as described in 15.
Multi-Omics Factor Analysis (MOFA)
The input to MOFA is a list of matrices, where each matrix represents a different data modality. RNA expression measurements were defined as one data modality. For DNA methylation and chromatin accessibility we defined separate matrices for promoters, distal H3K27ac sites (enhancers) and H3K4me3 (transcription start sites, TSS). Promoters were defined as a bidirectional 2kb window around the TSS of protein-coding genes. For each genomic context, we created a DNA methylation matrix and a chromatin accessibility matrix by quantifying M-values for each cell and genomic element.
As a filtering criteria, genomic features were required to have a minimum of 1 CpG (methylation) or 5 GpC (accessibility) observed in at least 25 cells. Genes were required to have a minimum cellular detection rate of 25%. In addition, to reduce computational complexity, the top 1,000 most variable features were selected per view. Similarly, the top 2,500 most variable genes were selected for RNA expression.
Similar to most latent dimensionality reduction methods, the optimisation procedure of MOFA is not guaranteed to find a global optimum. Following15, model selection was performed by selecting the model with the highest Evidence Lower Bound out of 10 trials.
The number of factors was calculated by requiring a minimum of 1% variance explained in the RNA. The robustness of factors across trials was assessed by calculating the correlation coefficients between every pair of factors across the 10 trials. All inferred factors were consistently found in all model instances.
The downstream characterisation of the model output included several analyses: (a) variance decomposition: quantification of the fraction of variance explained (R2) by each factor in each view, using a coefficient of determination15. (b) Visualisation of weights/loadings: the model learns a weight for every feature in each factor, which can be interpreted as a measure of feature importance. Features with large weights (in absolute value) are highly correlated with the factor values. (c) Visualisation of factors: each MOFA factor captures a different dimension of cellular heterogeneity. All together, they define a latent space that maximises the variance explained in the data (under some important sparsity assumptions15). The cells can be visualised in the latent space by plotting scatter plots of combinations of factors. (d) Gene set enrichment analysis: when inspecting the weights for a given factor, multiple features can be combined into a gene set-based annotation. For a given gene set G, we evaluate its significance via a parametric t-test (two-sided), where we compare the mean of the weights of the foreground set (features that belong to the set G) versus the mean of the weights in the background set (features that do not belong to the set G). Resulting p-values are adjusted by multiple testing using the Benjamini-Hochberg procedure from which significant pathways are called (FDR<10%).
Extended Data
Extended Data Fig. 1. scNMT-seq quality controls.
a-b, Number of observed cytosines in (a) CpG (red) or (b) GpC (blue) contexts respectively. Each bar corresponds to one cell. Cells are sorted by total number of CpG or GpC sites, respectively. Cells below the dashed line were discarded on the basis of poor coverage. c, RNA library size per cell. Top, total number of reads and bottom, number of expressed genes (read counts>0). Cells below the dashed line were discarded on the basis of poor coverage. d, Venn Diagram displaying the number of cells that pass quality control for RNA expression (green), DNA methylation (red), chromatin accessibility (blue). e, Number of cells that pass quality control for each molecular layer, grouped by stage. Note that for 1,419 out of 2,524 total cells only the RNA expression was sequenced.
Extended Data Fig. 2. Cell type assignments based on RNA expression.
a-b, Lineage assignment of a, E4.5 cells (N=175) and b, E5.5 cells (N=173). Shown are (top left) SC3 consensus plots representing the similarity between cells based on the averaging of clustering results from multiple combinations of clustering parameters. (Top right) Heatmap showing the RNA expression (log normalised counts) of the ten most informative gene markers for each cluster. (Bottom left) t-SNE representation of the RNA expression data coloured by the expression of Fgf4 and Pou5f1, known E4.5 and E5.5 epiblast markers50,51, respectively. (Bottom right) t-SNE representation of the RNA expression data coloured by the expression of Gata6 and Amn, known E4.5 primitive endoderm and E5.5 visceral endoderm markers52. c-d, Lineage assignment of c, E6.5 cells (N=977) and d, E7.5 cells (N=1,155). Left: UMAP projection of the atlas data set (stages E6.5 to E7.0 to assign E6.5 cells and E7.0 to E8.0 to assign E7.5 cells). In the top-left panel the cells are coloured by lineage assignment. In the bottom-left panel, the cells coloured in red are the nearest neighbors that were used to transfer labels to the scNMT-seq data set. In the right panels cells are coloured by the relative RNA expression of lineage marker genes. e, Left: Number of cells per lineage, using the maximally resolved cell types reported in4. Right: Number of cells per lineage after aggregation of cell types belonging to the same germ layer or extraembryonic tissue type, as used in this study.
Extended Data Fig. 3. Global methylation and chromatin accessibility dynamics.
a-b, Distribution of a, DNA methylation and b, chromatin accessibility levels per stage and genomic context. When aggregating over genomic features, CpG methylation and GpC accessibility levels (%) are computed assuming a binomial model, with the number of trials being the total number of observed CpG (or GpC) sites and the number of successes being the number of methylated CpG (or GpC) sites (Methods). Importantly, this implies that DNA methylation and chromatin accessibility are quantified as a percentage and are not binarised into ”low” or ”high” states. As this Extended Data Fig. shows, the distribution of DNA methylation and chromatin accessibility across loci (after aggregating measurements across all cells) is largely continuous and does not show bimodality. Hence, a binarisation approach that is sometimes used for differentiated cell types would not be a good representation of the data. c-d, Box plots showing the distribution of genome-wide c, CpG methylation levels or d, GpC accessibility levels per stage and lineage. Each dot represents a single cell. At a significance threshold of 0.01 (t-test, two-sided), the global DNA methylation levels differ between embryonic and extraembryonic lineages, but the global chromatin accessibility levels do not. e-f, Dimensionality reduction of e, DNA methylation and f, chromatin accessibility data. To perform dimensionality reduction while handling the large amount of missing values we used a Bayesian Factor Analysis model (Methods). Shown are scatter plots of the first two latent factors (sorted by variance explained) for models trained with cells from the indicated stages. From E4.5 to E6.5, cells are coloured by embryonic and extraembryonic origin. At E7.5 cells are coloured by the primary germ layer. All lineage assignments were made using the cells’ corresponding RNA expression level (Extended Data Fig. 2). The fraction of variance explained by each factor is displayed in parentheses. The input data was M-values quantified over DNase I hypersensitive sites profiled in Embryonic Stem Cells.
Extended Data Fig. 4. DNA methylation and chromatin accessibility changes in promoters are associated with repression of early pluripotency and germ cell markers.
a, Volcano plots display differential RNA expression levels between E4.5 and E7.5 cells (in log2 counts, x-axis) versus adjusted correlation p-values (FDR < 10% in red, Benjamini-Hochberg correction). Left plot shows DNA methylation versus RNA expression correlations and the right plot shows chromatin accessibility versus RNA expression. Negative values for differential RNA expression indicates higher expression in E4.5, whereas positive values indicate higher expression in E7.5. b, Illustrative examples of epigenetic repression of early pluripotency and germ cell markers. Box and violin plots show the distribution of RNA expression (log2 counts, green), DNA methylation (%, red) and chromatin accessibility (%, blue) levels per stage. Box plots show median coverage and the first and third quartile, whiskers show 1.5x the interquartile range. Each dot corresponds to one cell. For each gene a genomic track is shown on top, where the promoter region that is used to quantify DNA methylation and chromatin accessibility levels is highlighted in yellow.
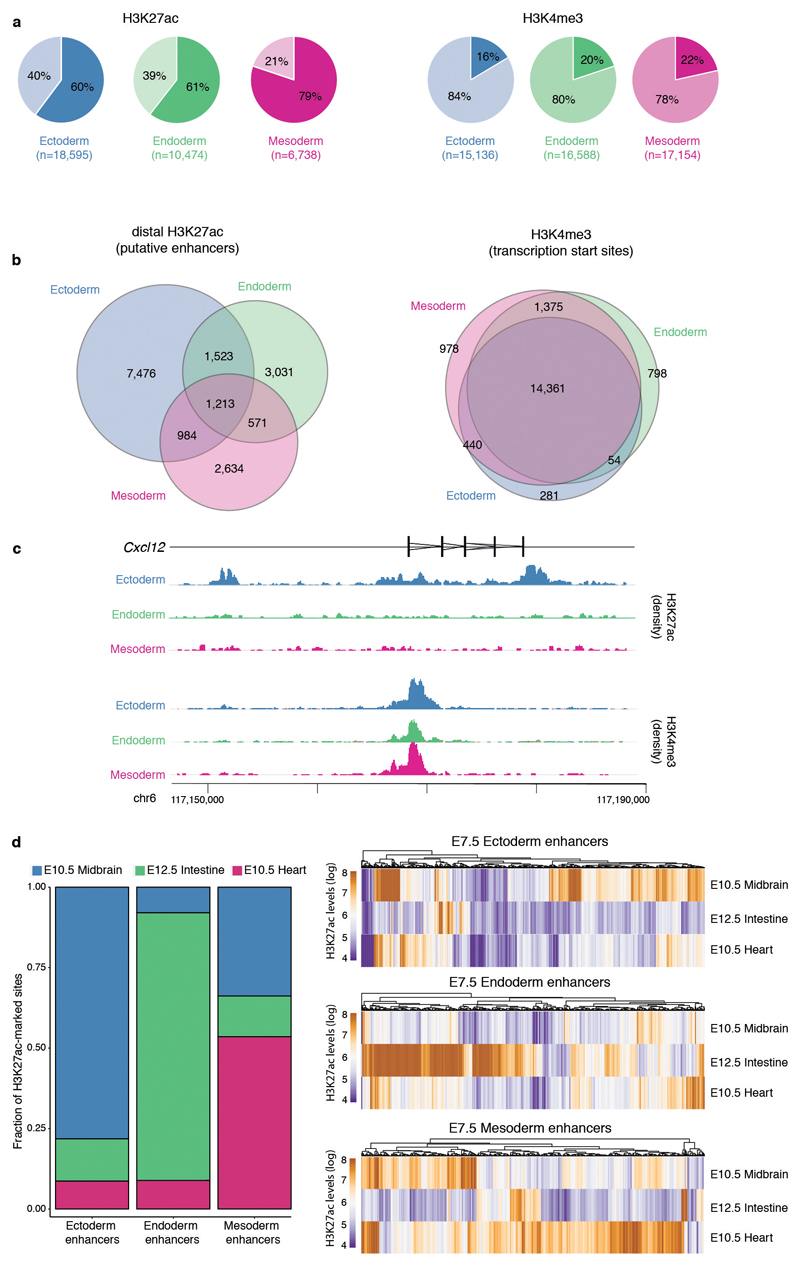
Extended Data Fig. 5. Characterisation of lineage-specific H3K27ac and H3K4me3 ChIP-seq data.
a, Percentage of peaks overlapping promoters (+/- 500 bp of transcription start sites of annotated mRNAs (Ensembl v87); lighter colour) and not overlapping promoters (distal peaks, darker colour). H3K27ac peaks tend to be distal from the promoters, marking putative enhancer elements53. H3K4me3 peaks tend to overlap promoter regions, marking transcription start sites54 b, Venn diagrams showing overlap of peaks for each lineage, for distal H3K27ac (left) and H3K4me3 (right). This plot shows that H3K27ac peaks tend to be lineage-specific, while H3K4me3 peaks tend to be shared between lineages. c, Illustrative example of the ChIP-seq profile for the ectoderm marker Cxcl12. The top tracks show wiggle plots of ChIP-seq read density (normalised by total read count) for lineage-specific H3K27ac and H3K4me3. The coding sequence is shown in black. The bottom tracks show the lineage-specific peak calls (Methods). H3K27ac peaks are split into distal (putative enhancers) and proximal to the promoter. d, Left: Bar plot of the fraction of E7.5 lineage-specific enhancers that are uniquely marked by H3K27ac in either E10.5 midbrain, E12.5 gut or E10.5 heart. Right: Heatmap displaying H3K27ac levels at individual lineage-specific enhancers in more differentiated tissues. E7.5 enhancers are predominantly marked in their differentiated-tissue counterparts (midbrain for ectoderm, gut for endoderm and heart for mesoderm).
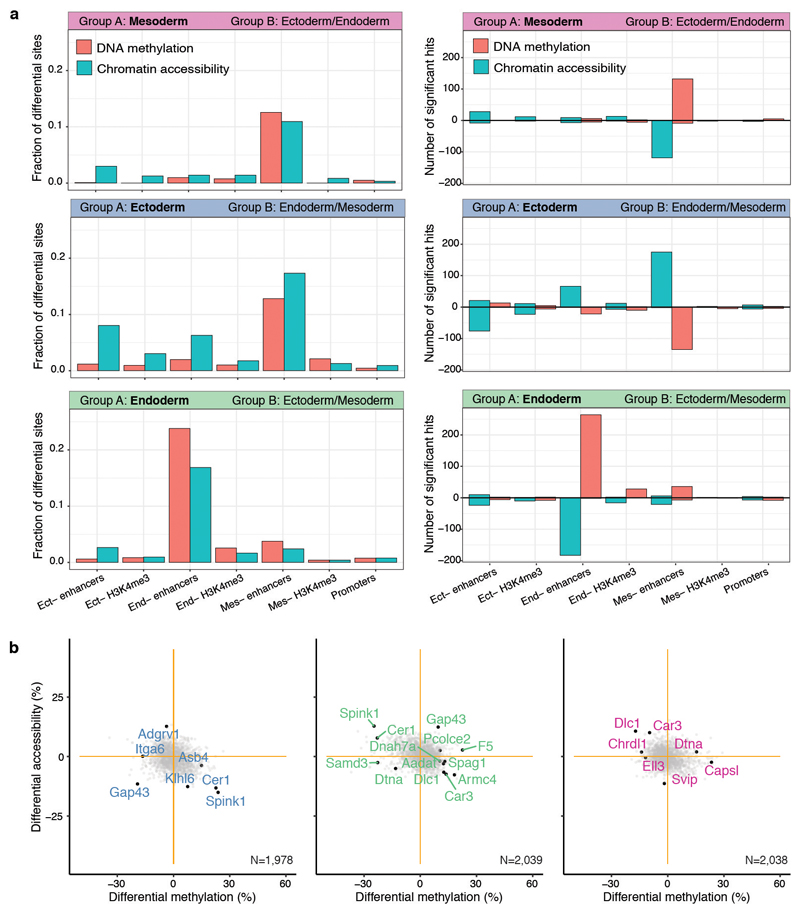
Extended Data Fig. 6. Differential DNA methylation and chromatin accessibility analysis at E7.5 for different genomic contexts.
a, Bar plots showing the fraction (left) or the total number (right) of differentially methylated (red) or accessible (blue) loci (FDR<10%, y-axis) per genomic context (x-axis). Each subplot corresponds to the comparison of one cell type (group A) against cells comprising the other cell types present at E7.5 (Group B). For the right panel, positive values indicate an increase in DNA methylation or chromatin accessibility in group A, whereas negative values indicate a decrease in DNA methylation or chromatin accessibility. Differential analysis of DNA methylation and chromatin accessibility was performed independently for each genomic element using a two-sided Fisher exact test of equal proportions (Methods). b, Scatter plots showing differential DNA methylation (x-axis) versus chromatin accessibility (y-axis) analysis at promoters. Shown are ectoderm vs non-ectoderm cells (left), endoderm vs non-endoderm cells (middle) and mesoderm vs non-mesoderm cells (right). Each dot corresponds to a gene. Labeled black dots highlight genes with lineage-specific RNA expression that show significant differential methylation or accessibility in their promoter (FDR<10%).
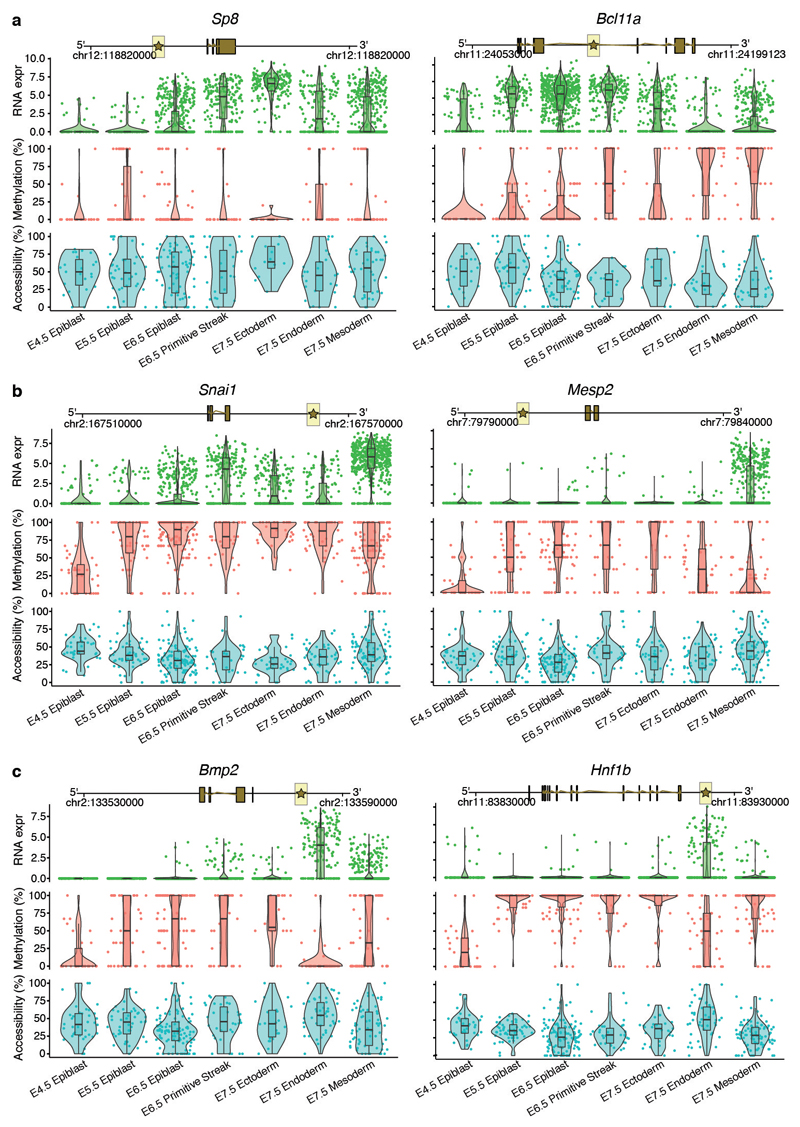
Extended Data Fig. 7. Illustrative examples of putative epigenetic regulation in enhancer elements during germ layer commitment.
Box and violin plots showing the distribution of RNA expression (log2 counts, green), and enhancer DNA methylation (%, red) and chromatin accessibility (%, blue) levels for key germ layer markers per stage and cell type. Shown are marker genes for a, ectoderm, b, mesoderm, and c, endoderm. Box plots show median levels and the first and third quartile, whiskers show 1.5x the interquartile range. Each dot corresponds to a single cell. For each gene a genomic track is shown on the top. The enhancer region that is used to quantify DNA methylation and chromatin accessibility levels is represented with a star and highlighted in yellow. Genes were linked to putative enhancers by overlapping genomic coordinates with a maximum distance of 50kb.
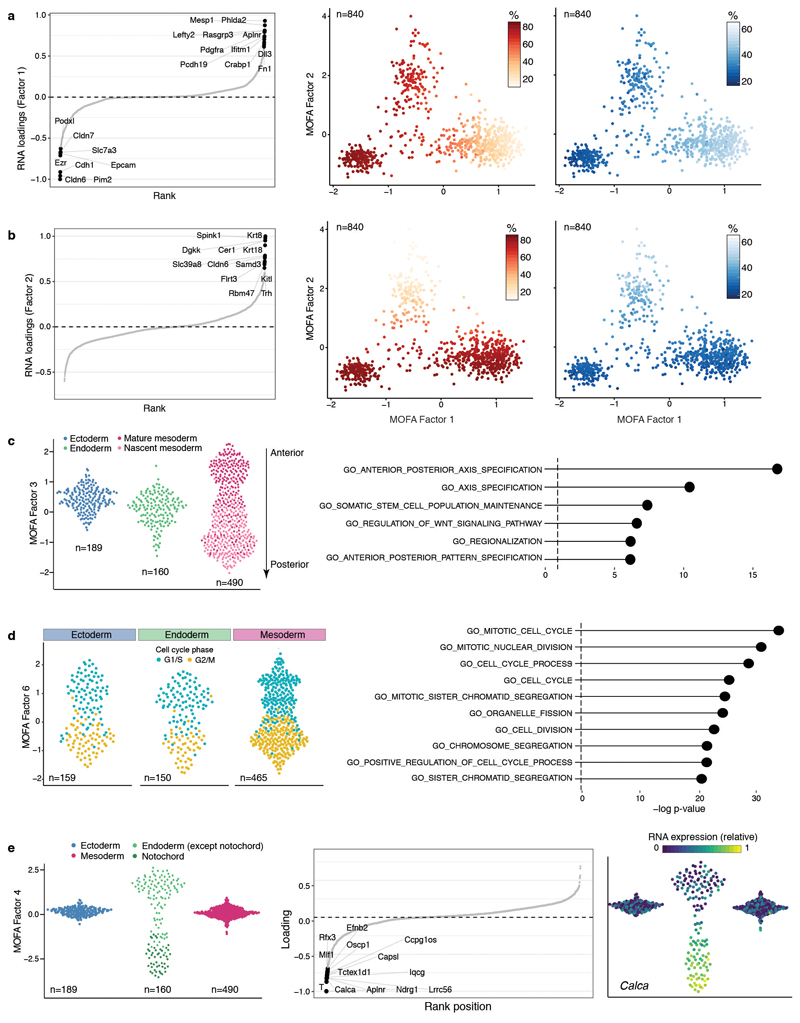
Extended Data Fig. 8. Characterisation of MOFA Factors.
a, Factor 1 as mesoderm commitment factor. Left: RNA expression loadings for Factor 1. Genes with large positive loadings increase expression in the positive factor values (mesoderm cells). Middle: Scatter plot of Factor 1 (x-axis) and Factor 2 (y-axis) values. Each dot corresponds to a single cell, coloured by the average methylation levels (%) of the top 100 enhancers with highest loading. Right: as the middle panel but cells are coloured by the average accessibility levels (%). b, Factor 2 as the endoderm commitment factor. Left: RNA expression loadings for Factor 2. Genes with large positive loadings increase expression in the positive factor values (endoderm cells). Middle: Scatter plot of Factor 1 (x-axis) and Factor 2 (y-axis) values. Each dot corresponds to a single cell, coloured by the average methylation levels (%) of the top 100 enhancers with highest loading. Right: as the middle panel but cells are coloured by the average accessibility levels (%). c, Characterisation of MOFA Factor 3 as antero-posterior axial patterning and mesoderm maturation. Left: Beeswarm plot of Factor 3 values, grouped and coloured by cell type. The mesoderm cells are subclassified into nascent and mature mesoderm (see Extended Data Fig. 2). Right: Gene set enrichment analysis of the gene loadings of Factor 3. Shown are the top most significant pathways from MSigDB C255 (Methods). d, Characterisation of MOFA Factor 6 as cell cycle. Left: Beeswarm plot of Factor 6 values, grouped by cell type and coloured by inferred cell cycle state using cyclone56 (G1/2, cyan or G2/M, yellow). Right: Gene set enrichment analysis of the gene loadings of Factor 6. Shown are the top most significant pathways from MSigDB C255. e, Characterisation of MOFA Factor 4 as notochord formation. Left: Beeswarm plot of Factor 4 values, grouped and coloured by cell type. The endoderm cells are subclassified into notochord (dark green) and not notochord (green) (see Extended Data Fig. 2). Middle: RNA expression loadings for Factor 4. Genes with large negative loadings increase expression in the negative factor values (notochord cells). Right: Same beeswarm plots as in left but coloured by the relative RNA expression of Calca (gene with the highest loading).
Extended Data Fig. 9. DNA methylation and chromatin accessibility dynamics of E7.5 lineage-specific enhancers and transcription factor motifs across development.
a, Box plots showing the distribution of DNA methylation (top) or chromatin accessibility (bottom) levels of E7.5 lineage-defining enhancers, across stages and cell types. Box plots show median levels and the first and third quartile, whiskers show 1.5x the interquartile range. The dashed lines represent the global background levels of DNA methylation at E7.5 (see Extended Data Fig. 3). b, Box plots showing the distribution of chromatin accessibility levels (scaled to the genome-wide background) for 200bp windows around transcription factor motifs associated with commitment to ectoderm (top), endoderm (middle) and mesoderm (bottom). Box plots show median levels and the first and third quartile, whiskers show 1.5x the interquartile range.
Extended Data Fig. 10. E7.5 ectoderm enhancers contain a mixture of pluripotency and neural signatures with different epigenetic dynamics.
a, Scatter plot showing H3K27ac levels for individual ectoderm enhancers (n=2039) quantified in serum ESCs (pluripotency enhancers, x-axis) versus E10.5 midbrain (neuroectoderm enhancers, y-axis). H3K27ac levels in the two lineages are negatively correlated (Pearson’s R = −0.44), indicating that most enhancers are either marked in ESCs or in the brain. Highlighted are the top 250 enhancers that show the strongest differential H3K27ac levels between midbrain and ESCs (blue for midbrain-specific enhancers and grey for ESC-specific enhancers). b, Density plots of H3K27ac levels in ESCs versus E10.5 midbrain. H3K27ac levels are negatively correlated at E7.5 ectoderm enhancers, but not in E7.5 endoderm (n=1124) or mesoderm enhancers (n=631). c, Profiles of DNA methylation (red) and chromatin accessibility (blue) along the epiblast-ectoderm trajectory. Panels show different genomic contexts: E7.5 ectoderm enhancers that are specifically marked by H3K27ac in the midbrain (middle) or ESCs (bottom) (highlighted populations in a). Shown are running averages of 50bp windows around the center of the ChIP-seq peaks (2kb upstream and downstream). Solid lines display the mean across cells (within a given lineage) and shading displays the standard deviation. Dashed horizontal lines represent genome-wide background levels for DNA methylation (red) and chromatin accessibility (blue). For comparison, we have also incorporated E7.5 endoderm enhancers (top), which follow the genome-wide repressive dynamics. d, Box plots of the distribution of DNA methylation (top) and chromatin accessibility (bottom) levels along the epiblast-ectoderm trajectory. Panels show different genomic contexts: E7.5 ectoderm enhancers that are specifically marked by H3K27ac in the midbrain (middle) or ESCs (right) (highlighted populations a). Box plots show median levels and the first and third quartile, whiskers show 1.5x the interquartile range. Dashed lines denote background DNA methylation and chromatin accessibility levels at the corresponding stage and lineage. For comparison, we have also incorporated E7.5 endoderm enhancers (left), which follow the genome-wide repressive dynamics.
Extended Data Fig. 11. Silencing of ectoderm enhancers precedes activation of mesoderm and endoderm enhancers.
a, Reconstructed mesoderm (top) and endoderm (bottom) commitment trajectories using a diffusion pseudotime method applied to the RNA expression data (Methods). Shown are scatter plots of the first two diffusion components, with cells coloured according to their lineage assignment (n=1,154 for endoderm and n=1,511 for mesoderm). For both cases, ranks along the first diffusion component are selected to order cells according to their differentiation state. b, DNA methylation (red) and chromatin accessibility (blue) dynamics of lineage-defining enhancers along the mesoderm (top) and endoderm (bottom) trajectories. Each dot denotes a single cell (n=387 for endoderm and n=474 for mesoderm) and black curves represent non-parametric loess regression estimates. In addition, for each scenario we fit a piece-wise linear regression model for epiblast, primitive streak and mesoderm or endoderm cells (vertical lines indicate the discretised lineage transitions). For each model fit, the slope (r) and its significance level is displayed in the top (- for non-significant, * for 0.01<p<0.1 and ** for p<0.01). c, Density plots showing differential DNA methylation (%, x-axis) and chromatin accessibility (%, y-axis) at lineage-defining enhancers calculated for each of the lineage transitions.
Extended Data Fig. 12. Embryoid bodies (EBs) recapitulate the transcriptional, methylation and accessibility dynamics of the embryo.
a, Embryoid bodies show high transcriptional similarity to gastrulation-stage embryos. (Top left) UMAP projection of the RNA expression for the EB data set (n=775). Cells are coloured by lineage assignment and shaped by genotype (WT or Tet TKO). (Bottom left) UMAP projection of stages E6.5 to E8.5 of the atlas data set (no extraembryonic cells) with the nearest neighbours that were used to assign cell type labels to the scNMT-seq EB data set coloured in red (WT) or blue (Tet TKO). (Middle) UMAP projection of EB cells coloured by the relative RNA expression of marker genes. (Right) Scatter plot of the differential gene expression (log2 normalised counts) between different assigned lineages for EBs (x-axis) versus embryos (y-axis). Each dot represents one gene. Pearson correlation coefficient with corresponding p-value (two-sided) are displayed. Lines show the linear regression fit. The top four genes with the largest differential expression are highlighted in red. b, Global DNA methylation and chromatin accessibility levels during EB differentiation. (Top) Box plots showing the distribution of genome-wide CpG methylation (left) or GpC accessibility levels (right) per time point and lineage (compare to Extended Data Fig. 3). Each dot represents a single cell (only WT cells are used). Box plots show median levels and the first and third quartile, whiskers show 1.5x the interquartile range. (Bottom) Heatmap of DNA methylation (left) or chromatin accessibility (right) levels per time point and genomic context (compare to Figure 1e,f). c, Ectoderm enhancers are more methylated in Tet TKO compared to WT epiblast cells in vivo. Bar plots show the mean (bulk) DNA methylation levels (%) for ectoderm (left), endoderm (middle) and mesoderm (right) enhancers in E6.5 epiblast cells25. For each genotype, two replicates are shown. d, Profiles of DNA methylation (red) and chromatin accessibility (blue) at lineage-defining enhancers quantified over different lineages across EB differentiation (only WT cells). Shown are running averages in 50bp windows around the center of the ChIP-seq peaks (2kb upstream and downstream). Solid lines display the mean across cells and shading displays the corresponding standard deviation. Dashed horizontal lines represent genome-wide background levels for methylation (red) and accessibility (blue).
Supplementary Material
Acknowledgements
R.A. is a member of Robinson College at the University of Cambridge. We thank K. Tabbada, C. Murnane and N. Forrester of the Babraham Next Generation Sequencing Facility for assistance with Illumina sequencing, members of the Babraham Flow Cytometry Core Facility for cell sorting and the Babraham Biological Support Unit for animal work. We also thank Yu Zhang for help in processing the ChIP-seq data. L.C.S. is supported by EMBO postdoctoral fellowship (ALTF 417-2018). J.C.M. is supported by core funding from EMBL and CRUK. R.A. is supported by the EMBL International Predoc Programme. X.I.S. is supported by Wellcome Trust Grant 108438/E/15/Z. F.B. is supported by the UK Medical Research Council (Career Development Award MR/M01536X/1). B.G. and J.N. are supported by core funding by the MRC and Wellcome Trust to the Wellcome-MRC Cambridge Stem Cell Institute. W.R. is supported by Wellcome (105031/Z/14/Z; 210754/Z/18/Z) and BBSRC (BBS/E/B/000C0422). O.S. is supported by core funding from EMBL and DKFZ and the EU (ERC project DECODE 810296).
Footnotes
Code availability
All analysis code is available at https://github.com/rargelaguet/scnmt_gastrulation
Data availability
Raw sequencing data together with processed files (RNA counts, CpG methylation reports, GpC accessibility reports) are available in the Gene Expression Omnibus under accession GSE121708. Processed data can be downloaded from ftp://ftp.ebi.ac.uk/pub/databases/scnmt_gastrulation.
Competing interests
W.R. is a consultant and shareholder of Cambridge Epigenetix. The remaining authors declare no competing financial interests
Author contributions
H.M., W.D and W.R. conceived the project.
S.S. and H.M. designed the study and generated pilot data.
W.D., J.N. and L.C.S. performed embryo dissections and single-cell isolation.
L.C.S and T.L. performed in vitro differentiation experiments.
S.J.C. and H.M. performed scNMT-seq library preparation.
F.K. processed and managed sequencing data.
C.K. analysed ChIP-seq datasets with assistance from Y.X. and C.H.
R.A. and S.J.C. performed pre-processing and quality control of scNMT-seq data.
R.A. and I.I.R. mapped cells to the scRNA-seq atlas.
R.A., S.J.C., F.B., L.C.S., X.I., C.A.K. and C.K. performed computational analysis.
R.A. generated figures.
R.A. S.J.C., L.C.S., O.S., J.C.M., W.R. interpreted results and drafted the manuscript.
G.S., P.R-G., W.X., G.K., O.S., B.G., J.C.M., W.R. supervised the project
All authors read and approved the final manuscript.
References
- 1.Peng G, et al. Spatial Transcriptome for the Molecular Annotation of Lineage Fates and Cell Identity in Mid-gastrula Mouse Embryo. Dev Cell. 2016;36:681–697. doi: 10.1016/j.devcel.2016.02.020. [DOI] [PubMed] [Google Scholar]
- 2.Mohammed H, et al. Single-Cell Landscape of Transcriptional Heterogeneity and Cell Fate Decisions during Mouse Early Gastrulation. Cell Rep. 2017;20:1215–1228. doi: 10.1016/j.celrep.2017.07.009. [DOI] [PMC free article] [PubMed] [Google Scholar]
- 3.Wen J, et al. Single-cell analysis reveals lineage segregation in early post-implantation mouse embryos. J Biol Chem. 2017;292:9840–9854. doi: 10.1074/jbc.M117.780585. [DOI] [PMC free article] [PubMed] [Google Scholar]
- 4.Pijuan-Sala B, et al. A single-cell molecular map of mouse gastrulation and early organogenesis. Nature. 2019;566:490–495. doi: 10.1038/s41586-019-0933-9. [DOI] [PMC free article] [PubMed] [Google Scholar]
- 5.Chan MM, et al. Molecular recording of mammalian embryogenesis. Nature. 2019;570:77–82. doi: 10.1038/s41586-019-1184-5. [DOI] [PMC free article] [PubMed] [Google Scholar]
- 6.Auclair G, Guibert S, Bender A, Weber M. Ontogeny of CpG island methylation and specificity of DNMT3 methyltransferases during embryonic development in the mouse. Genome Biol. 2014;15:545. doi: 10.1186/s13059-014-0545-5. [DOI] [PMC free article] [PubMed] [Google Scholar]
- 7.Lee HJ, Hore TA, Reik W. Reprogramming the methylome: erasing memory and creating diversity. Cell Stem Cell. 2014;14:710–719. doi: 10.1016/j.stem.2014.05.008. [DOI] [PMC free article] [PubMed] [Google Scholar]
- 8.Zhang Y, et al. Dynamic epigenomic landscapes during early lineage specification in mouse embryos. Nat Genet. 2018;50:96–105. doi: 10.1038/s41588-017-0003-x. [DOI] [PubMed] [Google Scholar]
- 9.Macaulay IC, et al. G&T-seq: parallel sequencing of single-cell genomes and transcriptomes. Nat Methods. 2015;12:519–522. doi: 10.1038/nmeth.3370. [DOI] [PubMed] [Google Scholar]
- 10.Dey SS, Kester L, Spanjaard B, Bienko M, van Oudenaarden A. Integrated genome and transcriptome sequencing of the same cell. Nat Biotechnol. 2015;33:285–289. doi: 10.1038/nbt.3129. [DOI] [PMC free article] [PubMed] [Google Scholar]
- 11.Angermueller C, et al. Parallel single-cell sequencing links transcriptional and epigenetic heterogeneity. Nat Methods. 2016;13:229–232. doi: 10.1038/nmeth.3728. [DOI] [PMC free article] [PubMed] [Google Scholar]
- 12.Clark SJ, et al. scNMT-seq enables joint profiling of chromatin accessibility DNA methylation and transcription in single cells. Nat Commun. 2018;9 doi: 10.1038/s41467-018-03149-4. 781. [DOI] [PMC free article] [PubMed] [Google Scholar]
- 13.Cao J, et al. Joint profiling of chromatin accessibility and gene expression in thousands of single cells. Science. 2018;361:1380–1385. doi: 10.1126/science.aau0730. [DOI] [PMC free article] [PubMed] [Google Scholar]
- 14.Smith ZD, et al. A unique regulatory phase of DNA methylation in the early mammalian embryo. Nature. 2012;484:339–344. doi: 10.1038/nature10960. [DOI] [PMC free article] [PubMed] [Google Scholar]
- 15.Argelaguet R, et al. Multi-Omics Factor Analysis-a framework for unsupervised integration of multi-omics data sets. Mol Syst Biol. 2018;14:e8124. doi: 10.15252/msb.20178124. [DOI] [PMC free article] [PubMed] [Google Scholar]
- 16.Yunlong X, Wei X. Epigenomic analysis of gastrulation reveals a unique chromatin state for primed pluripotency. Nat Genet. doi: 10.1038/s41588-019-0545-1. [DOI] [PMC free article] [PubMed] [Google Scholar]
- 17.Cusanovich DA, et al. The cis-regulatory dynamics of embryonic development at single-cell resolution. Nature. 2018;555:538–542. doi: 10.1038/nature25981. [DOI] [PMC free article] [PubMed] [Google Scholar]
- 18.Daugherty AC, et al. Chromatin accessibility dynamics reveal novel functional enhancers in C. elegans. Genome Res. 2017;27:2096–2107. doi: 10.1101/gr.226233.117. [DOI] [PMC free article] [PubMed] [Google Scholar]
- 19.Bogdanovic O, et al. Active DNA demethylation at enhancers during the vertebrate phylotypic period. Nat Genet. 2016;48:417–426. doi: 10.1038/ng.3522. [DOI] [PMC free article] [PubMed] [Google Scholar]
- 20.Kazakevych J, Sayols S, Messner B, Krienke C, Soshnikova N. Dynamic changes in chromatin states during specification and differentiation of adult intestinal stem cells. Nucleic Acids Res. 2017;45:5770–5784. doi: 10.1093/nar/gkx167. [DOI] [PMC free article] [PubMed] [Google Scholar]
- 21.Yue F, et al. A comparative encyclopedia of DNA elements in the mouse genome. Nature. 2014;515:355–364. doi: 10.1038/nature13992. [DOI] [PMC free article] [PubMed] [Google Scholar]
- 22.Kim HS, et al. Pluripotency factors functionally premark cell-type-restricted enhancers in ES cells. Nature. 2018;556:510–514. doi: 10.1038/s41586-018-0048-8. [DOI] [PMC free article] [PubMed] [Google Scholar]
- 23.Rasmussen KD, Helin K. Role of TET enzymes in DNA methylation, development, and cancer. Genes Dev. 2016;30:733–750. doi: 10.1101/gad.276568.115. [DOI] [PMC free article] [PubMed] [Google Scholar]
- 24.Sardina JL, et al. Transcription Factors Drive Tet2-Mediated Enhancer Demethylation to Reprogram Cell Fate. Cell Stem Cell. 2018 doi: 10.1016/j.stem.2018.08.016. [DOI] [PubMed] [Google Scholar]
- 25.Dai H-Q, et al. TET-mediated DNA demethylation controls gastrulation by regulating Lefty-Nodal signalling. Nature. 2016;538:528–532. doi: 10.1038/nature20095. [DOI] [PubMed] [Google Scholar]
- 26.Li X, et al. Tet proteins influence the balance between neuroectodermal and mesodermal fate choice by inhibiting Wnt signaling. Proc Natl Acad Sci U S A. 2016;113:E8267–E8276. doi: 10.1073/pnas.1617802113. [DOI] [PMC free article] [PubMed] [Google Scholar]
- 27.Tropepe V, et al. Direct neural fate specification from embryonic stem cells: a primitive mammalian neural stem cell stage acquired through a default mechanism. Neuron. 2001;30:65–78. doi: 10.1016/s0896-6273(01)00263-x. [DOI] [PubMed] [Google Scholar]
- 28.Muñoz-Sanjuán I, Brivanlou AH. Neural induction, the default model and embryonic stem cells. Nat Rev Neurosci. 2002;3:271–280. doi: 10.1038/nrn786. [DOI] [PubMed] [Google Scholar]
- 29.Rauch A, et al. Osteogenesis depends on commissioning of a network of stem cell transcription factors that act as repressors of adipogenesis. Nat Genet. 2019;51:716–727. doi: 10.1038/s41588-019-0359-1. [DOI] [PubMed] [Google Scholar]
- 30.Banerjee KK, et al. Enhancer, transcriptional, and cell fate plasticity precedes intestinal determination during endoderm development. Genes Dev. 2018;32:1430–1442. doi: 10.1101/gad.318832.118. [DOI] [PMC free article] [PubMed] [Google Scholar]
- 31.Hu X, et al. Tet and TDG mediate DNA demethylation essential for mesenchymal-to-epithelial transition in somatic cell reprogramming. Cell Stem Cell. 2014;14:512–522. doi: 10.1016/j.stem.2014.01.001. [DOI] [PubMed] [Google Scholar]
- 32.Macaulay IC, et al. Separation and parallel sequencing of the genomes and transcriptomes of single cells using G&T-seq. Nat Protoc. 2016;11:2081–2103. doi: 10.1038/nprot.2016.138. [DOI] [PubMed] [Google Scholar]
- 33.Picelli S, et al. Full-length RNA-seq from single cells using Smart-seq2. Nat Protoc. 2014;9:171–181. doi: 10.1038/nprot.2014.006. [DOI] [PubMed] [Google Scholar]
- 34.Clark SJ, et al. Genome-wide base-resolution mapping of DNA methylation in single cells using single-cell bisulfite sequencing (scBS-seq) Nat Protoc. 2017;12:534–547. doi: 10.1038/nprot.2016.187. [DOI] [PubMed] [Google Scholar]
- 35.Kim D, Langmead B, Salzberg SL. HISAT: a fast spliced aligner with low memory requirements. Nat Methods. 2015;12:357–360. doi: 10.1038/nmeth.3317. [DOI] [PMC free article] [PubMed] [Google Scholar]
- 36.Liao Y, Smyth GK, Shi W. featureCounts: an efficient general purpose program for assigning sequence reads to genomic features. Bioinformatics. 2014;30:923–930. doi: 10.1093/bioinformatics/btt656. [DOI] [PubMed] [Google Scholar]
- 37.Yates A, et al. Ensembl 2016. Nucleic Acids Res. 2016;44:D710–6. doi: 10.1093/nar/gkv1157. [DOI] [PMC free article] [PubMed] [Google Scholar]
- 38.Lun ATL, McCarthy DJ, Marioni JC. A step-by-step workflow for low-level analysis of single-cell RNA-seq data with Bioconductor. F1000Res. 2016;5:2122. doi: 10.12688/f1000research.9501.1. [DOI] [PMC free article] [PubMed] [Google Scholar]
- 39.Krueger F, Andrews SR. Bismark: a flexible aligner and methylation caller for Bisulfite-Seq applications. Bioinformatics. 2011;27:1571–1572. doi: 10.1093/bioinformatics/btr167. [DOI] [PMC free article] [PubMed] [Google Scholar]
- 40.Smallwood SA, et al. Single-cell genome-wide bisulfite sequencing for assessing epigenetic heterogeneity. Nat Methods. 2014;11:817–820. doi: 10.1038/nmeth.3035. [DOI] [PMC free article] [PubMed] [Google Scholar]
- 41.Langmead B, Salzberg SL. Fast gapped-read alignment with Bowtie 2. Nat Methods. 2012;9:357–359. doi: 10.1038/nmeth.1923. [DOI] [PMC free article] [PubMed] [Google Scholar]
- 42.Zhang Y, et al. Model-based analysis of ChIP-Seq (MACS) Genome Biol. 2008;9:R137. doi: 10.1186/gb-2008-9-9-r137. [DOI] [PMC free article] [PubMed] [Google Scholar]
- 43.Kiselev VY, et al. SC3: consensus clustering of single-cell RNA-seq data. Nat Methods. 2017;14:483–486. doi: 10.1038/nmeth.4236. [DOI] [PMC free article] [PubMed] [Google Scholar]
- 44.Haghverdi L, Lun ATL, Morgan MD, Marioni JC. Batch effects in single-cell RNA-sequencing data are corrected by matching mutual nearest neighbors. Nat Biotechnol. 2018;36:421–427. doi: 10.1038/nbt.4091. [DOI] [PMC free article] [PubMed] [Google Scholar]
- 45.Bourgon R, Gentleman R, Huber W. Independent filtering increases detection power for high-throughput experiments. Proc Natl Acad Sci U S A. 2010;107:9546–9551. doi: 10.1073/pnas.0914005107. [DOI] [PMC free article] [PubMed] [Google Scholar]
- 46.Benjamini Y, Hochberg Y. Controlling the False Discovery Rate: A Practical and Powerful Approach to Multiple Testing. J R Stat Soc Series B Stat Methodol. 1995;57:289–300. [Google Scholar]
- 47.McLeay RC, Bailey TL. Motif Enrichment Analysis: a unified framework and an evaluation on ChIP data. BMC Bioinformatics. 2010;11:165. doi: 10.1186/1471-2105-11-165. [DOI] [PMC free article] [PubMed] [Google Scholar]
- 48.Khan A, et al. JASPAR 2018: update of the open-access database of transcription factor binding profiles and its web framework. Nucleic Acids Res. 2018;46:D260–D266. doi: 10.1093/nar/gkx1126. [DOI] [PMC free article] [PubMed] [Google Scholar]
- 49.Robinson MD, McCarthy DJ, Smyth GK. edgeR: a Bioconductor package for differential expression analysis of digital gene expression data. Bioinformatics. 2010;26:139–140. doi: 10.1093/bioinformatics/btp616. [DOI] [PMC free article] [PubMed] [Google Scholar]
- 50.Ohnishi Y, et al. Cell-to-cell expression variability followed by signal reinforcement progressively segregates early mouse lineages. Nat Cell Biol. 2014;16:27–37. doi: 10.1038/ncb2881. [DOI] [PMC free article] [PubMed] [Google Scholar]
- 51.Yeom YI, et al. Germline regulatory element of Oct-4 specific for the totipotent cycle of embryonal cells. Development. 1996;122:881–894. doi: 10.1242/dev.122.3.881. [DOI] [PubMed] [Google Scholar]
- 52.Kalantry S, et al. The amnionless gene, essential for mouse gastrulation, encodes a visceral-endoderm-specific protein with an extracellular cysteine-rich domain. Nat Genet. 2001;27:412–416. doi: 10.1038/86912. [DOI] [PubMed] [Google Scholar]
- 53.Creyghton MP, et al. Histone H3K27ac separates active from poised enhancers and predicts developmental state. Proc Natl Acad Sci U S A. 2010;107:21931–21936. doi: 10.1073/pnas.1016071107. [DOI] [PMC free article] [PubMed] [Google Scholar]
- 54.Liang G, et al. Distinct localization of histone H3 acetylation and H3-K4 methylation to the transcription start sites in the human genome. Proc Natl Acad Sci U S A. 2004;101:7357–7362. doi: 10.1073/pnas.0401866101. [DOI] [PMC free article] [PubMed] [Google Scholar]
- 55.Subramanian A, et al. Gene set enrichment analysis: a knowledge-based approach for interpreting genome-wide expression profiles. Proc Natl Acad Sci U S A. 2005;102:15545–15550. doi: 10.1073/pnas.0506580102. [DOI] [PMC free article] [PubMed] [Google Scholar]
- 56.Scialdone A, et al. Computational assignment of cell-cycle stage from single-cell transcriptome data. Methods. 2015;85:54–61. doi: 10.1016/j.ymeth.2015.06.021. [DOI] [PubMed] [Google Scholar]
Associated Data
This section collects any data citations, data availability statements, or supplementary materials included in this article.


