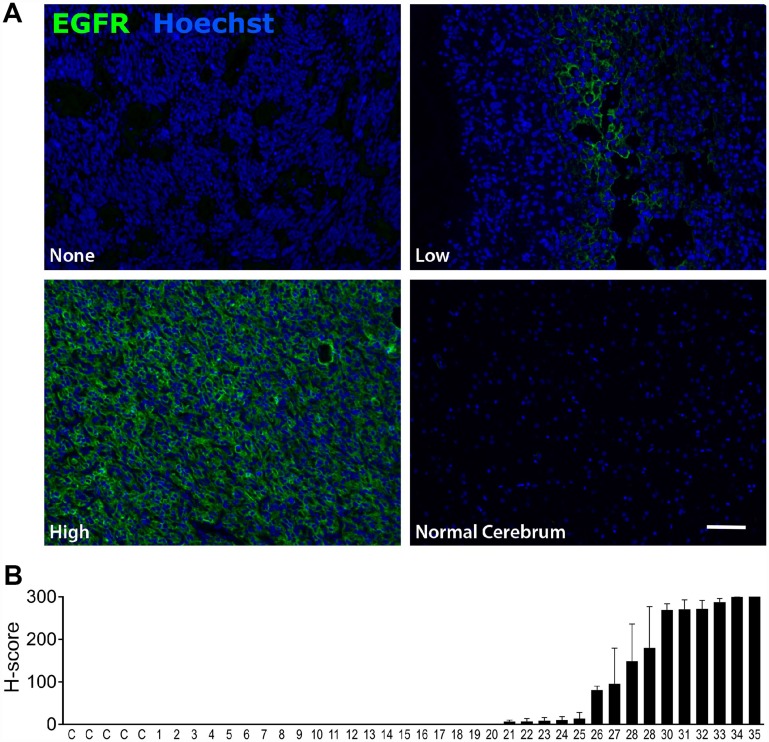
Figure 2. EGFR is expressed in glioblastoma but not in normal brain.
(A) Representative immunofluorescent labeling for EGFR expression in human glioblastoma samples (top row and bottom left panels) and normal brain (bottom right panel). Scale bar 20μm. Images were acquired at 20 ×. (B) EGFR expression in normal brain (C=control) and 35 malignant glioma samples (1–35). Bars show mean EGFR immunofluorescence as quantified by H score. Error bars show SEM for 2 replicates from individual patients.

