Abstract
Cadmium is a toxic metal that produces oxidative stress and has been shown to disrupt the actin cytoskeleton in rat renal mesangial cells (RMC). In a survey of proteins that might undergo Cd2+-dependent disulfide crosslinking, we identified the adenylyl cyclase-associated protein, CAP1, as undergoing a dimerization in response to Cd2+ (5–40 μM) that was sensitive to disulfide reducing agents, was reproduced by the disulfide crosslinking agent diamide, and was shown by site-directed mutagenesis to involve the Cys29 residue of the protein. Reactive oxygen species are not involved in the thiol oxidation, and glutathione modulates background levels of dimer. CAP1 is known to enhance cofilin’s F-actin severing activity through binding to F-actin and cofilin. F-actin sedimentation and GST-cofilin pulldown studies of CAP1 demonstrated enrichment of the CAP1 dimer’s association with cofilin, and in the cofilin-F-actin pellet, suggesting that Cd2+-induced dimer increases the formation of a CAP1-cofilin-F-actin complex. Both siRNA-based silencing of CAP1 and overexpression of a CAP1 mutant lacking Cys29 (and therefore incapable of dimerization in response to Cd2+) increased RMC viability and provided some protection of F-actin structures against Cd2+. It is concluded that Cd2+ brings about disruption of the RMC cytoskeleton in part through formation of a CAP1 dimer that increases recruitment of cofilin to F-actin filaments.
Keywords: cadmium, mesangial cell, CAP1 protein, cofilin, actin filaments
INTRODUCTION
Cadmium is a toxic metal with no essential function in higher organisms. It is found throughout the environment, and bioaccumulates in humans causing nephrotoxicity, the development of some cancers, and, at higher levels, functional compromise of a variety of organs (Nordberg 2009; Thevenod and Lee 2013; Thevenod and Lee 2015; Xiao et al. 2009). The molecular mechanisms of Cd’s toxicity are multiple, and include inhibition of a number of enzymes because of its affinity for thiol groups, as well as mimicry by Cd2+ of Ca2+ ion that disrupts protein structure and function (Choong et al. 2014; Thevenod 2009). These mechanisms lead to interference with mitochondrial function (Liu et al. 2009), inhibition of DNA repair (Beyersmann and Hechtenberg 1997; Hartwig 1994), aberrant activation of kinase signaling pathways (Shima et al. 2000; Thevenod 2009; Thevenod and Lee 2015; Xiao et al. 2009), and initiation of pathways of both programmed cell death and cell survival (Xiao et al. 2009). Although Cd2+ does not redox cycle at oxidation-reduction potentials accessible under biological conditions, it does impose oxidative stress on cells (Liu et al. 2009) through various mechanisms, including inhibition of enzymes and binding to thiol-containing peptides involved in antioxidant defenses.
Cadmium disrupts the F-actin cytoskeleton in rat renal mesangial cells (RMC) (Wang et al. 1996; Wang and Templeton 1996). This effect is mediated in part by gelsolin translocation (Apostolova et al. 2006; Liu and Templeton.D.M. 2013), and is a downstream event facilitating Cd2+-induced programmed cell death. Disruption of actin filaments is partially protective against Cd2+-induced apoptotic death, and inhibition of CaMK-II and p38 kinase, mitochondrial stabilization, and the antioxidant N-acetylcysteine all prevent disruption of the cytoskeleton, and all protect against apoptosis (Liu and Templeton 2010). Exposure of RMC to Cd2+ causes loss of vinculin and FAK from focal contacts, concomitant with cytoskeletal disruption. Inhibition of CaMK-II abrogates these effects of Cd2+, and decreases the migration of FAK-phosphoTyr925 to a membrane-associated compartment where it is otherwise sequestered from focal adhesions in a Cd2+-dependent manner. In particular, actin filaments have exposed thiol groups, and reversible glutathionylation on Cys374 may have a regulatory function (Dalle-Donne et al. 2003); we showed that reversible glutathionylation of actin occurs in RMC exposed to Cd2+, and appears to be more dependent on reduced glutathione and glutaredoxin activity than upon levels of reactive oxygen species (ROS) (Choong et al. 2013b).
The adenylyl cyclase-associated protein (CAP) was first identified as a component of the yeast adenylyl cyclase complex (Field et al. 1990); it facilitates activation of adenylyl cyclase by Ras (Shima et al. 2000) and modulates dynamics of the actin cytoskeleton (Chaudhry et al. 2013). Although CAP does not regulate cAMP in animal cells (Freeman and Field 2000), it is conserved in all eukaryotic organisms, including plants and animals (Hubberstey and Mottillo 2002) and has a conserved function regulating actin dynamics (Jansen et al. 2014). There are two mammalian isoforms, CAP1 and CAP2; CAP1 is expressed in most cells and tissues, whereas CAP2 expression is more restricted, although at least one isoform is expressed in nearly all cells (Peche et al. 2007).
Actin dynamics refers to an ongoing process in which actin filaments (F-actin) are continually growing by addition of globular actin (G-actin) monomers at the ‘barbed’ or ‘+’ end of the polymer in an energy-dependent process, while depolymerization is occurring from the opposite ‘pointed’ or ‘-’ end. This process, called ‘treadmilling’, can maintain a constant polymer length, but also allows a tipping of the polymerization/depolymerization equilibrium to affect rapid changes in cell shape and motility. A large number of proteins, many of them Ca2+-dependent (Lee and Dominguez 2010; Olson and Nordheim 2010; Vandekerchove 1993) are involved in influencing kinetically the various processes of filament capping, severing, nucleation, and monomer sequestration (Furukawa et al. 2003; Pope et al. 1995), that together determine the net rate of growth or dissolution of the filaments. CAP proteins bind and sequester G-actin through their C-terminus (Gerst et al. 1991). However, CAP1 also interacts with the protein cofilin, an actin-depolymerizing factor, through its N-terminus, and thereby facilitates F-actin turnover (Moriyama and Yahara 2002; Quintero-Monzon et al. 2009). Indeed, both N- and C-terminus domains, as well as a central proline-rich domain, appear to be involved in actin dynamics through interactions with both cofilin and F- and G-actin species (Ono 2013b; Zhou et al. 2014). While the consequences of CAP1 modification are not completely clear (for instance, although knock-down of CAP1 leads to an expected increase in F-actin, it also increased cell motility and invasion (Zhou et al. 2014)), evidence points to effects mediated through interactions with cofilin and focal adhesion kinase (FAK) (Zhou et al. 2014).
We report here that Cd2+ induces a thiol/disulfide dependent dimerization of the CAP1 protein in mammalian cells that appears to be independent of ROS levels, but reveals a natural propensity of this protein to dimerize under conditions of oxidative stress, and notably in the presence of Cd2+. Formation of the dimer is associated with increased binding to F-actin and cofilin, and greater recruitment of cofilin to F-actin in the presence of Cd2+. Mutation of Cys29 prevention dimerization and protects the actin cytoskeleton against disruption by Cd2+ in RMC. Thus, we identified a new role for CAP1 as a redox sensor.
MATERIALS AND METHODS
Materials:
Fetal bovine serum (FBS), RPMI-1640 and DMEM (4.5 g/l glucose) culture media were purchased from Wisent Biocenter (Quebec, Canada). Cadmium chloride (CdCl2), diamide, thiazolyl blue tetrazolium bromide (MTT), protease inhibitors (aproprotinin, leupeptin, pepstatin and phenylmethylsulfonyl fluoride (PMSF)), butylated hydroxyanisole (BHA) and the inhibitor of y-glutamylcysteinyl synthetase, buthionine sulfoximine (BSO) were obtained from Sigma-Aldrich (St. Louis, MO). Fluorescent probes 2’,7’-dichlorodihydrofluorescein diacetate (H2DCF-DA) and rhodamine-conjugated phalloidin were from Molecular Probes (Burlington, ON, Canada) and 4’,6-diamidino-2-phenylindole (DAPI) was acquired from Vector Laboratories (Burlington, ON). Mouse monoclonal anti-CAPl (WH0010487) and anti- -actin (A1978) antibodies were purchased from Sigma-Aldrich. Anti-cofilin (Ab134963) was from abcam (Cambridge, MA). Anti-His antibody (H-3 sc-8036) for Western blotting was purchased from Santa Cruz (Dallas, TX). Anti-His antibody (A00186) for immunofluorescent staining was purchased from GenScript (Piscataway, NJ). Anti-secondary Alexa fluor 488-conjugated goat anti-mouse antibody (A11001) was acquired from Life Technologies (Danvers, MA). HRP-conjugated anti-mouse and anti-rabbit secondary antibodies were purchased from Cell Signaling Technology (Danvers, MA). Enhanced chemiluminecent substrate was from PerkinElmer (Woodbridge, ON, Canada) and Ni2+ -nitrilotricactate agarose beads were from Qiagen (Mississauga, ON, Canada). Glutathione Sepharsoe 4B beads for purification of recombinant glutathion-^-transferase (GST)-tagged cofilin were from GE Healthcare Life Sciences (Mississauga, ON, Canada). Transfection reagents were Lipofectamine RNAiMAX (Life Technologies, Burlington, ON, Canada) and PolyJet DNA tranfection reagent (SignaGen Laboratories, Rockville, MD).
Cell culture:
Rat mesangial cell (RMC) cultures were established as previously described (Wang and Templeton 1998). Cells were grown in RPMI-1640 medium with 10 % FBS in a humidified atmosphere of 5 % C02 at 37 C and used between passages 7 and 15. Overnight cultures were rendered quiescent in PRMI-1640 with 0.2 % FBS for 48 h. Cells were treated with various concentration of CdCl2 for 6 h (except in time course studies) or diamide for 45 min in serum-free (SF) medium. In some experiments, cells were pre-treated with 100 M BHA for 1 h in SF medium or 50 M BSO in starvation medium for 16 h to decrease glutathione, followed by treatment with CdCl2 alone or cotreated with BHA for 6 h in SF medium. Viability of cells was determined using an MTT asssay (Liu and Templeton 2008). HEK293 or HEK293T cells were grown in 10 % FBS in DMEM with 4.5 g/1 glucose in a humidified atmosphere of 5 % CO2 at 37 C. HEK293T was used for recombinant CAP1 expression and purification.
SDS-PAGE and diagonal electrophoresis:
Total cell lysate was prepared by washing cells three times with ice-cold PBS and lysing in buffer containing 50 mM Tris*HCl, pH 7.5, with 150 mM NaCl, 5 mM EGTA, 2 mM EDTA, 1 % Triton X-100 and 100 mM maleimide with protease inhibitors. Lysates were then sonicated three times for 5 s each and centrifuged at 10,000 x g for 15 min.
One-dimensional non-reducing SDS-PAGE was carried out by omitting reducing agents DTT or 2-mercaptoethanol from the lysis buffer and Laemmli loading buffer. In some experiments, samples with incubated with 10 mM DTT or 5 % 2-mercaptoethanol for 30 min at room temperature before SDS-PAGE to confirm the presence of disulfide bonds.
Diagonal electrophoresis was carried out as described (Liu et al. 2014). Fifty g of total lysate was separated with 0.75 mm-thick 8 % SDS-PAGE gels without reducing agents. The whole lane containing the separated proteins was cut and incubated with loading buffer containing 50 mM DTT at room temperature for 1 h. The gel slice was rotated 90 and laid onto a 1.5 mm-thick 8 % gels and sealed withl % agarose. In some experiments, the gels were silver-stained, and protein spots run off diagonal and to the left of the slop (protein with intermolecular disulfide-formation) were excised for identification by LC-MS as described before (Liu and Templeton.D.M. 2013). Some of gels were transferred and blotted with anti-CAP1 antibody.
Purification of recombinant CAP1:
Mouse recombinant CAP1 (rCAP1) was purified from transiently transfected HEK293T cells with pcDNA4-His-CAP1 using Ni2+ - nitrilotricactate agarose beads. Briefly, HEK293T cells were lysed in buffer containing 50 mM NaH2PO4, pH 8.0, with 250 mM NaCl, 10 mM imidazole, 0.05 % Tween-20, and protease inhibitors. After sonication for 3 × 15 sec with 10 sec cooling intervals, cell lyastes were cleared by centrifugation at 16,000 x g for 15 min. The supernatant was rotated in 50 % Ni-nitrilotricacetate agarose beads overnight at 4 C. The beads were washed with Ni-NTA binding buffer with up to 100 mM imidazole. rCAP1 was eluted with binding buffer containing 300 mM imidazole. In some experiments, rCAP1 was incubated with 10 mM DTT or 0.05 mM diamide at room temperature for 30 min before SDS-PAGE.
Intracellular reactive oxygen species (ROS) measurements:
After CdCl2 treatment, cells were washed with SF media and incubated with 5 M H2DCF-DA for 1 h at 37 C. Then cells were trypsinized, washed, and resuspended in 300 1 PBS. Intracellular ROS were measured by the DCF fluorescence in an Epics Elite flow cytometer (Beckman Coulter, Fullerton, CA). Alternatively (Fig. 6 B), RMC (1 ×10⁴ cells) were seeded into 96-well plates, grown overnight, and then starved in RPMI-1640 with 0.2 % FBS for 48 h. Cells were then washed and incubated with 100 M H2DCF-DA for 40 min in serumfree medium, washed again, and treated with the indicated concentrations of metals for 6 h. DCF was measured at excitation 485 nm and emission 535 nm with a SpectraMax i3 fluorescent plate reader (Molecular Devices, Sunnyvale, CA).
Fig. 6 – Effects of other redox-active metals on CAP1 dimerization.
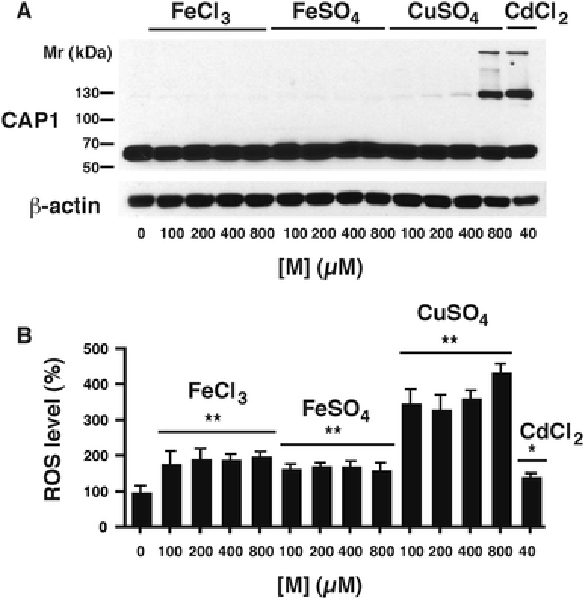
Quiescent RMC cultures were treated with the indicated concentrations of metal ion [M] as either ferric chloride, ferrous sulfate, cuprous sulfate, or cadmium chloride for 6 h. A) A western blot of a typical experiment is shown. The CAP1 dimer (below 130 kDa) is prominent in the Cd-treated cells, and at the highest concentration (800 μM) of Cu(II). B) ROS levels are shown as a percent of cells held in serum-free medium not supplemented with any metal ion (lane 1). All values are at 6 h and differ from the metal free control by ANOVA with Dunnett’s post hoc test (*, p<0.05; **, p<0.01; (n = 4)).
siRNA experiments:
RMC (3.5×10⁵ cells) were seeded into 60 mm plates and grown overnight. 10 nM of siCAP1 (cat#4390843-s133854, sequences as below) or scrambled negative control (cat#4390843) was purchased from Life Technologies (Burlington, ON, Canada) and transfected into RMC using 6 1 of Lipofectamine RNAiMAX (Life Technologies) for 24 h as recommended by the manufacture. Cells were washed and changed to growth media for an additional 24 h, then starved in 0.2 % FBS medium for 24 h followed by 6 h Cd treatment in SF medium. CAP1 siRNA was designed based on the rat CAP1 mRNA sequence (NM_022383) and the sequences were: Sense: CAAUAGUAGGGAUGUCAAAtt Antisense: UUUGACAUCCCUACUAUUGat
Measurement of F-actin/G-actin ratio:
F-actin and G-actin fractionation was performed according to (Zhang et al. 2013), with minor modification. Cells on 100 mm plates were washed with ice-cold PBS prior to lysis with 1 ml LAS buffer (50 mM PIPES pH6.9, 50 mM NaCl, 5 mM MgCh, 5 mM EGTA, 5 % v/v Glycerol, 1 % Triton-X100, 1 mM ATP) supplemented with protease inhibitors and 100 mM maleimide. Cell lysate was homogenized with a 25G syringe and centrifuged at 2,000 x g for 5 min to pellet the cell debris, then further centrifuged at 100,000 x g for 1 hr (Beckman-Coulter, TLA100.1 rotor) at 4 C. The supernatant containing G-actin was collected and the pellet containing F-actin was suspended in denaturing buffer (50 mM Tris*HCl, pH 7.5, with 1 % SDS and 5 mM EDTA). Proportional volumes of supernatant and pellet were resolved on SDS-PAGE and blotted with anti-actin antibody. The ratio of F-actin to G-actin was analyzed using densitometry and Image J software.
Construction of CAP1 mutants and pcDNA4-His CAP1 plasmid transfection:
Point mutants of mouse CAP1 with each of the six cysteine residues mutated to alanine were generated by site specific mutagenesis and confirmed by DNA sequencing. HEK293 (8×10⁵ cells) were seeded into each well of 6-well plates and grown overnight. Plasmids (1 g) were transfected into HEK293 using 2 1 of PolyJet DNA transfection reagent for 24 h according to the manufacture’s protocol. Cells were washed and changed to fresh growth media for an additional 24 h. Then cells were treated with CdCl2 for 6 h in SF medium, or with 1 mM diamide for 1 h in growth medium. RMC (3.75 ×10⁵ cells) were seeded in 6-well plates and transfected with 2 g of plasmid. After 48 h transfection, RMC were starved in 0.2 % FBS for 24 h and treated for 6 h with CdCl2 in SF medium.
Western blotting:
Equal amount of protein were separated by SDS-PAGE and transferred to nitrocellulose for immunoblotting. Antibody dilutions were as follows: Anti-CAPl (1:4000), anti- -actin (1:15,000), anti-cofilin (1:2500), and anti-His (1:4000). Enhanced chemiluminecent substrate was used for signal detection. Band density was quantified using Image J software (NIH, Bethesda, MD).
Immunofluorescence Microscopy:
Cells were seeded on 12 mm cover-slips, grown overnight and starved for 48 h in 0.2 % FBS in RPMI-1640. After treatment with CdCl2, cells were washed with ice-cold PBS, fixed with 4 % paraformaldehyde for 15 min, and permeabilized with 100 mM PIPES, pH 6.9, containing 0.5 % Triton X-100 lysis buffer, 1 mM EGTA, and 4 % polyethyleneglycol 8000 for 5 min. Permeabilized cells were blocked in 5 % BSA/PBS and incubated overnight with Anti-His antibody (0.1 g/ml) at 4 °C. Cells were washed 3 times with 0.2 % BSA/PBS followed by incubation with rhodamine-phalloidin (1:100) and Alexa fluror 488-conjugated secondary antibody (1:1000) for 1 h at room temperature. Coverslips were mounted on glass slides with mounting medium containing DAPI to stain the nuclei. Appropriate primary antibody and secondary antibody controls were performed, confirming the specificity of the antibody interactions. Images were taken using a Nikon fluorescent microscope.
GST-cofilin pull-down CAP1 assay:
Human GST-cofilin in a pGEX4T-2 plasmid was used for GST-cofilin pull-down as described previously (Zhang et al. 2013), with modifications. In brief, recombinant GST-cofilin was purified from E. coli BL21 with 1 mM IPTG induction for 4 hr at 37 C. Pelleted bacteria from 350 ml LB culture was lysed and sonicated in buffer containing 20 mM Tris*HCl, pH 8.0, with 200 mM NaCl, 1 mM EDTA, 1 mM DTT, 0.5 % Triton X-100 and protease inhibitors. After centrifuging at 16,000 x g for 30 min, the cleared lysate was incubated with rotation in 500 1 prewashed glutathione-Sepharose 4B slurry for 2 hrs at 4 C. The beads were washed with buffer containing 20 mM Tris*HCl, pH 8.0, with 500 mM NaCl, 1 mM EDTA, and protease inhibitors, without DTT. Finally, the GST-cofilin beads were resuspended in PBS buffer with protease inhibitors until use. The purity of GST-cofilin was checked by Coomassie Blue staining and GST Western blotting. RMC lysate (200–250 g total protein) in 50 mM Tris*HCl, pH 7.5, with 150 mM NaCl, 5 mM EGTA, 2 mM EDTA, 1 % Triton X-100, 100 mM maleimide and protease inhibitors) was rotated with 10 1 GST-cofilin beads (approximately equal to 10 g GST-cofilin) for 2 hrs at 4 C. The beads were washed three times with lysis buffer, resolved on SDS-PAGE without DTT, and blotted with CAP1 antibody to detect the co-precipitated CAP1. The ratio of CAP1 dimer to monomer in Cd-treated samples was quantified with NIH ImageJ.
Statistical Analyses:
Values combined from three or more experiments are expressed as mean ± s.d. Multiple comparisons are made, analysis is by one-way ANOVA followed by the Tukey-Kramer multiple comparison post hoc test, or by Dunnett’s test against a specified control treatment. Analyses were performed with Prism Software (GraphPad, San Diego, CA).
RESULTS
i). Cd2+ initiates CAP1 disulfide crosslinking
To obtain an overview of the thiol-dependent post-translation modifications caused by Cd we used sequential two-dimensional non-reducing/reducing SDS-PAGE (diagonal electrophoresis) (Brennan et al. 2004) of extracts from rat RMCs treated with 10 M CdCl2 for 6 h. An off-diagonal left-shifted spot representing disulfide crosslinking in the Cd-treated cells and absent in control cells (Fig. 1A) was excised and subjected to LC-MS/MS, which identified the spot as containing CAP1. Western blotting of the diagonal electrophoretic gel (Fig. 1B) confirmed the shift of a CAP1 spot. Non-reducing SDS PAGE and Western blotting with anti-CAP1 antibody (Fig. 1C) confirmed the dose-dependent occurrence of a new CAP1 species in extracts of Cd-treated cells. This species has an apparent molecular mass of approximately double the CAP1 monomer (117 kDa calculated from Fig. 2B vs. 56 kDa calculated for the monomer (expected, 52 kDa)). It was eliminated by DTT (Fig. 1C), and was also -mercaptoethanol-sensitive (data not shown), consistent with a disulfide crosslinked CAP1 dimer. A time course of dimer formation in the presence of 10 μM CdCl2 shows a rapid onset time-dependent increase in dimer that is highly significant by 1 h and continues to increase until at least 6 h in the continued presence of Cd2+ Fig. 2A). We examined reversibility by removing the Cd2+. Cells treated with 20 μM CdCl2 showed a substantial increase in CAP1 dimer by 30 min of exposure (Fig. 2B); when CdCl2 was removed after 3 h, dimer declined back to basal levels by 4 h (Fig. 2C).
Fig. 1 – Identification of CAP1 as a disulfide-crosslinked protein in Cd-treated cells.
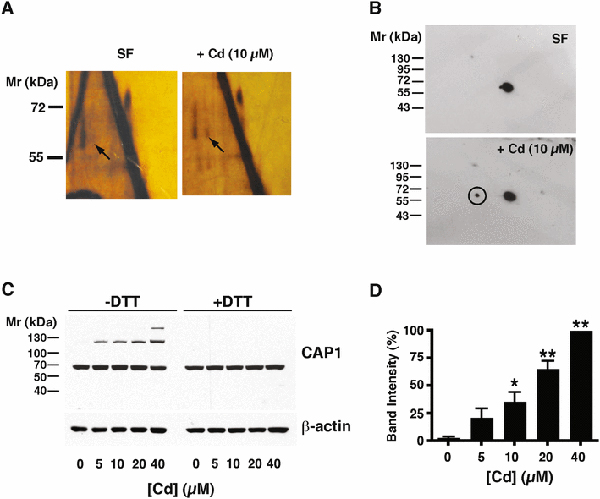
A) Two-dimensional electrophoresis of cell extracts of mesangial cells held in serum-free (SF) conditions for 6 h or treated with 10 μM CdCl2 under the same conditions. The gels are silver stained. Bulk proteins lie on the diagonal. Arrows indicate a spot migrating vertically off-diagonal after reduction, present in the Cd-treated cells that is absent in SF control. B) Western blot for CAP1 of gels similar to those shown in A). The major spot is on-diagonal, and the circled off-diagonal spot in the Cd-treated sample corresponds to the spot indicated by the arrow in A). The circled spot was excised and analyzed by mass spectrometry (see text). C) Western blot of CAP1 in extracts of cells treated with increasing concentrations of CdCl2, without (left side) or with (right side) dithiothreitol treatment, as indicated. A Western blot of -actin is shown as a loading control. D) The histogram to the right of the gel shows the intensity of the upper band from the -DTT cells (mean ± SD, n= 3). Values significantly different from the [Cd]=0 control calculated by ANOVA with Dunnett’s post hoc test are indicated (*, p<0.05; **, p<0.001).
Fig. 2 – Time course of CAP1 crosslinking and reversal.
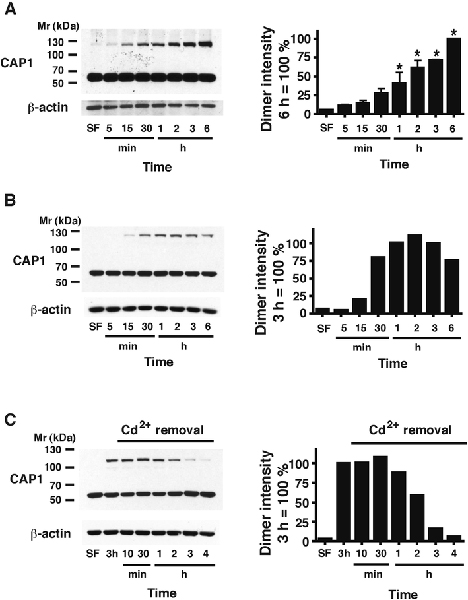
A) Quiescent RMC cultures were treated with 10 μM CdCl2 for the indicated times. A representative Western blot of CAP1, and of -actin on the same gel as a loading control, is shown. The average intensity (mean ± s.d., n=4) of the dimer band (taking the value at 6 h as 100%) is shown in the histogram. Significant increases above the serum-free (SF) control with no added Cd2+ are calculated by ANOVAwith Dunnett’s post hoc test; ** p < 0.01. B) A single experiment as in panel A) with [CdCl2] = 20 μM, the value at 3 h taken as 100 %. C) An experiment as in panel B), again taking the intensity at 3 h as 100 %, with Cd2+ removed at 3 h and the dimer intensity subsequently followed at intervals up to 4 h.
His-tagged recombinant CAP1 (rCAP1) was isolated from HEK cells transfected with a plasmid coding mouse CAP1. It gave rise to discrete bands at about 117 kDa and 56 kDa on non-reducing SDS PAGE, when the thiol-blocker maleimide was omitted from the lysis buffer. The 117 kDa band was DTT-sensitive (Fig. 3A). Mass spectrometric analysis of both excised bands of rCAP1 showed only CAP1 with some actin present, without significant levels of any other proteins, consistent with CAP1 crosslinking. The presence of actin as a contaminant in the bands is not surprising because CAP1 is an actin-monomer binding protein that co-purifies with abundant actin (Moriyama and Yahara 2002). Western blotting of rCAP1 confirms that both bands are recognized by an anti-His antibody (Fig. 3B). The intensity of the 117 kDa band was further increased by the disulfide bond-inducing reagent, diamide (Fig. 3B). A similar DTT-sensitive band was also observed in extracts of cells treated with diamide for 45 min in vivo (Fig. 3C).
Fig. 3 – Disulfide crosslinking of recombinant CAP1.
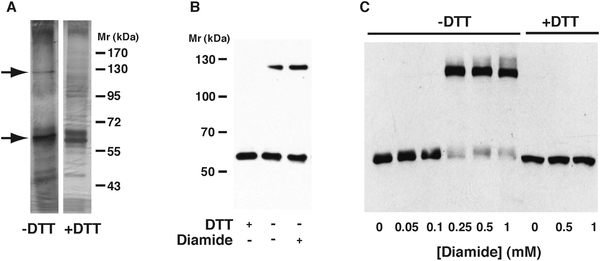
A) Silver stained gels of recombinant CAP1 protein under non-reducing condition (-DTT) or after treatment with dithiothreitol (+DTT). Arrows indicate the positions of monomereric (lower) and putative dimeric (upper) proteins. B) Western blot with anti-CAP1 antibody of recombinant CAP1 protein, showing a higher Mr band in the absence of DTT in native protein and after treatment with diamide. Note that different Mr markers are used on this gel, and because of better linearity the Mr values reported in the text (56 kDa and 117 kDa) were calculated from this marker set. C) Western blot of CAP1 in cell extracts after treatment with increasing concentrations of diamide. The upper band (putative dimer) appears above 0.1 mM diamide, at the expense of the monomeric protein, and is sensitive to DTT (three rightmost lanes).
ii). CAP1 dimerization and Cd2+oxidative stress
Possible mechanisms of a Cd2+-dependent increase in disulfide crosslinking include ROS-dependent thiol oxidation from increased ROS accumulation, decreased disulfide reduction capacity (e.g., decreased glutathione), or direct catalysis of disulfide formation via Cd-bridged thiols.
At a concentration of 5 μM, a 6-h treatment with Cd2+ decreased the basal level of ROS compared to control cells held in serum-free medium. However, at higher concentrations, ROS levels increased in a dose-dependent manner, significantly exceeding control values at 20 μM CdCl2 (Fig. 4A). The antioxidant BHA significantly decreased basal ROS levels, and abrogated the Cd2+-dependent increase in ROS (Fig. 4B). However, BHA treatment did not decrease basal levels of CAP1 dimer, and had no effect on dimer formation even at higher concentrations (20 μM and 40 μM) of Cd2+ (Fig. 5). We examined FeCl3, FeSO4, and CuSO4 (all at 100–800 μM) in order to assess the efects of other metal ions potentially increasing ROS (Fig. 6). Viability data for these various metal ion treatments show toxicity only at the higher concentrations (Supplementary material Fig. 1). Ferric ion, which we previously showed to increase ROS in RMC starting at 100 μM (Liu and Templeton 2015), did not induce dimer formation up to 800 μM, nor did either ferric ammonium citrate (not shown), ferric chloride (FeCl3), or ferrous sulfate (FeSO4) (Fig. 6A). Only at the highest concentration of 800 μM did another redox-active metal species, CuSO4, produce dimer. All Fe and Cu compounds showed increases in ROS at 100 μM and higher, with the highest levels associated with CuSO4 (Fig. 6B).
Fig. 4 – ROS production in mesangial cells.
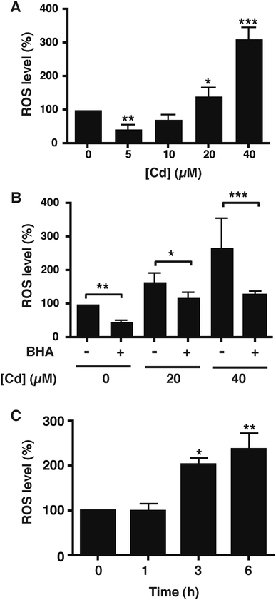
Total ROS levels in cell lysates were measured by DCF fluorescence in cells treated in serum-free conditions with the indicated concentrations of CdCl2 for 6 h. Values are mean ± SD and the mean value in cells without treatment (Cd or BHA) is taken as 100 %. A) Effect of increasing Cd concentrations on ROS levels. Significant differences from the Cd-free control are indicated (*, p<0.05; **, p<0.01; ***, p<0.001). Values are from 5 separate experiments. B) Cells were unexposed or exposed to 20 or 40 μM CdCl2 in serum-free conditions with or without a 1 h pretreatment with 100 μM BHA. Significant decreases with BHA at each Cd concentration are indicated (*, p<0.05; **, p<0.01; ***, p<0.001). Values are from 3 separate experiments. C) Time course of ROS production by RMC treated with 20 μM CdCl2 in serum-free medium. Significant increases in ROS from t = 0 are indicated (*, p<0.05; **, p<0.01; (n = 3)).
Fig. 5 – Effect of Cd and ROS on levels of CAP1 dimer.
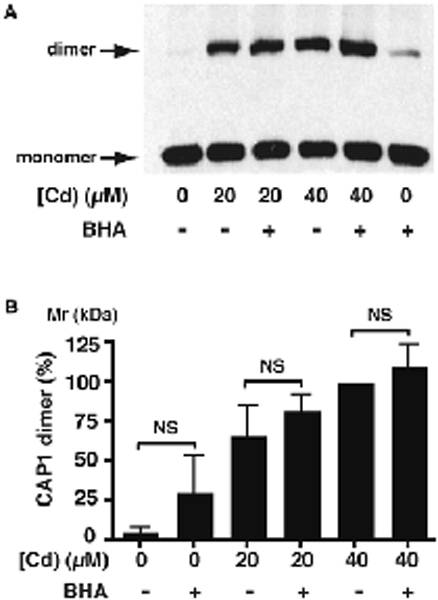
A) Western blot with anti- CAP1 antibody of cell extracts from mesangial cell cultures treated with 0, 20 or 40 μM CdCl2 for 6 h, with or without a 1-h pretreatment with BHA. B) The histogram shows the mean ± SD of the intensity of the dimer band indicated in A), from 4 separate experiments. Although the amount of CAP1 dimer increases with increasing Cd2+ concentration, there is no significant effect of BHA at any specific concentration.
Cells were pre-treated with 50 μM BSO for 16 h in 0.2 % FBS, which maintains RMC viability while depleting them of glutathione (Chin and Templeton 1993), and were subsequently exposed to CdCl2 in serum-free medium in the absence of BSO (because it may bind Cd2+). Without BSO pre-treatment, the expected dose-dependent increase in CAP1 dimer was seen with Cd2+ exposure (Fig 7). However, in BSO-treated cells, dimer was much more prominent at the lowest concentration (5 μM) of CdCl2, and the intensity of the dimer band began to diminish at higher concentrations. Whereas Cd2+ did not affect CAP1 monomer levels in control cells, even as dimer increased, in BSO-treated cells monomer levels declined with increasing Cd2+ concentration. A higher molecular mass species of anti-CAP1-reactive protein that became apparent only at the higher concentrations of Cd2+ in control cells was already prominent at 5 μM - 10 μM Cd2+ in the BSO-treated cells (uppermost arrow in Fig. 7). This may represent higher polymer forms such as tetramer (see Discussion) or crosslinking with actin, but this was not investigated further. This suggests that glutathione plays a role in the monomer-dimer equilibrium and suppresses the formation of more highly crosslinked states.
Fig. 7 – Effect of the glutathione synthesis inhibitor, BSO, on CAP1 levels.
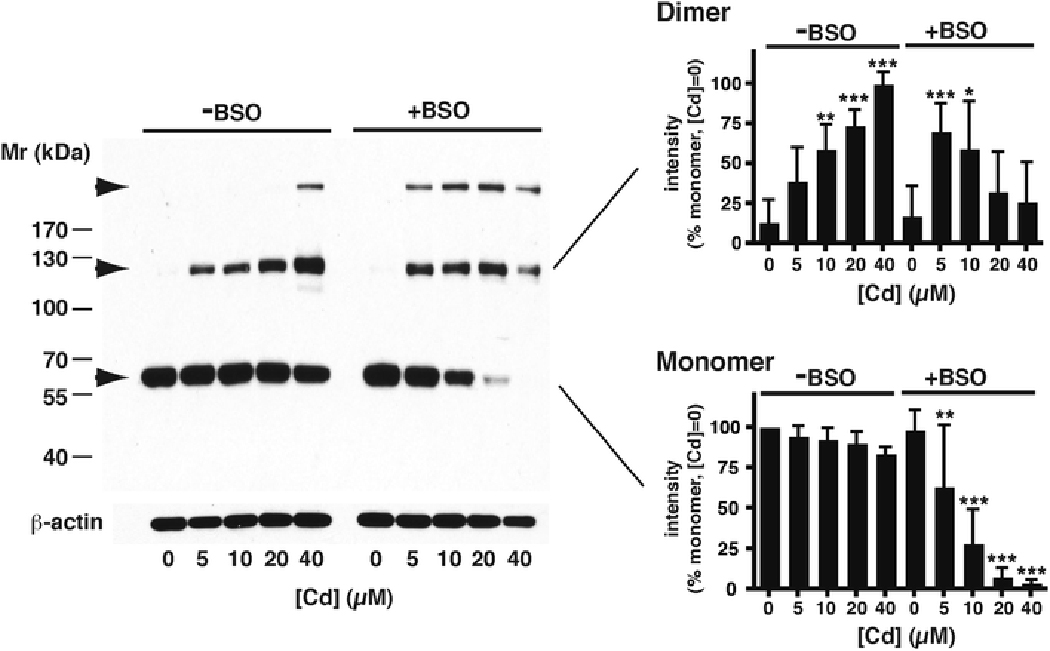
A typical Westerm blot of CAP1 is shown after treatment of cultures with increasing amounts of CdCl2 in serum-free conditions for 6 h, either without BSO (left side) or following 16 h pretreatment with BSO (right side). Arrows indicate the lower monomer band, intermediate dimer band, and a higher Mr band (upper-most arrow) discussed in the text. Blotting with anti- -actin antibody on the same gel is included as a loading control. The histograms show the mean ± SD (n=6) of intensities of the monomer and dimer bands, all normalized to the intensity of the monomer band without Cd or BSO treatment, taken as 100 %. Significant differences against the no-added Cd samples, of the same band within the same treatment group, are indicated (*, p<0.05; **, p<0.01; ***, p<0.001).
iii). Cytoskeletal structure following CAP1 silencing:
To determine if CAP1 might play a role in Cd-induced F-actin disruption, CAP1 expression was suppressed by transfection with CAP1 siRNA. The knock-down was efficient and affected both monomer and Cd-dependent dimer formation (Fig. 8A,B). In both scrambled-sequence transfected and silenced cells, treatment with CdCl2 showed a decrease in viability at 20 μM and above at 6 h, although in silenced cells the relative decrease in viability was less than in control cells (Table 1).
Fig. 8 – Silencing of mesangial cell CAP1 expression.
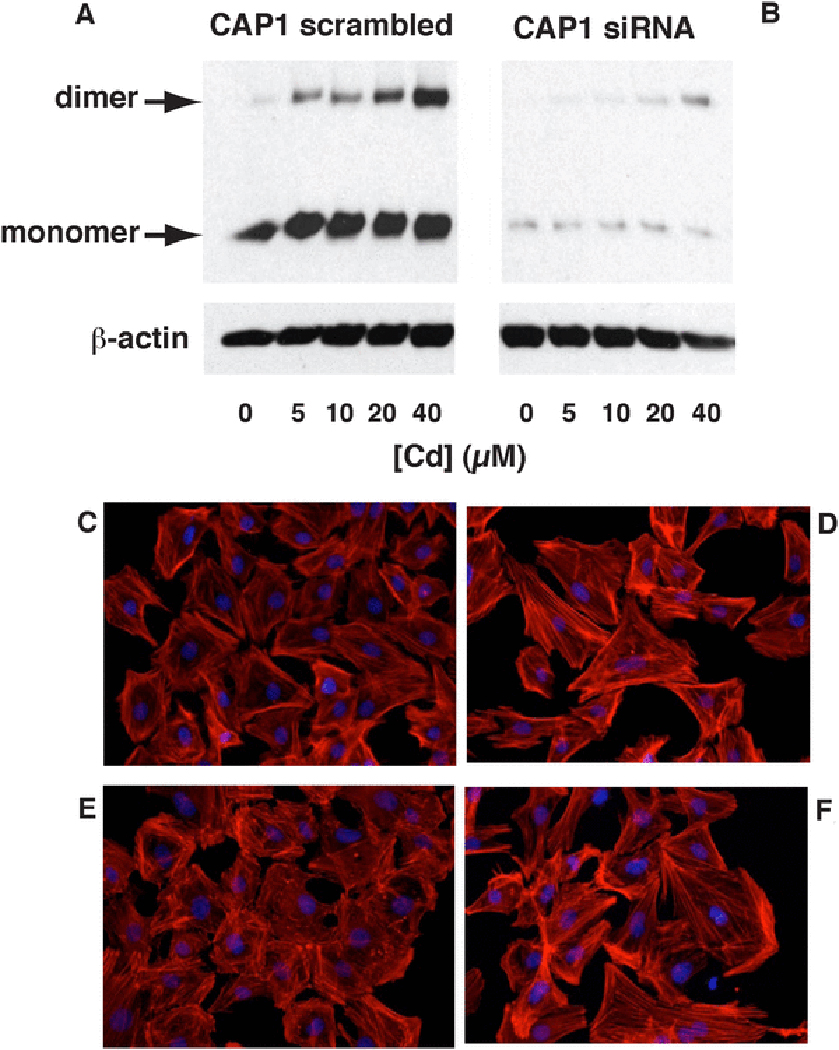
A) Western blot of CAP1 expression in extracts from cells transfected with a scrambled RNA sequence and subsequently exposed to increasing concentrations of CdCl2 for 6 h in serum-free medium. The positions of the monomer and dimer bands are indicated (arrows). A blot of -actin is included as a loading control. B) As in A, except the cells were transfected with a CAP1 siRNA sequence. C)-F) Cells stained for with rhodamine-conjugated phalloidin for F-actin (red) and DAPI (blue) nuclear stain. C) Cells transfected with scrambled RNA sequence. D) Cells transfected with siRNA sequence. E) Cells transfected with scrambled RNA sequence and subsequently exposed to CdCl2 (20 μM, 6 h). F) Cells transfected with siRNA sequence and subsequently exposed to CdCl2 (20 μM, 6 h).
Table 1 – Effect of CAP1 silencing on RMC viability.
RMC were transfected with either a scrambled-sequence control plasmid (SC) or an siRNA targeting CAP1, as described in Materials and Methods. Cells were then treated with the indicated concentration of CdCl2 for 6 h in serum-free medium and viability was measured by the MTT assay. The results are mean ± s.d. from quadruplicate wells at each condition, in a single experiment, taking the absorbance of the Cd-free control as 100 % in each data set. In the 3rd and 5th columns, Dunnett’s post hoc test is used to compare the value obtained at each [Cd2+] to the value at [Cd2+] = 0. The last column shows the results of the Tukey post hoc test on the full data set, comparing scrambled control to silenced cells at the same [Cd2+]. NS - not significant (p > 0.05).
| [Cd2+] (μM) |
SC (%) | p vs [Cd] = 0 (SC) (Dunnett) |
siRNA (%) | p vs [Cd] = 0 (si) (Dunnett) |
p, SC vs siRNA (Tukey) |
|---|---|---|---|---|---|
| (Dunnett) | (Dunnett) | (Tukey) | |||
| 0 | 99.9 ± 7.2 | - | 100 ± 2.8 | - | - |
| 10 | 109 ± 2.5 | NS | 107 ± 6.0 | NS | NS |
| 20 | 50.6 ± 6.8 | < 0.01 | 70.7 ± 1.8 | < 0.01 | < 0.001 |
| 40 | 31.3 ± 3.2 | < 0.01 | 51.9 ± 4.3 | < 0.01 | < 0.001 |
CAP1-silenced cells showed more prominent actin stress fibers than control cells transfected with a scrambled RNA sequence control (Fig. 8C,D). Twenty μM CdCl2, a concentration that causes a significant increase in both ROS levels and BSO-sensitive CAP1 dimer formation (see above), resulted in a marked disruption of F-actin structure in control cells (Fig. 8E). This was prevented by CAP1 silencing (Fig. 8F), suggesting that CAP1 is involved in F-actin disruption by Cd2+. The absolute F-actin:G-actin ratio measured by ultracentrifugation declined significantly from approximately 0.9 in scrambled-control transfected cells to 0.6 in silenced cells (Table 2), although CAP1 knock down caused a smaller decrease in the F:G ratio after Cd2+ treatment. Thus, more F-actin filaments are lost in the control cells after Cd2+ exposure, consistent with greater retention of cytoskeletal structure in silenced cells.
Table 2 – Ratio of filamentous actin to monomeric actin concentration in transfected RMC.
RMC were transfected with either a scrambled-sequence control plasmid (SC) or an siRNA targeting CAP1, as described in Materials and Methods, and then maintained in Cd-free conditions or treated for 6 h with 20 μM CdCl2. The results are mean ± s.d. from 4 independent experiments and significance is calculated by the Tukey post hoc test on the full data set. NS - not significant (p > 0.05).
| [Cd] (μM) | SC F:G | siRNA F:G | p, siRNA vs. SC |
|---|---|---|---|
| 0 | 0.87 ± 0.06 | 0.62 ± 0.02 | < 0.001 |
| 20 | 0.52 ± 0.03 | 0.44 ± 0.03 | NS |
iv). Cofilin binding
The supernatants and the F-actin pellets of the ultracentrifugation studies both contained CAP1 (Fig. 9A). In the scrambled control cytosol, CAP1 was predominantly in the supernatant, but also apparent in the F-actin fraction. When control cells were treated with CdCl2, a prominent monomer band was observed in the supernatant, but dimer was also discernible in the F-actin pellet. Dimer was enriched in the pellet, the dimer:monomer ratio being (172 ± 20) % of that in the supernatant (p < 0.05, n=3). With CAP1 silencing, neither monomer nor dimer was detected in the pellet, with or without Cd2+. Cofilin was detected in the control pellets (Fig. 9A), and was significantly increased in the F-actin fraction with Cd2+ treatment (Fig. 9B). With silencing, the amount of cofilin associated with F-actin was greatly decreased, and was unresponsive to Cd2+.
Fig. 9 – CAP1 and cofilin localization in F-actin pellets after CAP1 silencing.
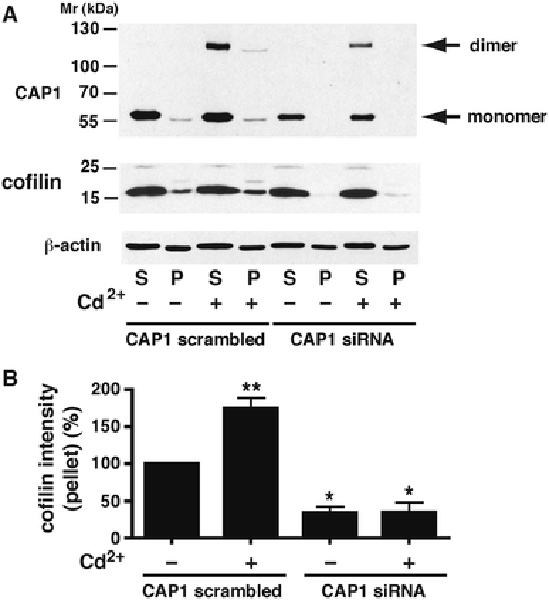
Ultracentrifugation was used to separate RMC lysates into supernatant (S) fractions containing G-actin and pellets (P) containing F-actin, as described in Materials and Methods. A) A representative Western blot of CAP1 (upper blot) shows the presence of monomer in the supernatant, and to a lesser extent in the pellet, in cells treated with a CAP1 scrambled sequence. After CdCl2 treatment (20 μM, 6 h), dimer appears in both S and P fractions. With silencing of CAP1, monomer and dimer are lost from the pellet, although some residual monomer and dimer remain in the supernatant. Dimer:monomer ratio in the pellets, reported in the text, were from longer exposures of the same CAP1 gels. The middle blot shows native cofilin present in both S and P fractions of the CAP1 scrambled-sequence controls, with or without CdCl2 treatment. After silencing, cofilin is lost from the pellet, and not restored by Cd2+ treatment. The lower blot shows -actin; the F:G actin ratio reported in Table 2 is calculated from such blots. All exposures are from the same gel. B) Histogram showing intensity of the cofilin band in the F-actin pellets of the transfectants, with or without Cd2+ treatment, from three independent experiments. The value in the P fraction of scrambled-sequence transfectants without Cd2+ treatment (‘control’) is taken as 100 %. ** above ‘control’, p < 0.01. * below ‘control’, p < 0.05.
An endogenous CAP1-cofilin interaction is too weak to demonstrate by co-immunoprecipitation (Zhang et al. 2013), so we used an in vitro recombinant GST-cofilin pull-down assay to examine whether CAP1 indeed played a role in the occurrence of cofilin in the F-actin fraction. GST-cofilin precipitated CAP1 monomer from lysates of serum-free control cells, and both monomer and dimer from Cd2+-treated samples (Fig. 10, lanes i,ii). Neither GST-cofilin beads without cell lysate nor glutathione Sepharose beads without conjugated GST-cofilin pulled down CAP1 (Fig. 10, lanes iii, iv), and served as negative controls. The dimer was enriched in the pull-down of Cd2+-treated cells, with a dime:monomer ratio in pull-down being (220 ± 100) % of that in the total lysate (p < 0.05, n=6).
Fig. 10 – Pulldown of CAP1 by GST-cofilin from lysates of Cd2+-treated cells.
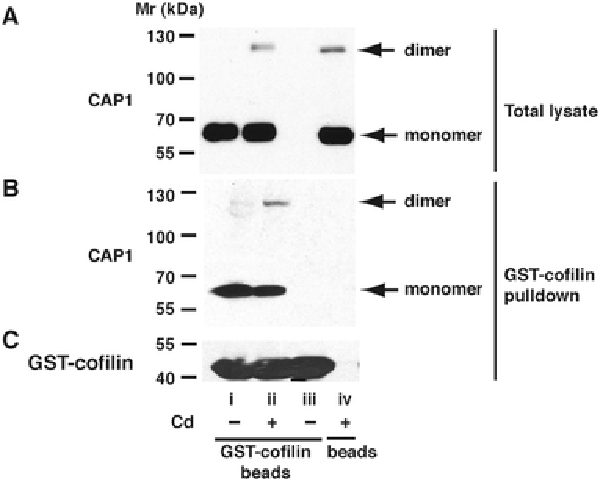
Blot A) shows the presence of CAP1 in the total lysate, with monomer and dimer bands indicated. Blot B) shows CAP1 pulled down from these lysates by GST-cofilin. Blot C) shows GST-cofilin in the same pulldowns as B). The labels under C) apply to all blots. Lane i - Lyastes from control cells, pulldown performed with GST-cofilin-conjugated beads. Lane ii - Lyastes from cells treated with 20 μM Cd2+, 6 h, pulldown performed with GST-cofilin-conjugated beads. iii) No cell lysate; GST-cofilin-conjugated beads in buffer alone. iv) Lysate of Cd2+-treated cells, pulldown procedure performed with glutathione Sepharose beads not conjugated with GST-cofilin.
v). Dimerization of mutants:
Site-directed mutagenesis was used to replace in turn each of the six Cys residues (cysteines 29, 92, 355, 374, 415 and 426) of mouse CAP1 with Ala, in order to attempt to produce a mutant(s) incapable of DTT-sensitive, Cd-induced dimerization. Each mutant was then expressed in HEK293 cells that were subsequently treated for 1 h with 0.5 mM diamide. His-tagged protein at 117 kDa, attributed to a CAP1 dimer, was observed in all preparations except the C29A-transfected cells (Fig. 11A), indicating a propensity of this protein to form multiple cross-linked species, but confirming that Cys29 is involved in Cd2+-specific dimerization. Higher molecular mass bands were observed in all preparations, reminiscent of the uppermost band indicated in Fig. 7, and a higher mass band is observed in diamide-treated human cells that lack the Cys29-dependent disulfide bond that forms in the presence of Cd2+ (Supplementary Fig. 2). Upon treatment with CdCl2, the CAP1 dimer band could be detected in the C92A, C355A, C374A, C415A and C426A mutants, although a clear dose dependence was not apparent, further supporting that Cys29 is responsible for Cd-induced CAP1 dimerization (Fig 11B). Increasing the Cd concentration to 40 μM and the exposure time to 24 h in C29A-transfected HEK293 cells still did not result in the appearance of dimer (Supplementary Fig. 3).
Fig. 11 – Transfection of HEK cells with cysteine-mutated CAP1 proteins.
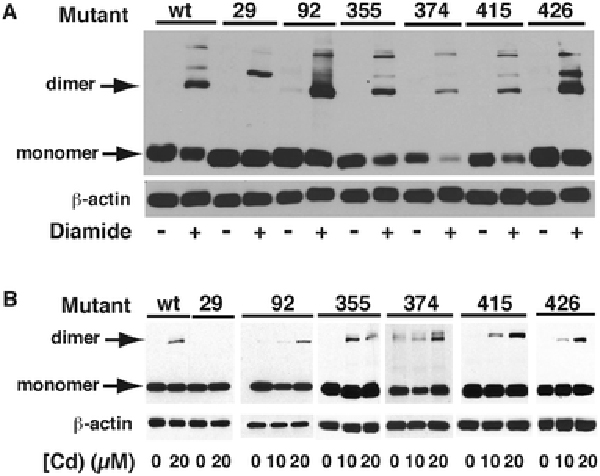
A) HEK293 cells were transfected with constructs coding wild type CAP1 (wt) or CAP1 in which each of the conserved Cys residues at positions 29, 92, 355, 374, 415, or 426 had been replaced in turn with alanine. Electrophoresis of total extracts from cells treated with diamide, or not, was performed and the gels were blotted with antibodies against His tag or -actin. The positions of the monomeric and 117 kDa dimeric CAP1 are shown. B) Cells transfected as in A) were exposed to 0, 10 or 20 μM CdCl2 for 6 h in serum-free conditions. Western blots show the presence of dimer under all conditions of Cd treatment except in the C29A mutant transfectants.
vi). Effects on mesangial cells of transfection with CAP1-C29A:
Rat mesangial cells were transfected with wt-CAP1 and mutant CAP1-C29A. Anti-His Western blotting (Fig. 12A) confirmed transfection with both constructs. Cadmium-induced dimer formation was apparent in wt CAP1-transfected cells, but not those transfected with C29A. Some wt-transfected cells (Fig. 12B) were smaller and had less prominent stress fibers, compared to non-transfected cells and C29A-expressing cells (Fig. 12C). An MTT assay showed C29A-transfected cells were more viable [(115 ± 7) %, p < 0.01, n = 3] than wt-transfected cells. [C29A (1.07 ± 0.03) vs. wt (0.93 ± 0.04), p < 0.01, n = 3]. Cadmium treatment caused wt-transfected cells (Fig. 12D) to lose stress fibers and collapse, while C29A-transfected cells maintained some cell shape and stress fiber content (Fig. 12E), although an MTT assay did not show any significant difference in viability between Cd-treated cells transfected with wt-CAP1 or CAP1-C29A. These data suggest that wt-CAP1 promotes actin depolymerization through dimer formation, while the C29A mutant lacking the ability to form dimer is less efficient at promoting actin disassembly.
Fig. 12 – Effects of Cd on mesangial cells transfected with CAP1 constructs.
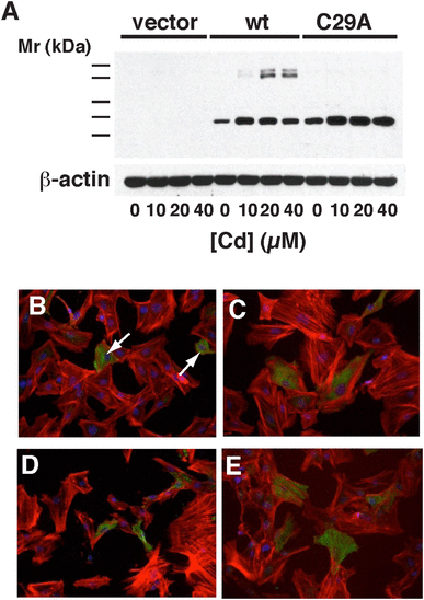
A) Mesangial cells were transfected with an empty vector or vectors containing either His- tagged wt CAP1 or CAP1 C29A mutant. An anti-His Western blot is shown of extracts from cells treated with increasing amounts of Cd. Monomeric CAP1 expression is evident in all wt and C29A transfectants whereas the upper dimeric band(s) appears only in the wt-transfected cells. A blot of -actin is included as a loading control. B)-E) rhodamine-conjugated phalloidin (red), anti-His (green), and DAPI (blue) staining of transfected cells. B) Cells transfected with wt CAP1. The arrow shows a shrunken His- positive cell. C) Cells transfected with the C29A mutant construct. D) Cells transfected with wt CAP1 and exposed to 10 μM CdCl2 in serum-free conditions for 6 h. E) Cells transfected with C29A mutant CAP1 and exposed to 10 μM CdCl2 in serum-free conditions for 6 h.
DISCUSSION
Redox sensing by proteins is a critical way in which cells can respond to their environment, not only by initiating protective mechanisms under conditions of oxidative stress, but also by harnessing prooxidant events for physiological signaling. Wang et al. (Wang et al. 2012) have defined redox sensing based on oxidation of protein thiols and the subsequent conformational changes. The multifunctional protein CAP1 participates in energy metabolism and signal transduction in yeast, and plays a role in coordinating actin cytoskelal dynamics in higher organisms and in yeast, but it is not known how it may respond to environmental stress. The observations that Cd, and treatment with the thiol oxidant diamide, induce intermolecular disulfide bond formation in CAP1, suggest that it may function as a redox sensor, and we present evidence that Cd-induced disulfide bond formation is linked to diminished stress fiber formation. The appearance of the dimer by 30 min of Cd2+ exposure, followed by its reversal within 3–4 h of Cd2+ removal, is consistent with a functional response.
Cadmium increases ROS levels in RMC, probably through several mechanisms, including depletion of antioxidant defenses, displacement of Fenton-active metals such as Cu2+ from other sites, inhibition of enzymes of mitochondrial electron transport (Templeton and Liu 2010; Thévenod 2009), and direct effects on mitochondrial function (López et al. 2006). Longer exposures are associated with induction of - glutamylcysteinyl synthase (leading to increased glutathione levels), catalase and metallothionein that may eventually mitigate these increases (Chin and Templeton 1993; Liu et al. 2009; Oh and Lim 2006). However, increased ROS levels alone do not seem to account for CAP1 crosslinking, as suppression of ROS with the antioxidant BHA had no inhibitory effect on either basal levels of the crosslinked species, or on those induced by Cd2+, even at higher concentrations of cadmium where ROS levels were maximal. Nor did the other redox active metals, Fe3+ and Cu2+, produce the dimer, except at the highest concentration of Cu2+. If Cd2+ cross-bridging of the thiols is involved in the crosslinking process, this might be explained by a similar mechanism for Cu2+. For instance, Cu2+ at high concentrations can replace Cd2+ in the thiol-bridging Cd2+-binding sites on metallothionein (Freisinger and Vasak 2012; Funk et al. 1987). Inhibition of glutathione synthesis, on the other hand, increases the extent of crosslinking, suggesting a role of reduced glutathione in maintaining basal levels of CAP1 monomer, as is to be expected if this protein indeed acts as a disulfide-dependent redox sensor. Although the exchangeable level of Cd2+ in the cytosol is buffered in the 1–2 pM range (Wang et al. 1996) and glutathione concentrations are in the mM region, Cd2+ can modulate glutathione levels by inducing oxidative stress and affecting enzymes involved in glutathione synthesis and redox cycling (Choong et al. 2014; Liu et al. 2009). When glutathione synthesis was inhibited, higher concentrations of Cd2+ produced higher mass species of CAP-1 at the expense of dimer, indicating that glutathione may play a role in preserving, rather than disrupting, Cd2+-induced dimer under normal circumstances. Interestingly, silencing CAP1 increased ROS levels in response to 40 μM Cd [(355 ± 44) % of Cd-free levels in CAP1-silenced cells vs. (203 ± 40) % in unsilenced, p < 0.01], suggesting CAP1 itself may contributing to mechanisms protective against Cd-induced ROS.
CAP1 is a cytoskeletal protein that functions as an actin disassembly factor and regulates actin dynamics through its interactions with actin and cofilin. The C-terminal domain of CAP1 recycles cofilin and ADP-actin monomers; the N-terminal domain assembles into a hexamer, binds F-actin and enhances cofilin-mediated severing of filaments (Jansen et al. 2014). CAP1 can dimerize or oligomerize with or without the presence of actin (Ono 2013a). A coiled-coil region and helical folded domain in the N-terminal, and a dimerization motif in the C-terminal, are involved in these selfassociations (Ono 2013a). Mutations in these three regions disrupt oligomerization and impair the CAP1/cofilin-mediated severing activity (Ono 2013a; Yu et al. 1999). However, no data show this dimerization or oligomerization to be thiol-dependent. Although we were unable to identify by mass spectrometry the precise Cys residue(s) involved in the putative dimerization observed in the present study, site-directed mutagenesis identifies Cys29 as the single residue required, suggesting preferential homodimerization at this site.
Our data show that Cd2+ does not change the expression level of CAP1 protein, suggesting Cd-induced actin depolymerization may rather be through CAP1 dimer formation. Actin filaments in RMC transfected with the C29A mutant (lacking the ability to form Cd-dependent dimer) show less disruption compared with wt-CAPl-transfected cells (see results section v). Covalent disulfide formation may stabilize the CAP1 hexamer required for cofilin-mediated severing activity. On prolonged treatment, or with mutation of Cys29, there is evidence of higher mass bands, also sensitive to disulfide reduction, that suggest other sites of crosslinking, or involvement of other partners, such as actin.
CAP1 functions as an actin disassembly-promoting factor through interaction with F-actin and cofilin. The association of CAP1 with F-actin has been shown by an in vitro F-actin co-sedimentation assay (Jansen et al. 2014; Normoyle and Brieher 2012), and the association of an N-terminal CAP1 peptide with actin filaments has been shown by electron microscopy (Jansen et al. 2014). The binding of CAP1 induces an F-actin conformational change that enhances cofilin-mediated actin severing (Jansen et al. 2014). Here we observed increased enrichment of the Cd-induced CAP1 disulfide-crosslinked dimer in the sedimented F-actin fraction, as well as an increased association of the dimer with cofilin. Thus, it would be expected that formation of the dimer would favour actin depolymerization and contribute to Cd-induced actin disruption, and several observations support this view. Silencing CAP1 improves RMC viability after Cd2+ treatment, and affords some protection of the cortical actin and stress fiber structure against Cd2+. Furthermore, in cells overexpressing a Cys29 mutant that is incapable of forming dimer, viability was improved and the cytoskeletal structure appeared more resistant to Cd2+, although no improvement in viability was found following Cd2+ treatment. Together, these observations indicate that Cd2+-induced CAP1 dimeriztion through Cys29 enhances CAP1 binding to cofilin and F-actin and decreases F-actin stability.
Cadmium leads to cytoskeletal disruption in RMC, and several mechanisms have been put forward that may account for this effect. Cd2+ has selective effects on actin polymerization in both mesangial and smooth muscle cells that are independent of Ca2+ (Wang et al. 1996; Wang and Templeton 1996). CaMK-II is one of numerous kinases activated by Cd2+ (Liu and Templeton 2007), and its isoform also translocates and binds to the RMC cytoskeleton upon Cd2+ treatment (Liu and Templeton.D.M. 2013); inhibition of CaMK-II protects against Cd-induced cytoskeletal disruption, but the targets of CaMK-II in Cd-dependent cytoskeletal dynamics are unknown. Cadmium causes translocation of the F-actin severing protein, gelsolin, to the cytoskeletal fraction (Apostolova et al. 2006), accompanied by production of a 50 kDa gelsolin cleavage fragment that is dependent on phosphorylation of CaMK-II (Liu and Templeton.D.M. 2013). Cadmium also depletes focal contacts of vinculin and focal adhesion kinase (FAK), and loss of these F-actin anchors also appears to facilitate F-actin destabilization (Choong et al. 2013a). Again, CaMK-II is involved; Cd2+ and CaMK-II are implicated in phosphorylation of FAK released from focal adhesions, and in its sequestration in a separate membrane compartment. While each of these effects are generally ROSindependent, low concentrations of Cd2+ (< 2 μM) lead to activation of glutaredoxin, with increased stabilization of actin, an effect that is lost at higher Cd2+ concentrations that increase ROS levels (Choong et al. 2013b). We may now include the possibility that Cd2+ affects the RMC cytoskeleton by interaction with CAP1 functioning as a redox-sensing protein, thus influencing CAP1’s involvement in cofilin/actin dynamics, as well as suppressing a role of CAP1 in modulating ROS levels, further revealing the complexity of effects of Cd2+ on the cytoskeleton.
While most CAP1 Cys residues are conserved among animal species, Cys29 seems somewhat unique to rat and mouse, but lacking in Drosophila and frog. Notably, despite 96 % sequence identity with rat CAP1, the human protein lacks Cys29 while conserving the remaining five cysteines. Consistent with this, we also found Cd2+-induced disulfide crosslinking in mouse NIH3T3 cells, but not in two human cell lines, HEK1 and HeLa (Supplementary Fig. 2). However, diamide did induce higher mass bands on CAP1 Western blots seen in human cell extracts (Supplementary Fig. 2), suggesting it can access other cysteines that Cd2+ does not, in human CAP1, to promote disulfide- dependent crosslinking. Lu et al. (Lu et al. 2015) found through disulfide proteome analysis that human CAP1 forms putative disulfide bonds between Cys375 and Cys416 after treatment of HUVEC with vascular endothelial-derived growth factor. The evolutionary significance of the absence of the rodent Cys29 in other species is unclear. As dimerization at this site favours actin disassembly and decreased viability, and the mutation C29A is partially protective, the absence of Cys29 in the human protein may be advantageous in protecting the cytoskeleton against certain kinds of stresses. Alternatively, other Cys residues may substitute for Cys29 in fulfilling a redox-sensing function in human cells. These hypotheses remain to be tested, but the present results do establish that Cd2+ induces a functional dimerization of CAP1 by crosslinking through Cys29.
Supplementary Material
Cells were exposed to various concentrations of Fe, Cu, or Cd salts, [M], under conditions reported in Fig. 6 of the main text. Viability was measured with an MTT assay (dimethylthiazolyl diphenyltetrazolium bromide, Sigma-Aldrich (St. Louis, MO)) as described previously (Liu and Templeton 2008). A significant decrease in viability was seen with (A) FeCl3 at 400 μM and above, and (B) FeSO4 and (C) CuSO4 only by 800 μM. Viability was decreased with (D) 20 μM CdCl2 and above. All values are from 4 measurements in a single experiment, with significance vs. no added metal at p<0.05 (*) or p<0.01 (**).
Different cell lines were held in serum free medium for 6 h without the addition of Cd2+, or supplemented with CdCl2 at the indicated concentrations up to 40 μM, or treated with diamide. Images are of Western blots of CAP1 protein in cell lysates from typical experiments. The positions of CAP1 monomer and dimer are shown to the right of panels C) and E). A) Human embryonic kidney cells. B) Human epithelial HeLa cells, with rodent-derived RMC shown in the right-most lane as a positive control for dimer. C) Mouse fibroblast NIH3T3 cell line. D) HeLa and E) NIH3T3 cells were treated for 45 min with increasing concentrations of diamide (compare Fig. 3, main text).
HEK cells were transfected with either wt or C29A CAP1 and extracts were subjected to Western blotting for dimer expression. A) Cells treated for 6 h in serum-free conditions with or without 40 μM CdCl2. B) Time course from 0–24 h of wt or C29A CAP1-transfected cells exposed to 40 μM CdCl2 in 10 %
Acknowledgment:
This work was funded by grant #418208 to DMT from the Natural Sciences and Engineering Research Council of Canada.
Footnotes
Conflict of interest: The authors declare that they have no conflict of interest.
REFERENCES
- Apostolova MD, Christova T, Templeton DM (2006) Involvement of gelsolin in cadmium-induced disruption of the mesangial cell cytoskeleton. Tox Sci 89:465–474 [DOI] [PubMed] [Google Scholar]
- Beyersmann D, Hechtenberg S (1997) Cadmium, gene regulation, and cellular signalling in mammalian cells. Toxicol Appl Pharmacol 144:247–261 [DOI] [PubMed] [Google Scholar]
- Brennan JP, Wait R, Begum S, Bell JR, Dunn MJ, Eaton P (2004) Detection and mapping of widespread intermolecular protein disulfide formation during cardiac oxidative stress using proteomics with diagonal electrophoresis. J Biol Chem 279:41352–41360 [DOI] [PubMed] [Google Scholar]
- Chaudhry F, Breitsprecher D, Little K, Sharov G, Sokolova O, Goode BL (2013) Srv2/cyclase-associated protein forms hexameric shurikens that directly catalyze actin filament severing by cofilin. Mol Biol Cell 24(1):31–41 [DOI] [PMC free article] [PubMed] [Google Scholar]
- Chin TA, Templeton DM (1993) Protective elevations of glutathione and metallothionein in cadmium-exposed mesangial cells. Toxicology 77:145–156 [DOI] [PubMed] [Google Scholar]
- Choong G, Liu Y, Templeton DM (2013a) Cadmium affects focal adhesion kinase (FAK) in mesangial cells: Involvement of CaMK-II and the actin cytoskeleton. J Cell Biochem 114:1832–1842 [DOI] [PubMed] [Google Scholar]
- Choong G, Liu Y, Templeton DM (2014) Interplay of cadmium and calcium in mediating cadmium toxicity. Chemico-Biol Interact 211:54–65 [DOI] [PubMed] [Google Scholar]
- Choong G, Liu Y, Xiao W, Templeton DM (2013b) Cadmium-induced glutathionylation of actin occurs through a ROS-independent mechanism: implications for cytoskeletal integrity. Toxicol Appl Pharmacol 272:423–430 [DOI] [PubMed] [Google Scholar]
- Dalle-Donne I, Giustarini D, Rossi R, Colombo R, Milzani A (2003) Reversible S- glutathionylation of Cys374 regulates actin filament formation by inducing structural changes in the actin molecule. Free Radic Biol Med 34:23–32 [DOI] [PubMed] [Google Scholar]
- Field J, Vojtek A, Ballester R, et al. (1990) Cloning and characterization of CAP, the S. cerevisiae gene encoding the 70 kd adenylyl cyclase-associated protein. Cell 61:319–327 [DOI] [PubMed] [Google Scholar]
- Freeman NL, Field J (2000) Mammalian homolog of the yeast adenylyl cyclase associated protein, CAP/Srv2p, regulates actin filament assembly. Cell Motil Cytoskel 45:106–120 [DOI] [PubMed] [Google Scholar]
- Freisinger E, Vasàk M (2012) Cadmium in metallothioneins. Metal Ions Life Sci 11:339–371 [DOI] [PubMed] [Google Scholar]
- Funk AE, Day FA, Brady FO (1987) Displacement of zinc and copper from copper-induced metallothionein by cadmium and by mercury: in vivo and ex vivo studies. Comp Biochem Physiol C 86:1–6 [DOI] [PubMed] [Google Scholar]
- Furukawa R, Maselli A, Thomson SAM, Lim RWL, Stokes JV, Fechheimer M (2003) Calcium regulation of actin crosslinking is important for function of the actin cytoskeleton in Dictyostelium. J Cell Sci 116:187–196 [DOI] [PubMed] [Google Scholar]
- Gerst JE, Ferguson K, Vojtek A, Wigler M, Field J (1991) CAP is a bifunctional component of the Saccharomyces cerevisiae adenylyl cyclase complex. Mol Cell Biol 11:1248–1257 [DOI] [PMC free article] [PubMed] [Google Scholar]
- Hartwig A (1994) Role of DNA repair inhibition in lead- and cadmium-induced genotoxicity: A review. Environ Health Perspect 102(Suppl.3):45–50 [DOI] [PMC free article] [PubMed] [Google Scholar]
- Hubberstey AV, Mottillo EP (2002) Cyclase-associated proteins: CAPacity for linking signal transduction and actin polymerization. FASEB J 16:487–499 [DOI] [PubMed] [Google Scholar]
- Jansen S, Collins A, Golden L, Sokolova O, Goode BL (2014) Structure and mechanism of mouse cyclase-associated protein (CAP1) in regulating actin dynamics. J Biol Chem 289:30732–39742 [DOI] [PMC free article] [PubMed] [Google Scholar]
- Lee SH, Dominguez R (2010) Regulation of actin cytoskeleton dynamics in cells. Mol Cells 29:311–325 [DOI] [PMC free article] [PubMed] [Google Scholar]
- Liu J, Qu W, Kadiiska MB (2009) Role of oxidative stress in cadmium toxicity and carcinogenesis. Toxicol Appl Pharmacol 238:209–214 [DOI] [PMC free article] [PubMed] [Google Scholar]
- Liu Y, Templeton DM (2007) Cadmium activates CaMK-II and initiates CaMK-II- dependent apoptosis in mesangial cells. FEBS Lett 581:1481–1486 [DOI] [PubMed] [Google Scholar]
- Liu Y, Templeton DM (2008) Initiation of caspase-independent death in mouse mesangial cells by Cd2+: involvement of p38 kinase and CaMK-II. J Cell Physiol 217:307–318 [DOI] [PubMed] [Google Scholar]
- Liu Y, Templeton DM (2010) Role of the cytoskeleton in Cd2+-induced death of mouse mesangial cells. Can J Physiol Pharmacol 88:341–352 [DOI] [PubMed] [Google Scholar]
- Liu Y, Templeton DM (2015) Iron-dependent turnover of IRP-1/c-aconitase in kidney cells. Metallomics 7:766–775 [DOI] [PubMed] [Google Scholar]
- Liu Y, Templeton DM (2013) Involvement of CaMK-IIö and gelsolin in Cd2+- dependent cytoskeletal effects in mesangial cells. J Cell Physiol 228:78–86 [DOI] [PubMed] [Google Scholar]
- Liu Y, Xiao W, Templeton DM (2014) Cadmium-induced aggregation of iron regulatory protein-1. Toxicology 324:108–115 [DOI] [PubMed] [Google Scholar]
- López E, Arce C, Oset-Gasque MJ, Canadas S, González MP (2006) Cadmium iinduces reactive oxygen species generation and lipid peroxidation in cortical neurons in culture. Free Radic Biol Med 40:940–951 [DOI] [PubMed] [Google Scholar]
- Lu S, Fan S-B, Yang B, et al. (2015) Mapping native disulfide bonds at a proteome scale. Nature Methods 12:329–331 [DOI] [PubMed] [Google Scholar]
- Moriyama K, Yahara I (2002) Human CAP1 is a key factor in the recycling of cofilin and actin for rapid actin turnover. J Cell Sci 115(1591–1601) [DOI] [PubMed] [Google Scholar]
- Nordberg GF (2009) Historical perspectives on cadmium toxicology. Toxicol Appl Pharmacol 238:192–200 [DOI] [PubMed] [Google Scholar]
- Normoyle KPM, Brieher WM (2012) Cyclase-associated protein (CAP) acts directly on F-actin to accelerate cofilin-mediated actin severing across the range of physiological pH. J Biol Chem 287(42):35722–35732 [DOI] [PMC free article] [PubMed] [Google Scholar]
- Oh S-H, Lim S-C (2006) A rapid and transient ROS generation by cadmium triggers apoptosis via caspase-dependent pathway in HepG2 cells and this is inhibited through N-acetylcysteine-mediated catalase upregulation. Toxicol Appl Pharmacol 212:212–223 [DOI] [PubMed] [Google Scholar]
- Olson EN, Nordheim A (2010) Linking actin dynamics and gene transcription to drive cellular motile functions. Nat Rev Mol Cell Biol 11:353–365 [DOI] [PMC free article] [PubMed] [Google Scholar]
- Ono S (2013a) The role of cyclase-associated protein in regulating actin filament dynamics - more than a monomer-sequestration factor. J Cell Sci 126(Pt 15):3249–58 [DOI] [PMC free article] [PubMed] [Google Scholar]
- Ono S (2013b) The role of cyclase-associated protein in regulating actin filament dynamics - more than a monomer-sequestration factor. J Cell Sci 126:3249–3258 [DOI] [PMC free article] [PubMed] [Google Scholar]
- Peche V, Shekar S, Leichter M, et al. (2007) CAP2, cyclase-associated protein 2, is a dual compartment protein. Cell Mol Life Sci 64:2702–2715 [DOI] [PMC free article] [PubMed] [Google Scholar]
- Pope B, Maciver S, Weeds A (1995) Localization of the calcium-sensitive actin monomer binding site in gelsolin to segment 4 and identification of calcium binding sites. Biochemistry 34:1583–1588 [DOI] [PubMed] [Google Scholar]
- Quintero-Monzon O, Jonasson EM, Bertling E, et al. (2009) Reconstitution and dissection of the 600-kDa Srv2/CAP complex: roles for oligomerization and cofilin-actin binding in driving actin turnover. J Biol Chem 284:10923–10934 [DOI] [PMC free article] [PubMed] [Google Scholar]
- Shima F, Okada T, Kido M, et al. (2000) Association of yeast adenylyl cyclase with cyclase-associated protein CAP forms a second Ras-binding site which mediates its Ras-dependent activation. Mol Cell Biol 20:26–33 [DOI] [PMC free article] [PubMed] [Google Scholar]
- Templeton DM, Liu Y (2010) Multiple roles of cadmium in cell death and survival. Chemico-Biol Interact 188:267–275 [DOI] [PubMed] [Google Scholar]
- Thϩvenod F (2009) Cadmium and cellular signaling cascades: to be or not to be? Toxicol Appl Pharmacol 238:221–239 [DOI] [PubMed] [Google Scholar]
- Thϩvenod F, Lee W-K (2013) Toxicology of cadmium and its damage to mammalian organs In: Sigel A, Sigel H, Sigel RK (eds) Cadmium: From Toxicity to Essentiality. Springer, Dordrecht, p 415–490 [DOI] [PubMed] [Google Scholar]
- Thϩvenod F, Lee W-K (2015) Live and let die: roles of autophagy in cadmium nephrotoxicity. Toxics 3:130–151 [DOI] [PMC free article] [PubMed] [Google Scholar]
- Vandekerchove J (1993) Actins. In: Kreis T, Vale R (eds) Guidebook to the Cytoskeletal and Motor Proteins. Oxford University Press, Oxford, p 13–15 [Google Scholar]
- Wang Y, Yang J, Yi J (2012) Redox sensing by proteins: oxidative modifications on cysteines and the consequent events. Antiox Redox Signal 16(7):649–657 [DOI] [PubMed] [Google Scholar]
- Wang Z, Chin TA, Templeton DM (1996) Calcium-independent effects of cadmium on actin assembly in mesangial and vascular smooth muscle cells. Cell Motil Cytoskel 32:208–222 [DOI] [PubMed] [Google Scholar]
- Wang Z, Templeton DM (1996) Cellular factors mediate cadmium-dependent actin depolymerization. Toxicol Appl Pharmacol 139:115–121 [DOI] [PubMed] [Google Scholar]
- Wang Z, Templeton DM (1998) Induction of c-fos proto-oncogene in mesangial cells by cadmium. J Biol Chem 273:73–79 [DOI] [PubMed] [Google Scholar]
- Xiao W, Liu Y, Templeton DM (2009) Pleiotropic effects of cadmium in mesangial cells. Toxicol Appl Pharmacol 238:315–326 [DOI] [PubMed] [Google Scholar]
- Yu J, Wang C, Palmieri SJ, Haarer BK, Field J (1999) A cytoskeletal localizing domain in the cyclase-associated protein, CAP/Srv2p, regulates access to a distant SH3- binding site. J Biol Chem 274:19985–19981 [DOI] [PubMed] [Google Scholar]
- Zhang H, Ghai P, Wu H, Wang C, Field J, Zhou G-L (2013) Mammalian adenylyl cyclase-associated protein 1 (CAP1) regulates cofilin function, the actin cytoskeleton, and cell adhesion. [Erratum appears in J. Biol. Chem. 288: 28306 (2013)]. J Biol Chem 288:20966–20977 [DOI] [PMC free article] [PubMed] [Google Scholar]
- Zhou G-L, Zhang H, Wu H, Ghai P, Field J (2014) Phosphorylation of the cytoskeletal protein CAP1 controls its association with cofilin and actin. J Cell Sci 127(23):5052–65 [DOI] [PMC free article] [PubMed] [Google Scholar]
Associated Data
This section collects any data citations, data availability statements, or supplementary materials included in this article.
Supplementary Materials
Cells were exposed to various concentrations of Fe, Cu, or Cd salts, [M], under conditions reported in Fig. 6 of the main text. Viability was measured with an MTT assay (dimethylthiazolyl diphenyltetrazolium bromide, Sigma-Aldrich (St. Louis, MO)) as described previously (Liu and Templeton 2008). A significant decrease in viability was seen with (A) FeCl3 at 400 μM and above, and (B) FeSO4 and (C) CuSO4 only by 800 μM. Viability was decreased with (D) 20 μM CdCl2 and above. All values are from 4 measurements in a single experiment, with significance vs. no added metal at p<0.05 (*) or p<0.01 (**).
Different cell lines were held in serum free medium for 6 h without the addition of Cd2+, or supplemented with CdCl2 at the indicated concentrations up to 40 μM, or treated with diamide. Images are of Western blots of CAP1 protein in cell lysates from typical experiments. The positions of CAP1 monomer and dimer are shown to the right of panels C) and E). A) Human embryonic kidney cells. B) Human epithelial HeLa cells, with rodent-derived RMC shown in the right-most lane as a positive control for dimer. C) Mouse fibroblast NIH3T3 cell line. D) HeLa and E) NIH3T3 cells were treated for 45 min with increasing concentrations of diamide (compare Fig. 3, main text).
HEK cells were transfected with either wt or C29A CAP1 and extracts were subjected to Western blotting for dimer expression. A) Cells treated for 6 h in serum-free conditions with or without 40 μM CdCl2. B) Time course from 0–24 h of wt or C29A CAP1-transfected cells exposed to 40 μM CdCl2 in 10 %


