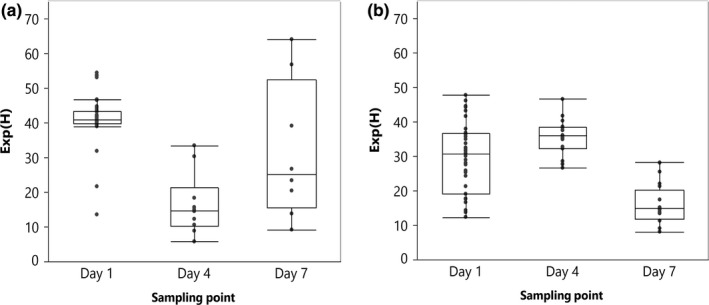
Figure 2.

Exponentially transformed Shannon index [Exp(H)] of the bacterial communities inhabiting floral nectar of apple (a) (59 samples) and pear (b) (71 samples) over three time points, including start of the flowering period (day 1), peak blooming (day 4), and three days later (day 7). Outlier box plots represent the distribution of the samples around the median (horizontal line within the box). The first and third quartiles are the ends of the box
