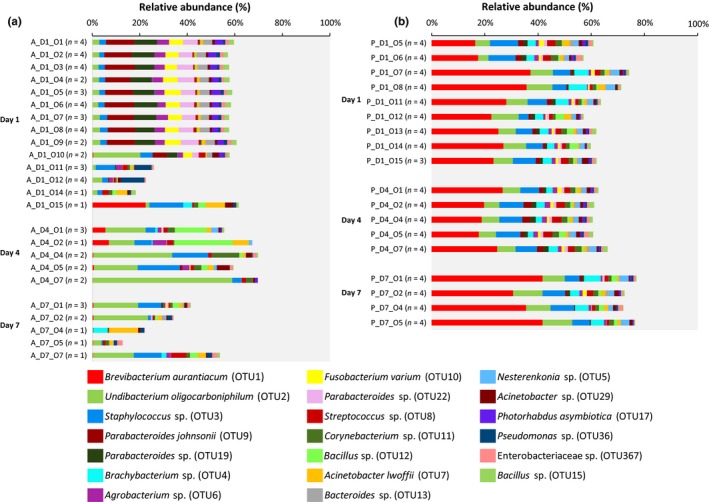
Figure 6.

Relative abundance (%) of the 20 most abundant OTUs (both fruit species considered together) in floral nectar from apple (a) and pear (b) over three sampling points, including start of the flowering period (day 1), peak blooming (day 4), and three days later (day 7). Data are grouped per orchard; the number of trees sampled is given between brackets. OTUs were identified by a BLAST search against type materials in GenBank. Identification up to the species level is given when only 1 top hit was obtained. For identity percentages with GenBank entries, see Table 2. Sample ID: A: apple, P: pear, D: day, O: orchard
