Abstract
Bifidobacterium and Lactobacillus are beneficial for human health, and many strains of these two genera are widely used as probiotics. We used two large datasets published by the American Gut Project (AGP) and a gut metagenomic dataset (NBT) to analyze the relationship between these two genera and the community structure of the gut microbiota. The meta‐analysis showed that Bifidobacterium, but not Lactobacillus, is among the dominant genera in the human gut microbiota. The relative abundance of Bifidobacterium was elevated when Lactobacillus was present. Moreover, these two genera showed a positive correlation with some butyrate producers among the dominant genera, and both were associated with alpha diversity, beta diversity, and the robustness of the gut microbiota. Additionally, samples harboring Bifidobacterium present but no Lactobacillus showed higher alpha diversity and were more robust than those only carrying Lactobacillus. Further comparisons with other genera validated the important role of Bifidobacterium in the gut microbiota robustness. Multivariate analysis of 11,744 samples from the AGP dataset suggested Bifidobacterium to be associated with demographic features, lifestyle, and disease. In summary, Bifidobacterium members, which are promoted by dairy and whole‐grain consumption, are more important than Lactobacillus in maintaining the diversity and robustness of the gut microbiota.
Keywords: American Gut Project, Bifidobacterium, diversity, Lactobacillus, network, zero‐inflated negative binomial
Our study has shown that Bifidobacterium, as a dominant genus, played an important role in terms of the diversity and stability of gut microbiota examined using American Gut Project. It is more helpful to increase the alpha diversity and the stability of gut microbiota than Lactobacillus. Furthermore, we found that whole‐grain consumption and fruit consumption could increase the abundance of Bifidobacterium.
1. INTRODUCTION
The human gut is colonized by an abundance of bacteria, with an estimated count of 3 × 10¹³ (Sender, Fuchs, & Milo, 2016). The human gut is normally colonized by three groups of bacteria: commensals, pathobionts, and probiotics (Vitetta, Saltzman, Nikov, Ibrahim, & Hall, 2016). The bacterial species most often utilized as probiotics are from the genera Bifidobacterium and Lactobacillus, which are proven to be beneficial to human health (Salminen et al., 1998). Various strains of Bifidobacterium and Lactobacillus have been reported to suppress diarrhea, alleviate lactose intolerance and postoperative complications, exhibit antimicrobial and anticolorectal cancer activities, reduce symptoms of irritable bowel syndrome (IBS), and prevent inflammatory bowel disease (IBD) (Bermudez‐Brito, Plaza‐Díaz, Muñoz‐Quezada, Gómez‐Llorente, & Gil, 2012). The diversity and robustness of the bacterial community in any ecosystem are two aspects usually explored in ecological studies (Ives & Carpenter, 2007), and greater diversity of the intestinal microbiota appears to be associated with better health (Claesson et al., 2012). However, the conclusions of previous studies regarding whether oral administration of Bifidobacterium and Lactobacillus species increases the alpha diversity of the human gut microbiota are not consistent (Karlsson et al., 2010; Kato‐Kataoka et al., 2016; van Zanten et al., 2014). In addition, the role played by Bifidobacterium and Lactobacillus in diseases, such as IBS (Cozmapetruţ, Loghin, Miere, & Dumitraşcu, 2017), and allergy (Mennini, Dahdah, Artesani, Fiocchi, & Martelli, 2017) remains uncertain. Apart from the facts mentioned above, most previous studies focus on the diversity, community composition and their variation of the gut microbiota, and rarely on the relationships between microbial species (Li & Wu, 2018). At the same time, bacterial network analysis gives new insight into the interspecies interaction of bacterial communities and promotes the understanding of the niche spaces among community members (Barberán, Bates, Casamayor, & Fierer, 2012). To our knowledge, the effect of certain taxa on the bacterial network has rarely been reported. To build a bacterial network, it will be difficult to determine whether or not cooccurrence patterns are statistically significant without a sufficiently large sample set (Barberán et al., 2012).
However, only a few large datasets for the gut microbiota have been constructed. To our knowledge, the American Gut Project (AGP) is one of the largest datasets on the human gut microbiota (http://americangut.org/about/). Regardless, the return of samples through the mail at room temperature without preservatives, possibly leading to the outgrowth of some bacteria in the samples, is a limitation of the AGP dataset (http://americangut.org/how-it-works/). It should be noted that researchers of the AGP group proved the feasibility of correcting the microbiome profiles in the AGP dataset by deleting “blooming” taxa to ensure that the results obtained from the dataset are trustworthy (Amir et al., 2017). The gut metagenome dataset published by Li et al., (2014) (NBT) is another large dataset, consisting of 1,267 fecal samples. The number of samples in these gut metagenome datasets is large enough for use in further validation.
Although many studies have focused on characterizing the function of these two genera, there are very few studies about the correlation between them and the community structure of the bacterial network. Therefore, we designed the present study to analyze the relationship between these two genera and the community structure of the gut microbiota to explore the potential role of these two genera to the characterizations of the gut microbiota.
2. METHODS
2.1. Data acquisition and processing
Construction of the AGP dataset was accompanied by the completion of metadata questionnaires, which included questions on demographic features, lifestyle, and disease. To avoid bias caused by DNA extraction, library preparation methods, and the sequencing platform (Costea et al., 2017), all samples were analyzed via the procedure described in the Earth Microbiome Project (Earth Microbiome Project 16S Illumina Amplicon Protocol, http://press.igsb.anl.gov/earthmicrobiome/protocols-and-standards/16s/). Raw data and information from the questionnaires were downloaded from EBI (Accession #ERP012803). DADA2 was used to infer the amplicon sequence variants (ASVs) present in each sample (Callahan et al., 2016). Forward reads were trimmed and filtered, with reads truncated at 140 nt, no ambiguous bases allowed, and each read required to have less than two expected errors based on quality scores. Taxonomic assignment was performed against the Silva v132 database (Quast et al., 2012). We performed species‐level assignments based on exact matching by using addSpecies in DADA2. To avoid bias caused by the sequencing depth, we collected sequencing data for fecal samples with one criterion: More than ten thousand sequencing reads must be available for each sample (Figure A1 in Appendix 1). We selected 12,127 gut samples (AGP dataset) from the dataset of 19,327 samples (downloaded on Jan. 25, 2018). Due to the low quality of some sequencing data, we excluded 383 samples from the cohort. Furthermore, we deleted the top 10 “blooming” taxa suggested by Amir and colleagues to yield results consistent with published microbiome studies performed using frozen or otherwise preserved samples (Amir et al., 2017). To simplify downstream analysis, we applied a frequency filter for 128,145 ASVs, where taxa were retained only if they were found in at least 1% of the samples (117 samples), according to a previous study (Fitzpatrick et al., 2018). Ultimately, we obtained a dataset consisting of 11,744 samples with 1,409 ASVs, with 8,629 samples from the USA and 2,560 from the United Kingdom; the majority of the individuals represented in the dataset are Caucasian White (n = 10,201) (Table A1 in Appendix 1). Considering that the sample from the AGP dataset is very heterogeneous with many diseases, we excluded samples from infants and individuals with diseases (Table A2 in Appendix 1), which might cause bias in the further analysis (Stewart et al., 2018; Tremaroli & Backhed, 2012). Finally, 2,186 samples were included in the ensuing analysis (Table A3 in Appendix 1).
To further test the results obtained from the AGP dataset, we downloaded a genus profile for 1,267 samples (http://meta.genomics.cn/meta/dataTools). These data were generated from high‐throughput metagenomic sequencing and annotated based on reference genomes to obtain the relative abundance of the genera in the profile (Li et al., 2014). This dataset consisted of 760 European samples (Le Chatelier et al., 2013; Nielsen et al., 2014; Qin et al., 2010), 368 Chinese samples (Qin et al., 2012), and 139 American samples (Methe et al., 2012).
2.2. Identification of dominant genera
A previous study first proposed the concept of dominant soil bacterial phylotypes, which represents a small subset of phylotypes that account for almost half of the 16S rRNA sequences recovered from soils, allowing the prediction of how future environmental change will affect the spatial distribution of these taxa (Delgado‐baquerizo et al., 2018). In our analysis of AGP data, we introduced the concept of dominant genera, which include those that are highly abundant (the top 10% most frequently found genera sorted by their percentage of relative abundance) and ubiquitous (found in more than 70% of the samples evaluated) (Delgado‐baquerizo et al., 2018; Soliveres et al., 2016).
2.3. Distance analysis of ASVs annotated as Bifidobacterium and Lactobacillus
Complete 16S rRNA gene sequences of species belonging to Bifidobacterium and Lactobacillus were downloaded from the SILVA database (Quast et al., 2012). Distance trees were constructed based on sequences of the V4 region via a neighbor‐joining algorithm (with 500 bootstrap replicates) available in Mega 7 software (Kumar, Stecher, & Tamura, 2016). Representative sequences from each species were randomly selected.
2.4. Diversity analysis
Alpha diversity was calculated using the vegan package (Zapala & Schork, 2006) in R software. Six indexes were applied in the analysis: the Shannon index, Chao1 index, observed ASVs, ACE index, inverse Simpson index, and Pielou index. Principal coordinate analysis (PCoA) was conducted using the data of Bray–Curtis dissimilarity data (Bray & Curtis, 1957). To assess whether the presence of the two genera was a significant factor for explaining variation in the gut microbiota, we devided the continuous variables of their abundance into categorical variables as explanatory factors. Taking Bifidobacterium, for example, we introduced two categories as explanatory factors according to its presence or not: One category is the samples with Bifidobacterium and the other is the samples without Bifidobacterium. And, permutational multivariate analysis of variance (PERMANOVA) was applied with a parameter of 9,999 permutations in R (Zapala & Schork, 2006).
2.5. Construction of microbial networks
Microbial network analysis has been employed to examine keystone taxa and relationships among the microbial community, which can provide useful information for further intervention (Banerjee, Schlaeppi, & van der Heijden, 2018). In the present study, we applied SParse InversE Covariance Estimation for Ecological ASsociation Inference (SPIEC‐EASI), a statistical method for the inference of microbial ecological networks from amplicon sequencing datasets (Kurtz et al., 2015). The network was constructed based on relative abundance at the genus level following the instructions at https://github.com/zdk123/SpiecEasi. Considering that increasing the rep.num argument may result in better performance (Kurtz et al., 2015), networks were constructed using the SPIEC‐EASI package in R with the default parameters, except that the parameters nlambda and rep.num were each set as 100 (Liu et al., 2017). The degree statistics is a measure of the centrality of nodes, with higher values indicating that the node is involved in more ecological interactions. We assessed the robustness of the different microbial association networks to random node removal (“attack”) (Albert, Jeong, & Barabasi, 2000; Iyer, Killingback, Sundaram, & Wang, 2013) using natural connectivity (Jun, Barahona, Yue‐Jin, & Hong‐Zhong, 2010) as a general measure of graph stability. We also measured how the natural connectivity of the microbial network changed when nodes and their associated edges were removed from the network (Mahana et al., 2016).
2.6. Regression analysis
Because of excessive zero abundance in the read counts and the overdispersion, a multiple zero‐inflated negative binomial (ZINB) regression model (Alan, 2015) was used to determine the differential abundance in the analysis of Bifidobacterium. The ZINB model consists of two different components: A logistic regression component for modeling excessive zeros and a negative binomial regression component for modeling the remaining count values. Missing data in each categorical variable were included in a separate hidden category (Hill, 2006). Overall, fitted mean proportions were calculated by the average predicted value (APV) method (Albert, Wang, & Nelson, 2014), in which Bifidobacterium count values are divided by the mean total read counts under each exposure status. The variables of host features were selected based on the record number and biological relevance, and 16 variables were retained for further study, namely, age, sex, race, geographical location, whole‐grain consumption, vegetable consumption, fruit consumption, milk and cheese consumption, C‐section, feeding patterns, antibiotic exposure, IBD, IBS, autoimmune disease, cardiovascular disease, and food allergy. To allow clear interpretation of the result, we divided frequency into three categories, “high frequency,” “low frequency,” and “never”. We divided the race into five categories, namely, “Caucasian White” (CW), “African‐American” (AA), “Hispanic” (HI), “Asian‐Pacific” (AP), and “Other”. We also divided geographical location into four new categories, namely, “North American” (NA), “Europe” (EU), “Oceania” (OC), and “Other”.
2.7. Statistical analysis
Statistical significance of the overlap was performed online (http://nemates.org/MA/progs/overlap_stats.html) and chi‐square test. Differences between groups were tested using Wilcoxon rank‐sum test. When multiple hypotheses were considered simultaneously, p‐values were adjusted to control the false discovery rate with the method described previously (Benjamini & Hochberg, 1995).
3. RESULTS
3.1. Bifidobacterium is a dominant genus in the human gut microbiota
Based on the criteria for defining dominant genera outlined in the Methods section, only 8.0% (22/276) of the bacterial genera among the 2,186 samples were dominant. However, this small number of genera accounted for an average of 64.4% of the relative abundance (Figure 1a). Bifidobacterium was among the dominant genera, whereas Lactobacillus was not subsamples from the USA and UK also showed that Bifidobacterium, but not Lactobacillus, was a dominant genus (Table A4, A5, A6 in Appendix 1). The significance of the overlap test suggested that the distribution of these two genera exhibited a close connection (Figure 1b, p < .001, chi‐square test). We also validated the result using another online statistic service (http://nemates.org/MA/progs/overlap_stats.html), and the result also revealed a close connection between Bifidobacterium and Lactobacillus (p < 3.6 × 10⁻⁶).
Figure 1.
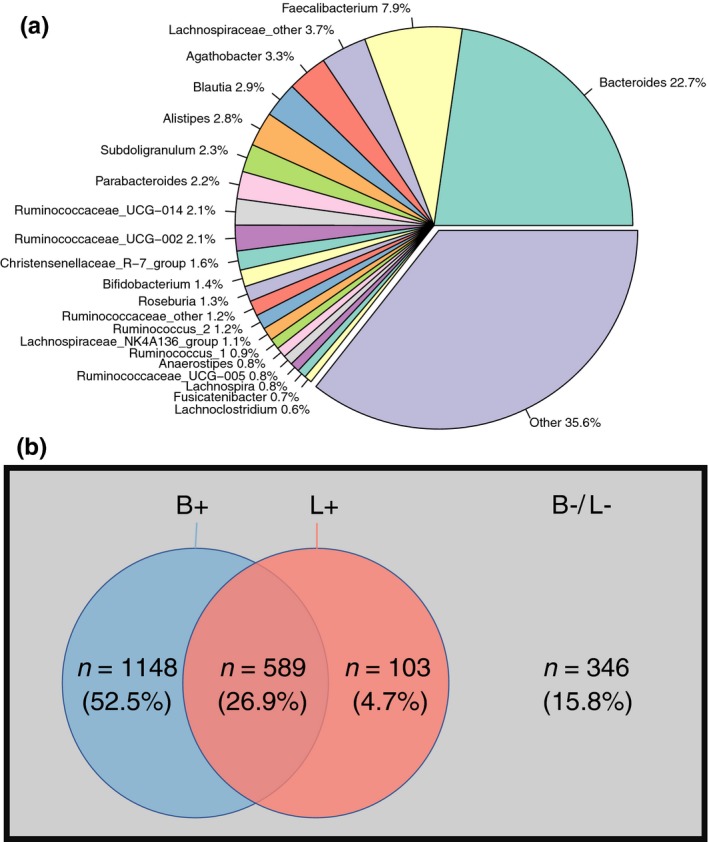
Composition and distribution of genera in the AGP dataset. (a) Genus composition among the 2,520 fecal samples in the AGP dataset. (b) Euler diagram of the cooccurrences of Bifidobacterium and Lactobacillus in samples. B+: samples containing Bifidobacterium; L+: samples containing Lactobacillus; B‐/L‐: samples containing neither Bifidobacterium nor Lactobacillus
Among the remaining 1,409 ASVs, 6 and 13 ASVs were annotated as Bifidobacterium and Lactobacillus, respectively (Table A7 in Appendix 1). The relative abundance of each ASV annotated as Bifidobacterium or Lactobacillus varied significantly, with only some ASVs dominating each genus (Figure A2). Although with the limitation of amplicon length makes it difficult to classify ASVs at the species level (Figure A3 and Figure A4), we still found that some ASVs showed high identity (98.6%–100.0%) to species commonly used as probiotics, namely, Bifidobacterium_1 (Bifidobacterium longum, Bifidobacterium adolescentis, and Bifidobacterium breve), Bifidobacterium_3 (Bifidobacterium animalis), Lactobacillus_1 (Lactobacillus casei), Lactobacillus_2 (Lactobacillus acidophilus), Lactobacillus_5 (Lactobacillus rhamnosus), Lactobaicllus_7 (Lactobacillus fermentum), Lactobaicllus_8 (Lactobacillus delbrueckii), and Lactobacillus_9 (Lactobacillus brevis). These ASVs also exhibited high relative abundance for Bifidobacterium and Lactobacillus.
3.2. Bifidobacterium and Lactobacillus are associated with the diversity of the gut microbiota
To explore the relationship between Bifidobacterium and Lactobacillus, we focused our analysis on the increase in these two genera when codetected. The relative abundance of Bifidobacterium was increased significantly when Lactobacillus was present (Figure 2a). At the same time, the relative abundance of Lactobacillus did not increase significantly when Bifidobacterium was present (Figure 2b). In addition, we found significantly increased levels of portions of Bifidobacterium and Lactobacillus ASVs when these genera were codetected (Figure A5). Considering the interinfluence between these two genera, we propose that these two genera also have a close connection with other dominant genera. We found that Bifidobacterium and Lactobacillus showed a positive correlation with Blautia, Faecalibacterium, Anaerostipes, Agathobacter, and Subdoligranulum, all of which are potential butyrate producers. Concomitantly, we also found a negative correlation of these two genera with some potential butyrate producers (Figure 2c) (Vital, Howe, & Tiedje, 2014). It can be argued that other factors exerting an effect on butyrate producers in the gut microbiota may exist.
Figure 2.
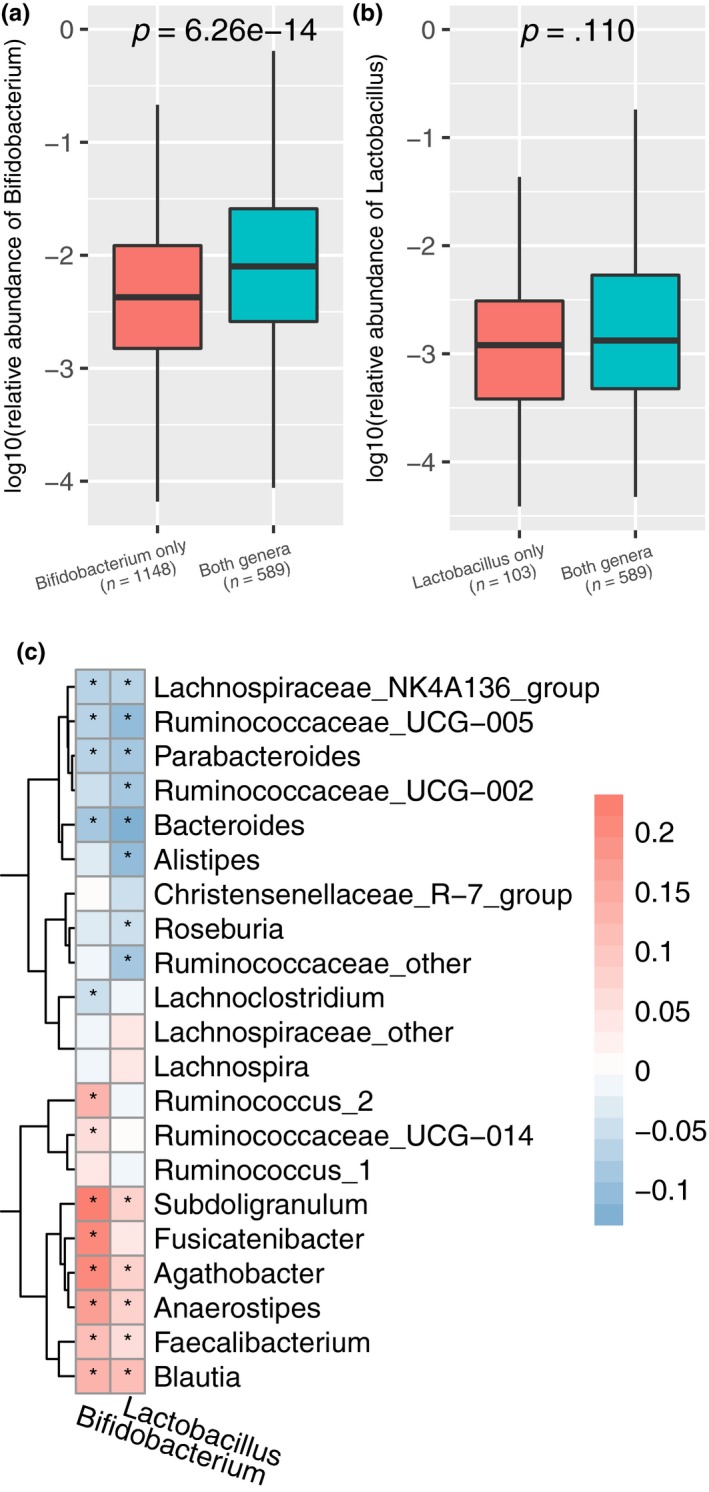
Cooccurrence of Bifidobacterium and Lactobacillus and correlation between these two genera and other dominant genera. (a) Relative abundance of Bifidobacterium in samples containing Bifidobacterium but not Lactobacillus or containing both genera. (b) Relative abundance of Lactobacillus in samples containing Lactobacillus but not Bifidobacterium or containing both genera. (c) Spearman's correlation between these two genera and other dominant genera. Red: positive correlation; blue: negative correlation; *, adjusted p < .05
Furthermore, we compared the alpha diversity of the gut microbiota in the AGP dataset, with alpha diversity increasing as the number of codetected Bifidobacterium and Lactobacillus increased (Figure 3a,b and Figure A6). In addition, samples containing Bifidobacterium and not Lactobacillus showed a higher Simpson index than did those containing only Lactobacillus. The association between the two genera and the diversity of the gut microbiota was obvious for the US samples, but that for the UK samples was weaker (Figure A7). We visualized beta diversity by PCoA according to Bray–Curtis dissimilarities (Figure 3c‐e). An additional PERMANOVA analysis based on categorical variables of their abundance showed that the presence of Bifidobacterium and Lactobacillus was a significant factor in the variation of the gut microbiota (p < .001). Approximately 1% of the variance in beta diversity was explained by the presence of the two genera (R 2 = .010, .010, and .013, respectively), which is competitive with many microbiome covariates (Falony et al., 2016).
Figure 3.
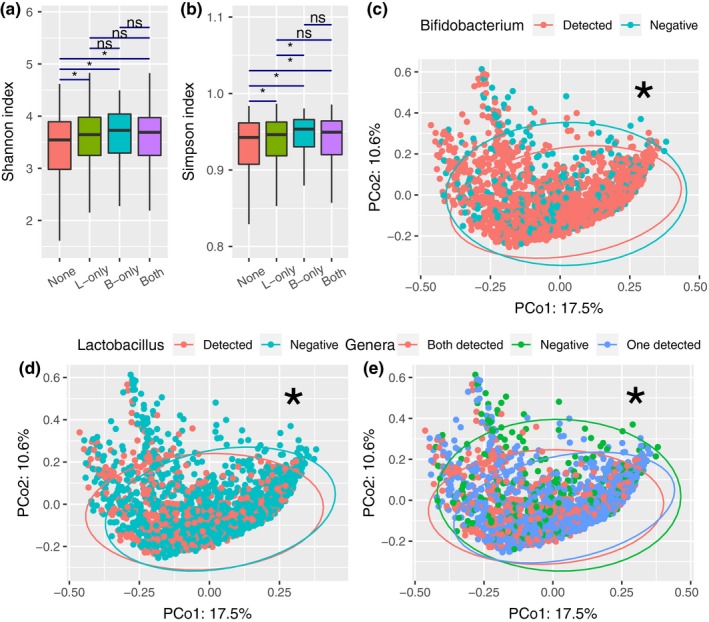
Alpha diversity and beta diversity of the 1,836 samples. Shannon index (a) and Simpson index (b) for the four groups. Statistical tests were performed using the Wilcoxon rank‐sum test. PCoA was based on Bray–Curtis dissimilarity considering the presence of Bifidobacterium (c), Lactobacillus (d), and the number of these two genera (e). *: p < .001 (PERMANOVA, permutation = 9,999)
3.3. Robustness of microbial networks related to Bifidobacterium and Lactobacillus
Analysis of the entire network constructed using the genus data from the AGP dataset showed that Bifidobacterium and Lactobacillus were not highly connected in the microbial network, suggesting that they were not keystone taxa for the cohort. However, notably, these two genera were connected to the largest cluster via Peptoclostridium and Collinsella; furthermore, Bifidobacterium and Lactobacillus were connected to each other (Figure A8). To further explore the effect of Bifidobacterium and Lactobacillus on the robustness of the microbial network, we performed three comparisons of the microbial community structure, considering the presence of these two genera (Figure 4). The degree statistics for the networks containing or not containing Bifidobacterium and Lactobacillus were not statistically significant (p = .238 and p = .814, respectively). However, the bacterial network of samples containing Bifidobacterium but not Lactobacillus showed higher statistics than did those only containing Lactobacillus (Figure 4c, p = 7.46 × 10⁻⁹). We then compared the resilience of the networks to degree disturbance using random node removal to simulate an “attack” on the networks (Mahana et al., 2016). With the absence of either Bifidobacterium or Lactobacillus, the natural connectivity of the microbial network decreased faster compared to the connectivity that when either of these genera were present (Figure 4d,e). In addition, the microbial network constructed for the samples containing Lactobacillus but not Bifidobacterium decreased faster compared with the connectivity when Bifidobacterium but not Lactobacillus was present (Figure 4f). Node removals ordered by the degree and betweenness of the natural connectivity suggested the same results (Figure A9). Taken together, these results indicate that the presence of Bifidobacterium and Lactobacillus, especially Bifidobacterium, was more important for maintaining the robustness of the bacterial network. To further test the importance of Bifidobacterium to the robustness of the gut microbiota, we compared the genus with other genera based on the number of connections shown in the cooccurrence network (Table A8 in Appendix 1). Among the top 5 highly interconnected genera, there are not enough samples to build a bacterial network for Bacteroides and Lachnospiraceae_Other (Figure A10a). The results showed that the ability of Bifidobacterium to sustain the gut microbiota robustness under attack was comparable to the most frequently connected genus examined (Figure A10b‐d).
Figure 4.
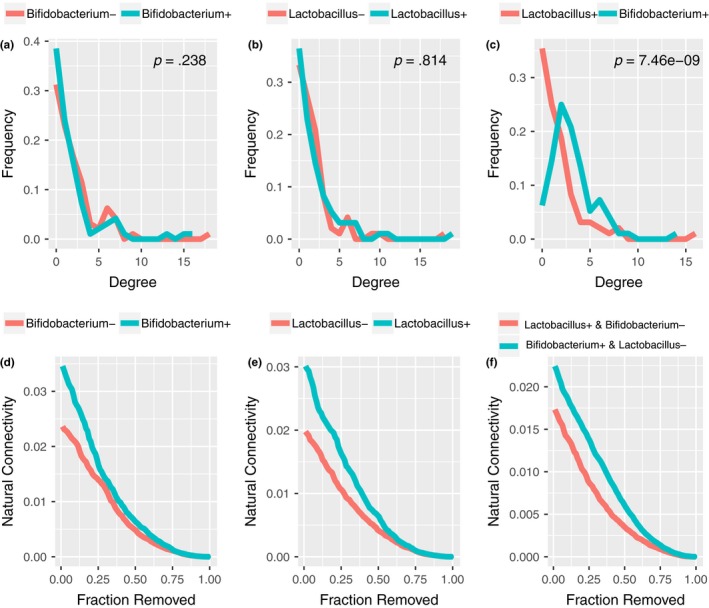
Microbial structure in relation to colonization. (a) Degree distribution of samples containing or not Bifidobacterium. (b) Degree distribution of samples containing or not Lactobacillus. (c) Degree distribution of samples containing Bifidobacterium but not Lactobacillus and samples containing Lactobacillus but not Bifidobacterium. (d) Natural connectivity is shown as a function of the size of the remaining network with the presence of Bifidobacterium. (e) Natural connectivity is shown as a function of the size of the remaining network with the presence of Lactobacillus. (f) Natural connectivity is shown as a function of the size of the remaining network of samples harboring Bifidobacterium present but no Lactobacillus and samples harboring Lactobacillus present but no Bifidobacterium. We performed node removals at random distribution of the natural connectivity
3.4. The effect of Bifidobacterium and Lactobacillus on the gut microbiota
We validated the influence of Bifidobacterium and Lactobacillus on the gut microbiota using genus data from the NBT dataset, which were annotated based on reference genomes with a similarity of >85% at the genus level (Li et al., 2014). Due to the sequencing depth, all 1,267 samples showed positive results for the two genera (Table A9 in Appendix 1). Therefore, we divided the samples into two groups, a higher group and a lower group, according to the median value of relative abundance. Spearman's correlation analysis showed a positive correlation between the relative abundance of the two genera (rho = .449, p < 2.2 × 10⁻¹⁶, Figure 5a). In addition, the samples with higher relative abundances of Bifidobacterium and Lactobacillus showed higher alpha diversities, similar to the result found on the AGP dataset (Figure 5b,c). There was also a significant association between beta diversity and a higher relative abundance of Bifidobacterium or Lactobacillus (Figure 5d,e and Figure A11). Natural connectivity decreased faster in the group with a lower relative abundance of Bifidobacterium or Lactobacillus than in the group with a higher relative abundance, though this was not as noticeable as seen in the results for the AGP dataset (Figure A12).
Figure 5.
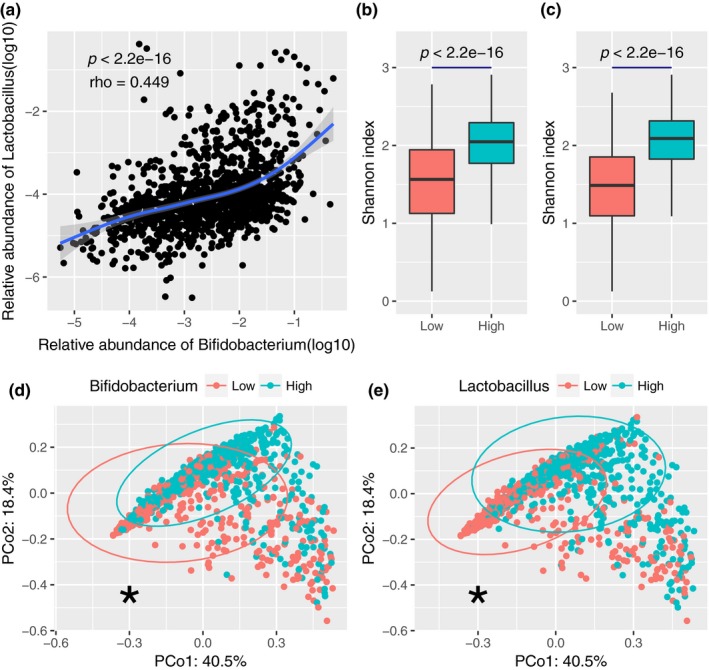
Validation of the results obtained with the AGP dataset using the NBT dataset. (a) Correlation between the relative abundances of Bifidobacterium and Lactobacillus. (b) Shannon index in the samples containing either only Bifidobacterium or both genera. (c) Relative abundance of Lactobacillus in the samples containing either only Lactobacillus or both genera. (d) PCoA based on Bray–Curtis dissimilarity considering the presence of Bifidobacterium. (e) PCoA based on Bray–Curtis dissimilarity considering the presence of Lactobacillus. *: p‐value < 0.001 (PERMANOVA)
3.5. The abundance of Bifidobacterium is associated with demographic features, lifestyle, and diseases
As shown above, Bifidobacterium displayed a closer connection with the diversity and robustness of the gut microbiota than Lactobacillus, and we then focused on exploring the impacting factors related to the abundance of Bifidobacterium. To better understand the association between Bifidobacterium and background information, we included 16 factors with sufficient records to identify potential associations with the abundance of Bifidobacterium using all samples from the AGP dataset. The fitted ZINB model was constructed based on all 16 variables in one model on which they determined significance. We found many factors to be significantly associated with the relative abundance of Bifidobacterium (Table A10 in Appendix 1). For example, the relative abundance of Bifidobacterium was associated with demographic features included in the present study, namely, age, sex, race, and geographical location (Figure 6a‐d). In terms of lifestyle, we found that whole‐grain consumption, milk, and cheese were associated with an increased abundance of Bifidobacterium, though a high frequency of vegetables and fruits consumption negatively affected the abundance of Bifidobacterium (Figure 6e‐h). Breasting feeding in infants showed a close connection with a higher abundance of Bifidobacterium, even though our cohort consisted of adults (Figure 6j). Notably, a high relative abundance of Bifidobacterium was associated with IBD and recent antibiotic exposure (Figure 6k,l). However, people with IBS, autoimmune disease, and food allergy had a lower relative abundance of Bifidobacterium than did unaffected individuals (Figure 6m,n,p). These results also showed that the relative abundance of Bifidobacterium was not associated with cardiovascular disease or C‐section (Figure 6i,o).
Figure 6.
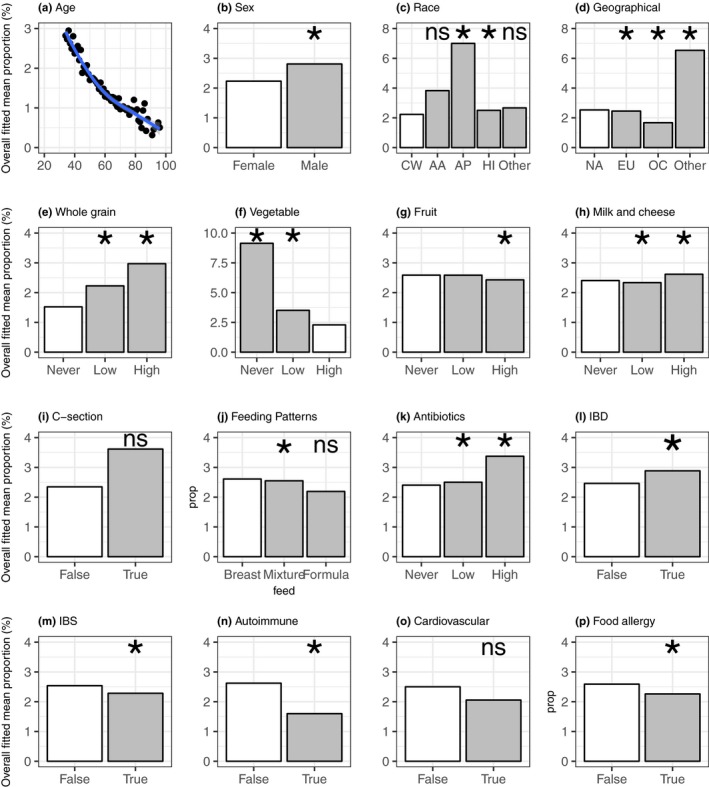
Predicted relationships between Bifidobacterium abundance and host features based on the ZINB model. The overall fitted mean proportions (%) of Bifidobacterium and age (a); sex (b); race (c); geographical location (d); whole‐grain consumption (e); vegetable consumption (f); fruit consumption (g); milk and cheese consumption (h); C‐section (i); fermented plant consumption (i); feeding patterns (j); antibiotic exposure (k); IBD (l); IBS (m); autoimmune disease (n); cardiovascular disease (o); and food allergy (p). White bar: reference; gray bar: comparisons; race (CW, Caucasian White; AA, African‐American; AP, Asian‐Pacific; and HI, Hispanic); geographical (NA, North America; EU, Europe; and OC, Oceania); *: significance in at least in one part of the ZINB model (p < .05); ns: not significant in two parts of the ZINB model (p > .05)
4. DISCUSSION
We found the following through analysis of the AGP dataset: (1) Bifidobacterium was a common genus, but Lactobacillus was not; (2) the abundances of Bifidobacterium and Lactobacillus were positively correlated, especially at the ASV level; (3) samples containing the two genera showed higher alpha diversity; (4) Bifidobacterium was more helpful than Lactobacillus in sustaining the robustness of the gut microbiota based on the inferred microbial network; (5) demographic features, lifestyle, and diseases were closely connected with the relative abundance of Bifidobacterium.
Dominant taxa with large biomasses or major energy transformations might influence a broad array of processes, such as denitrification or organic matter decomposition (Banerjee et al., 2018). Based on the results of our analysis, Bifidobacterium had a higher relative abundance and a wider prevalence than Lactobacillus, indicating a stronger influence on gut microbiota processes. The Bifidobacterium‐mediated effect is an important issue that needs to be addressed in relation to strain‐specific beneficial properties (Presti et al., 2015). Although we explored each ASV to improve classification accuracy, the lengths of the sequenced amplicons made it difficult to classify them at the species level. Furthermore, our results suggested that the most abundant ASV (Bifidobacterium_1) belonging to Bifidobacterium showed a higher identity to B. longum, B. adolescentis, and B. breve, which are frequently used probiotics, despite an inability to analyze the data at the species level.
Our results suggested that the relative abundance of Bifidobacterium increased when Lactobacillus was present. The cooccurrence network and the NBT dataset also showed a close correlation between these two genera. These observations suggest that cooperation may exist between these two genera. This relationship may explain why multistrain probiotics appear to show greater efficacy than single‐strain probiotics (Chapman, Gibson, & Rowland, 2011). In addition, many factors could lead to the same observation, such as taking probiotics and dairy products containing Bifidobacterium and Lactobacillus. Cross‐feeding interactions were studied between selected strains of Bifidobacterium/Lactobacillus and butyrate‐producing bacteria that consume lactate (Moens, Verce, & De Vuyst, 2017). Our results verified that the positive correlation between Bifidobacterium/Lactobacillus and butyrate‐producing bacteria may be one of the beneficial roles played by these two genera in the host.
The present study confirmed that the presence of these two genera is associated with higher alpha diversity. Interestingly, Bifidobacterium has a strong effect on the alpha diversity of the gut microbiota through mechanisms that may include starch‐degrading activity (Ryan, Fitzgerald, & van Sinderen, 2006). Moreover, our results suggested that Bifidobacterium and Lactobacillus are not only associated with alpha diversity but may also be related to the microbial structure. A previous study indicated that the fish gut microbiota was less affected by spatial differences resulting from environmental factors via increases in the abundance of a certain strain (Giatsis et al., 2016). This finding indicates that some types of bacteria may help sustain the robustness of the gut microbiota. Indeed, according to the results of our present study, Bifidobacterium helps sustain global network connectivity. Bifidobacterium helps in the resistance of the microbiota to the effects of other factors, such as a high‐fat diet and antibiotics (Kristensen et al., 2016). Moreover, comparison with another six genera proved the important role of Bifidobacterium in the gut microbiota. Microbial keystone taxa are highly connected taxa that, individually or together, exert considerable influence on microbiome structure and function (Banerjee et al., 2018). Nonetheless, Bifidobacterium did not exhibit high connectivity with other genera, indicating that they may not be keystone taxa. However, according to Angulo's study, manipulation of driver species, which are not always highly interconnected, may control the entire network (Angulo, Moog, & Liu, 2019). Therefore, Bifidobacterium and Lactobacillus might be potential drivers of the bacterial network. In addition, the role of Peptoclostridium and Collinsella in the gut microbiota still needs to be explored, as these genera were the only two found to be closely connected with Bifidobacterium and Lactobacillus.
Considering the increasing global incidence of many diseases, changes in lifestyle and diet have been proposed to contribute to disease emergence by altering gut microbial ecology (Blaser, 2006), and many strains of Bifidobacterium have been used to improve health. However, it is uncertain whether intake of Bifidobacterium strains can ameliorate the symptoms of conditions such as IBS (Cozmapetruţ et al., 2017), allergy (Mennini et al., 2017), and diarrhea (Laursen et al., 2017), even in clinical trials. These findings suggest that the association between disease and Bifidobacterium is questionable. In the present study, we found that the relative abundance of Bifidobacterium is under the influence of demographic features. Indeed, it has been reported that age, geography, and ethnic origins are factors that influence the abundance of Bifidobacterium (Deschasaux et al., 2018; Kato et al., 2017). In terms of lifestyle, we observed that higher consumption of whole grains and dairy products was associated with a higher abundance of Bifidobacterium in the gut microbiota (Martinez et al., 2013). However, C‐section did not appear to influence the abundance of Bifidobacterium in adults, even though it is associated with Bifidobacterium colonization in infants (Hesla et al., 2014). This finding suggests that the lifelong effect of C‐section on Bifidobacterium is unlikely. The decreased abundance of Bifidobacterium related to higher consumption of vegetables and fruits may be due to other factors not included in the present study, which is a limitation of the present study. A small sample number may be another factor leading to this unexpected result (Table A1 in Appendix 1). Surprisingly, exposure to antibiotics increased the relative abundance of Bifidobacterium, a finding that needs to be investigated further. One plausible explanation for this increase could be the use of probiotics considering Bifidobacterium_1 showed identity to the species commonly used as probiotics (Figure A3); however, this information was not included in the metadata. Increased relative abundance of Bifidobacterium in the gut microbiota may be helpful for controlling IBS (Han, Wang, Seo, & Kim, 2017), autoimmune disease (Uusitalo et al., 2016), and food allergy (Mennini et al., 2017), as the relative abundance of Bifidobacterium was lower in patients with these conditions than in unaffected individuals. However, all these results together with those we presented here are mostly correlation analyses; the relationship between Bifidobacterium and human diseases and if Bifidobacterium bacteria could be a treatment option still needs to be revealed.
We note the following limitations of the present study: This study was only performed on two datasets, not on diverse geographic origins; the contribution of Bifidobacterium to the diversity and robustness was only analyzed by comparison with Lactobacillus and not other genera; the background information was not sufficiently detailed to allow a solid conclusion to be drawn, with some ambiguous information; many factors influence the relative abundance of Bifidobacterium, which makes it difficult to interpret the results of the association between lifestyle and the relative abundance of Bifidobacterium; there may be more important bacteria other than Bifidobacterium and Lactobacillus, which was not evaluated in the present study.
5. CONCLUSIONS
In summary, our results showed a close connection between Bifidobacterium and Lactobacillus. The genus Bifidobacterium was important for the diversity and robustness of the gut microbiota. Increasing the intake of whole grains and dairy products may be a good way to increase the abundance of Bifidobacterium.
CONFLICT OF INTEREST
None declared.
AUTHOR CONTRIBUTIONS
Yuqing Feng contributed to conceptualization; Yuqing Feng, Na Lyu, Fei Liu, and Shihao Liang contributed to formal analysis; Baoli Zhu contributed to funding acquisition; Yuqing Feng, Yunfeng Duan contributed to writing‐original draft preperation; Zhenjiang Xu contributed to writing‐review and editing.
ETHICAL APPROVAL
None required.
ACKNOWLEDGMENTS
We thank Daniel McDonald, the American Gut Project manager, for his suggestions on the present study. We also thank Yongfei Hu from China Agricultural University for his helpful comments.
APPENDIX 1.
Figure A1.
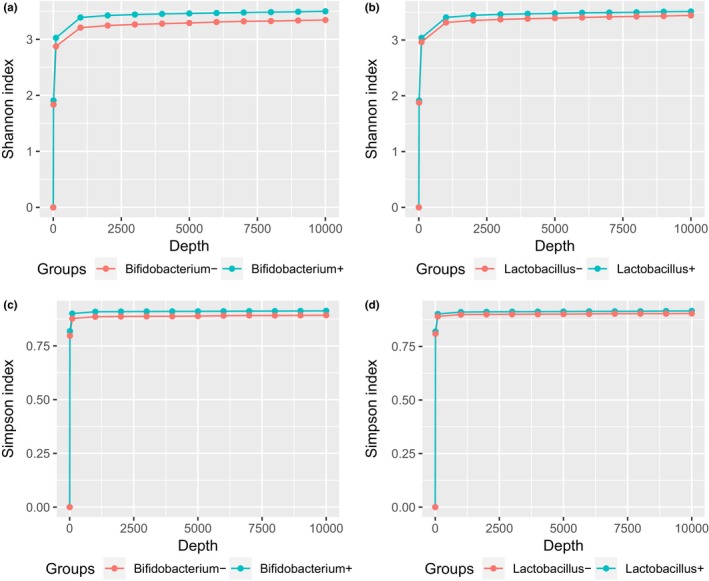
Rarefaction curves of alpha diversity. Rarefaction curves on Shannon index (a,b), and Simpson index (c,d)
Figure A2.
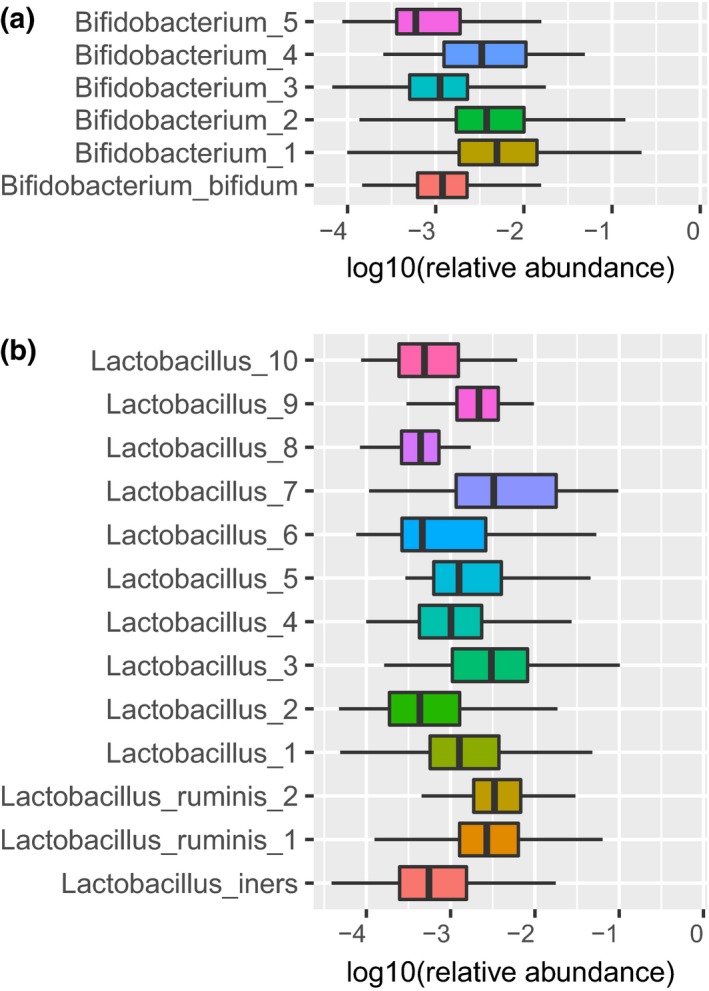
Relative abundance of ASVs annotated as (a) Bifidobacterium and (b) Lactobacillus
Figure A3.
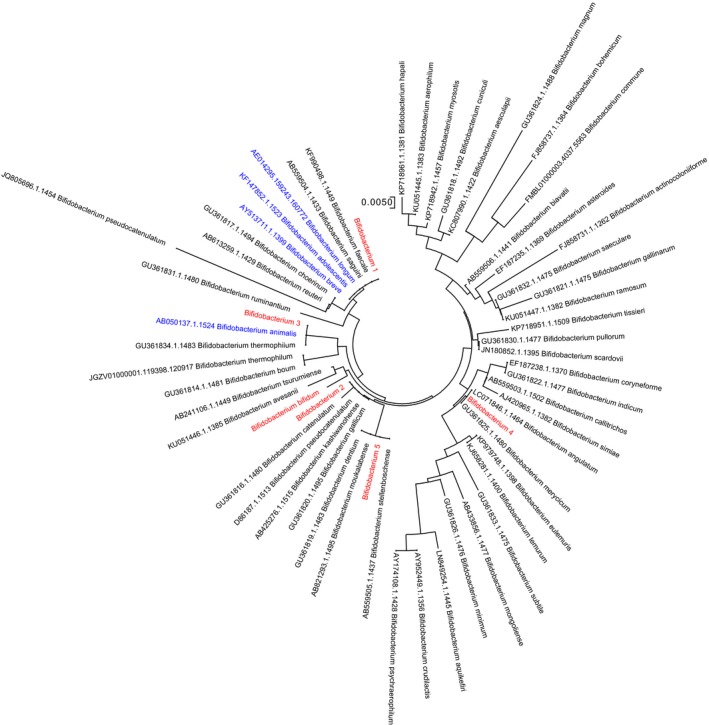
Distance tree of the genus Bifidobacterium. The red branches denote ASVs annotated as Bifidobacterium; the blue branches denote species commonly used as probiotics
Figure A4.
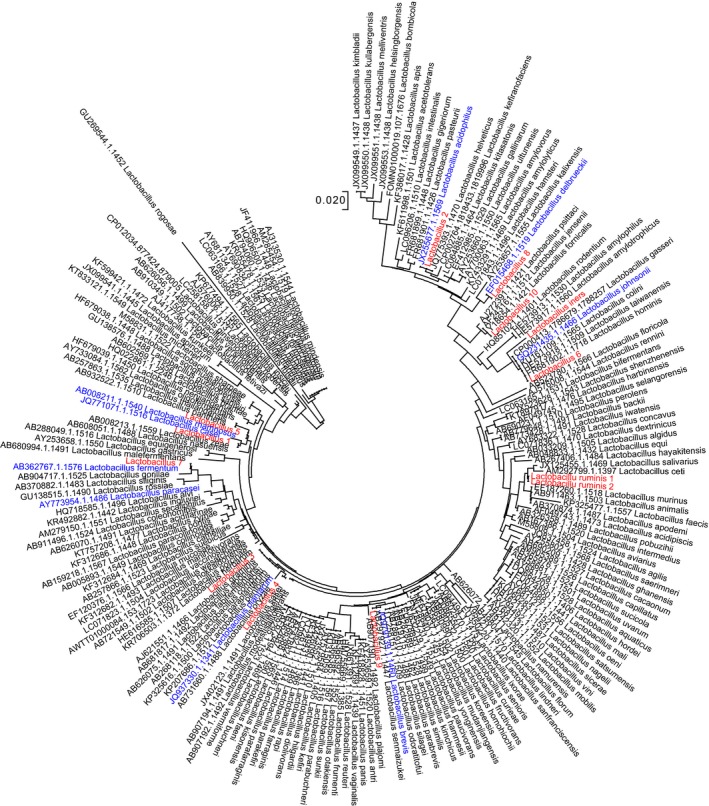
Distance tree of the genus Lactobacillus. The red branches denote ASVs annotated as Lactobacillus; the blue branches denote species commonly used as probiotics
Figure A5.
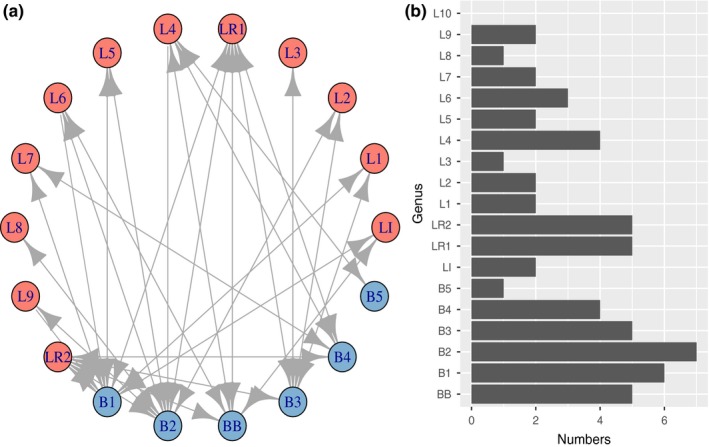
Cooccurrence of Bifidobacterium and Lactobacillus ASVs. (a) Network of cooccurrence of ASVs from different genera. The lines indicate a significantly increased relationship between one ASV belonging to Bifidobacterium and one ASV belonging to Lactobacillus (FDR < 0.1). L, Lactobacillus; B, Bifidobacterium; arrow: possible “promotion” between the two ASVs. (b) Number of promotions between one ASV belonging to one genus and another ASV belonging to the other genus
Figure A6.
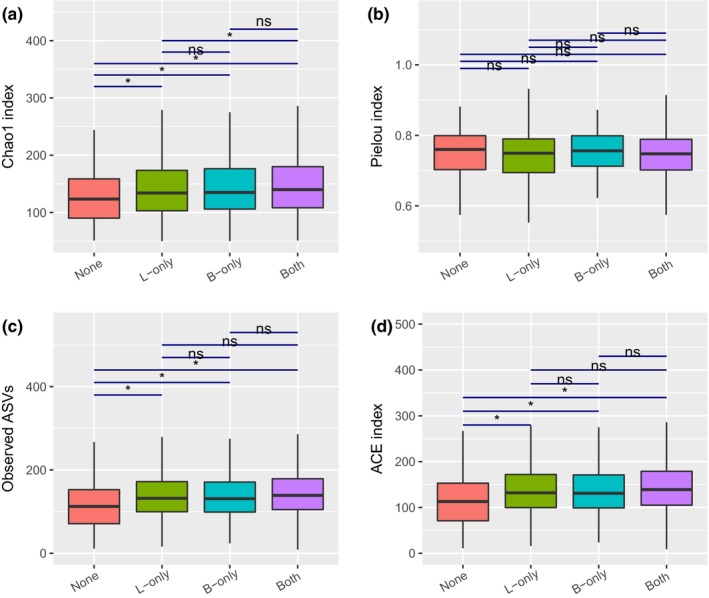
Different indexes of alpha diversity. (a) Chao1 index; (b) Pielou index; (c) Observed ASVs; and (d) ACE index
Figure A7.
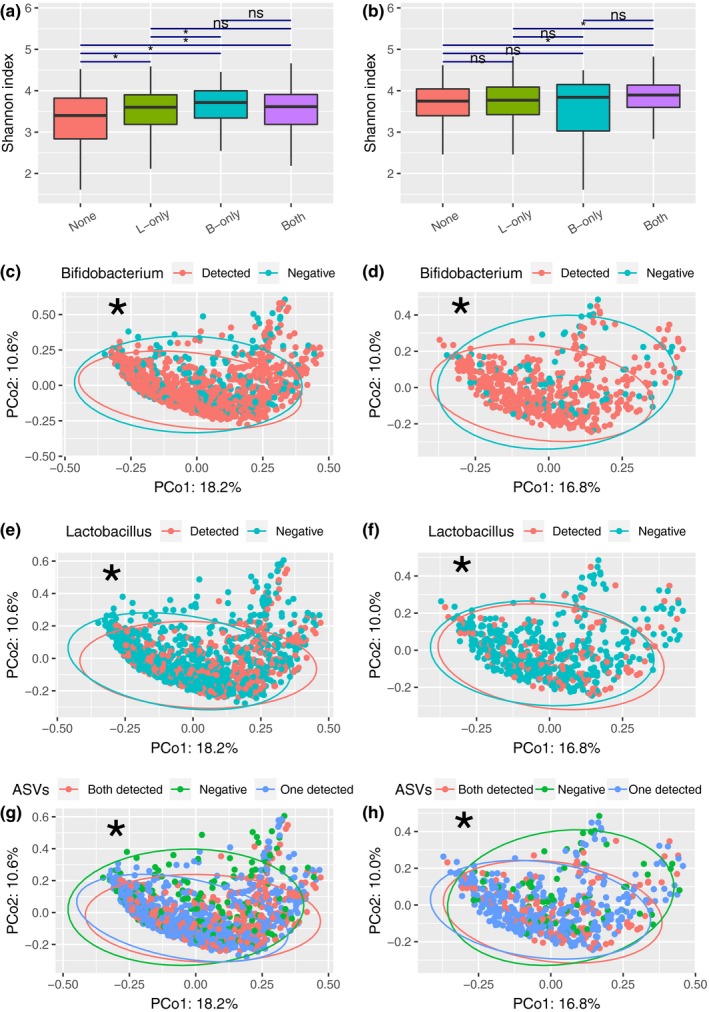
Alpha diversity and beta diversity of the sample from the USA and the UK. Shannon index for the USA (a) and the UK (b) among the four groups. Statistical tests were performed using the Wilcoxon rank‐sum test. PCoA was based on Bray–Curtis dissimilarity considering the presence of Bifidobacterium (c), Lactobacillus (e) for the USA sample. PCoA was based on Bray–Curtis dissimilarity considering the presence of Bifidobacterium (d) and Lactobacillus (f) for the UK sample. PCoA was based on Bray–Curtis dissimilarity considering the number of these two genera for the USA sample (g) and the UK sample (h). *: p < .001 (PERMANOVA, permutation = 9,999)
Figure A8.
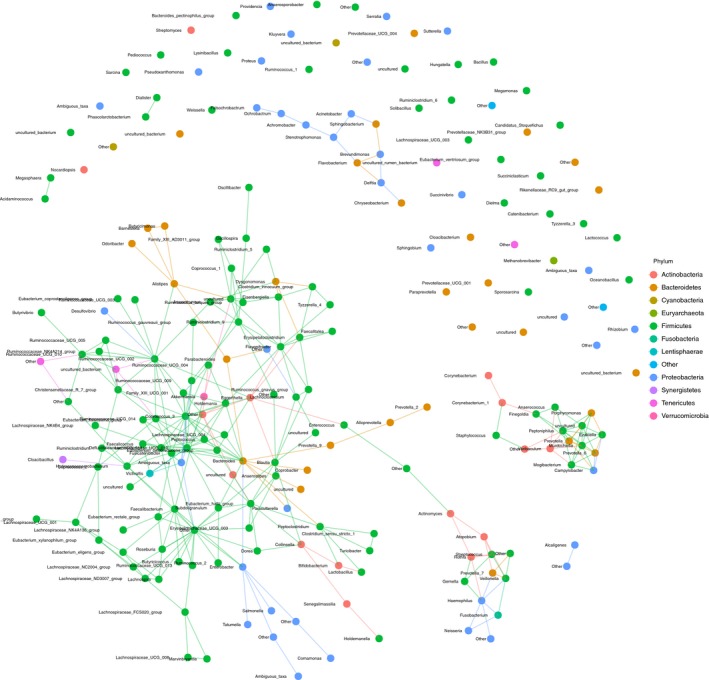
Cooccurrence network of microbial taxa detected in the AGP dataset. The different colors of the nodes represent different phyla
Figure A9.
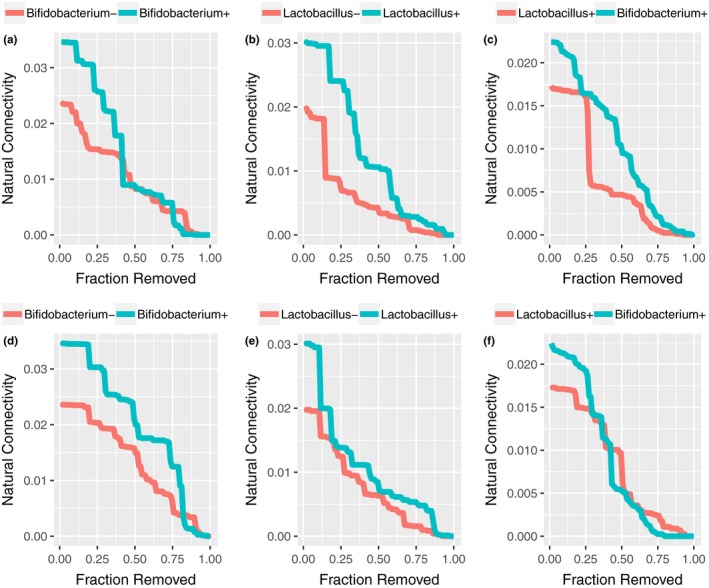
Microbial structure in relation to the presence of Bifidobacterium and Lactobacillus. Natural connectivity of the bacterial network with the presence of (a,d) Bifidobacterium, (b,e) Lactobacillus, and (c,f) only Bifidobacterium and only Lactobacillus. Node removals were ordered by the degree (a‐c) and betweenness (d‐f) of the natural connectivity
Figure A10.
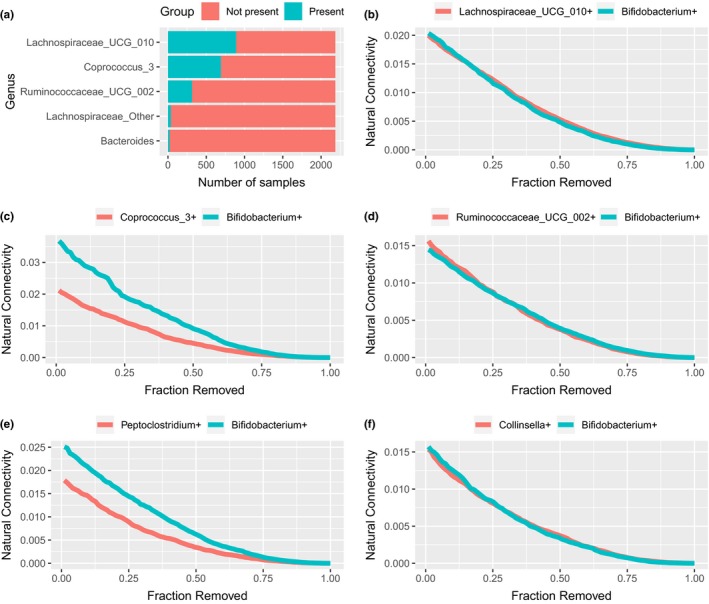
Microbial structure in relation to the colonization of Bifidobacterium and other genera. (a) Number of samples that have Top 5 highly interconnected genera. Natural connectivity of the network for comparisons between the presence of only Bifidobacterium and the presence of only Lachnospiraceae_UCG_010 (b), Coprococcus_3 (c), Ruminococcaceae_UCG_002 (d), Peptoclostridium (e), and Collinsella (f)
Figure A11.
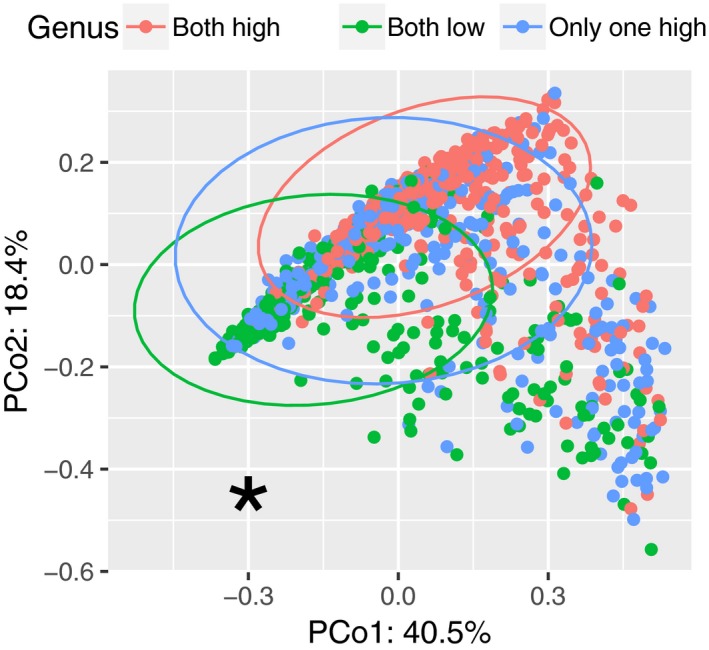
PCoA based on the Bray–Curtis dissimilarity distance considering the abundance of Bifidobacterium and Lactobacillus. *: p‐value < 0.001 (PERMANOVA)
Figure A12.
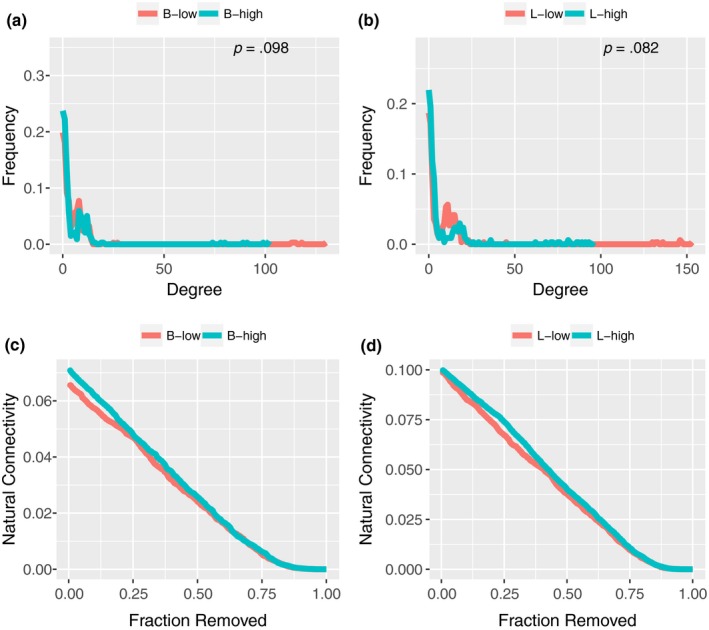
Degree distribution and natural connectivity. (a) Degree distribution of samples with a higher abundance of Bifidobacterium and samples with a lower abundance of Bifidobacterium. (b) Degree distribution of samples with a higher abundance of Lactobacillus and samples with a lower abundance of Lactobacillus. (c) Node removals were ordered at a random distribution of the natural connectivity for the presence or absence of Bifidobacterium. (d) Node removals were ordered at a random distribution of the natural connectivity for the presence or absence of Lactobacillus. B‐low, lower relative abundance of Bifidobacterium; B‐high, higher relative abundance of Bifidobacterium; L‐Low, lower relative abundance of Lactobacillus; L‐high, higher relative abundance of Lactobacillus
Table A1.
Descriptive statistics for candidate for 11,744 fecal samples
| Covariates | All samples | |
|---|---|---|
| Continuous variable | Mean ± SD | No. of missing |
| Age | 45.18 ± 17.66 | 483 |
| Categorical covariate | No. of records | No. of missing |
| Sex | ||
| Female | 5,947 | 557 |
| Male | 5,240 | |
| Race | ||
| Caucasian | 10,201 | 321 |
| African American | 86 | |
| Asian/Pacific Islander | 565 | |
| Hispanic | 239 | |
| Others | 332 | |
| Geographic location | ||
| North America | 8,542 | 28 |
| Europe | 2,824 | |
| Oceania | 302 | |
| Others | 48 | |
| Alcohol consumption | ||
| False | 1,954 | 3,402 |
| True | 6,388 | |
| Fermented plant frequency | ||
| Never | 2,710 | 3,915 |
| Low frequency | 3,685 | |
| High frequency | 1,434 | |
| Milk and cheese frequency | ||
| Never | 1,206 | 3,763 |
| Low frequency | 2,826 | |
| High frequency | 3,949 | |
| Whole grain frequency | ||
| Never | 1,020 | 3,841 |
| Low frequency | 3,249 | |
| High frequency | 3,634 | |
| Fruit frequency | ||
| Never | 438 | 3,783 |
| Low frequency | 2,634 | |
| High frequency | 4,889 | |
| Feeding patterns | ||
| Primarily breast milk | 3,744 | 4,826 |
| Primarily infant formula | 1,881 | |
| A mixture of breast milk and formula | 1,293 | |
| Born by C‐section | ||
| FALSE | 9,759 | 819 |
| TRUE | 1,166 | |
| Vegetable consumption frequency | ||
| Never | 65 | 3,771 |
| Low frequency | 964 | |
| High frequency | 6,944 | |
| Last exposure to antibiotics | ||
| Over 1 year | 7,672 | 409 |
| Low frequency | 3,023 | |
| High frequency | 640 | |
| Food allergy | ||
| False | 5,493 | 1 |
| True | 6,250 | |
| IBD | ||
| False | 10,408 | 857 |
| True | 479 | |
| SIBO | ||
| False | 7,203 | 3,996 |
| True | 545 | |
| IBS | ||
| False | 6,256 | 3,879 |
| True | 1,609 | |
| Autoimmune disease | ||
| False | 6,864 | 3,849 |
| True | 1,031 | |
| Cardiovascular disease | ||
| False | 7,668 | 3,795 |
| True | 281 | |
| Mental illness | ||
| False | 3,681 | 7,477 |
| True | 586 | |
Table A2.
Inclusion criteria for individuals whose samples were used in the analyses
| Category | Criteria |
|---|---|
| Age (year) | Exclude infants (0 ≤ age ≤ 1) |
| BMI | 18.5–30.0 |
| Last exposure to antibiotics | Over 1 month |
| Acid reflux | No |
| Appendix removed | No |
| Autoimmune disease | No |
| Cancer | No |
| Cardiovascular disease | No |
| Clinical condition | No |
| IBD | No |
| IBS | No |
| Liver disease | No |
| Lung disease | No |
| Mental Illness | No |
| PKU | No |
| Pregnant | No |
| SIBO | No |
Table A3.
Workflow of American Gut Project data processing
| Steps | Contents |
|---|---|
| Step 1 | Downloaded 19,327 samples (25 Jan. 2018) |
| Step 2 | Excluded non‐fecal samples: 15,259 fecal samples left |
| Step 3 | 12,127 fecal samples with over 10,000 reads |
| Step 4 | 11,744 samples passed the quality control of DADA2 |
| Step 5 | Delete the ASV with a distribution of less 1% and not belong to bacteria |
| Step 6 | Delete blooming bacteria |
| Step 7 | Excluded samples with diseases |
Table A4.
Relative abundance of dominant genera in 2,186 samples
| Genus | Relative abundance of dominant genera |
|---|---|
| Bacteria|Bacteroidetes|Bacteroidia|Bacteroidales|Bacteroidaceae|Bacteroides | 22.7% |
| Bacteria|Firmicutes|Clostridia|Clostridiales|Ruminococcaceae|Faecalibacterium | 7.9% |
| Bacteria|Firmicutes|Clostridia|Clostridiales|Lachnospiraceae|Other | 3.7% |
| Bacteria|Firmicutes|Clostridia|Clostridiales|Lachnospiraceae|Agathobacter | 3.3% |
| Bacteria|Firmicutes|Clostridia|Clostridiales|Lachnospiraceae|Blautia | 2.9% |
| Bacteria|Bacteroidetes|Bacteroidia|Bacteroidales|Rikenellaceae|Alistipes | 2.8% |
| Bacteria|Firmicutes|Clostridia|Clostridiales|Ruminococcaceae|Subdoligranulum | 2.3% |
| Bacteria|Bacteroidetes|Bacteroidia|Bacteroidales|Tannerellaceae|Parabacteroides | 2.2% |
| Bacteria|Firmicutes|Clostridia|Clostridiales|Ruminococcaceae|Ruminococcaceae_UCG‐014 | 2.1% |
| Bacteria|Firmicutes|Clostridia|Clostridiales|Ruminococcaceae|Ruminococcaceae_UCG‐002 | 2.1% |
| Bacteria|Firmicutes|Clostridia|Clostridiales|Christensenellaceae|Christensenellaceae_R‐7_group | 1.6% |
| Bacteria|Actinobacteria|Actinobacteria|Bifidobacteriales|Bifidobacteriaceae|Bifidobacterium | 1.4% |
| Bacteria|Firmicutes|Clostridia|Clostridiales|Lachnospiraceae|Roseburia | 1.3% |
| Bacteria|Firmicutes|Clostridia|Clostridiales|Ruminococcaceae|Other | 1.2% |
| Bacteria|Firmicutes|Clostridia|Clostridiales|Ruminococcaceae|Ruminococcus_2 | 1.2% |
| Bacteria|Firmicutes|Clostridia|Clostridiales|Lachnospiraceae|Lachnospiraceae_NK4A136_group | 1.1% |
| Bacteria|Firmicutes|Clostridia|Clostridiales|Ruminococcaceae|Ruminococcus_1 | 0.9% |
| Bacteria|Firmicutes|Clostridia|Clostridiales|Lachnospiraceae|Anaerostipes | 0.8% |
| Bacteria|Firmicutes|Clostridia|Clostridiales|Ruminococcaceae|Ruminococcaceae_UCG‐005 | 0.8% |
| Bacteria|Firmicutes|Clostridia|Clostridiales|Lachnospiraceae|Lachnospira | 0.8% |
| Bacteria|Firmicutes|Clostridia|Clostridiales|Lachnospiraceae|Fusicatenibacter | 0.7% |
| Bacteria|Firmicutes|Clostridia|Clostridiales|Lachnospiraceae|Lachnoclostridium | 0.6% |
Table A5.
Relative abundance of dominant genera in samples from USA
| Genus | Relative abundance of dominant genera |
|---|---|
| Bacteria|Bacteroidetes|Bacteroidia|Bacteroidales|Bacteroidaceae|Bacteroides | 24.0% |
| Bacteria|Firmicutes|Clostridia|Clostridiales|Ruminococcaceae|Faecalibacterium | 7.7% |
| Bacteria|Firmicutes|Clostridia|Clostridiales|Lachnospiraceae|Other | 3.9% |
| Bacteria|Firmicutes|Clostridia|Clostridiales|Lachnospiraceae|Agathobacter | 3.4% |
| Bacteria|Firmicutes|Clostridia|Clostridiales|Lachnospiraceae|Blautia | 3.1% |
| Bacteria|Bacteroidetes|Bacteroidia|Bacteroidales|Rikenellaceae|Alistipes | 2.7% |
| Bacteria|Bacteroidetes|Bacteroidia|Bacteroidales|Tannerellaceae|Parabacteroides | 2.3% |
| Bacteria|Firmicutes|Clostridia|Clostridiales|Ruminococcaceae|Subdoligranulum | 2.2% |
| Bacteria|Firmicutes|Clostridia|Clostridiales|Ruminococcaceae|Ruminococcaceae_UCG‐002 | 1.8% |
| Bacteria|Firmicutes|Clostridia|Clostridiales|Lachnospiraceae|Roseburia | 1.4% |
| Bacteria|Actinobacteria|Actinobacteria|Bifidobacteriales|Bifidobacteriaceae|Bifidobacterium | 1.3% |
| Bacteria|Firmicutes|Clostridia|Clostridiales|Christensenellaceae|Christensenellaceae_R‐7_group | 1.3% |
| Bacteria|Firmicutes|Clostridia|Clostridiales|Ruminococcaceae|Other | 1.1% |
| Bacteria|Firmicutes|Clostridia|Clostridiales|Lachnospiraceae|Lachnospiraceae_NK4A136_group | 1.1% |
| Bacteria|Firmicutes|Clostridia|Clostridiales|Lachnospiraceae|Anaerostipes | 0.9% |
| Bacteria|Firmicutes|Clostridia|Clostridiales|Lachnospiraceae|Lachnospira | 0.9% |
| Bacteria|Firmicutes|Clostridia|Clostridiales|Ruminococcaceae|Ruminococcus_1 | 0.8% |
| Bacteria|Firmicutes|Clostridia|Clostridiales|Lachnospiraceae|Fusicatenibacter | 0.8% |
| Bacteria|Firmicutes|Clostridia|Clostridiales|Lachnospiraceae|Lachnoclostridium | 0.7% |
| Bacteria|Firmicutes|Clostridia|Clostridiales|Ruminococcaceae|Ruminococcaceae_UCG‐005 | 0.7% |
| Bacteria|Firmicutes|Erysipelotrichia|Erysipelotrichales|Erysipelotrichaceae|Erysipelotrichaceae_UCG‐003 | 0.6% |
Table A6.
Relative abundance of dominant genera in samples from UK
| Genus | Relative abundance of dominant genera |
|---|---|
| Bacteria|Bacteroidetes|Bacteroidia|Bacteroidales|Bacteroidaceae|Bacteroides | 20.0% |
| Bacteria|Firmicutes|Clostridia|Clostridiales|Ruminococcaceae|Faecalibacterium | 8.4% |
| Bacteria|Firmicutes|Clostridia|Clostridiales|Lachnospiraceae|Other | 3.3% |
| Bacteria|Bacteroidetes|Bacteroidia|Bacteroidales|Rikenellaceae|Alistipes | 3.1% |
| Bacteria|Firmicutes|Clostridia|Clostridiales|Lachnospiraceae|Agathobacter | 3.1% |
| Bacteria|Firmicutes|Clostridia|Clostridiales|Ruminococcaceae|Ruminococcaceae_UCG‐014 | 3.1% |
| Bacteria|Firmicutes|Clostridia|Clostridiales|Ruminococcaceae|Ruminococcaceae_UCG‐002 | 2.9% |
| Bacteria|Firmicutes|Clostridia|Clostridiales|Lachnospiraceae|Blautia | 2.4% |
| Bacteria|Firmicutes|Clostridia|Clostridiales|Ruminococcaceae|Subdoligranulum | 2.2% |
| Bacteria|Firmicutes|Clostridia|Clostridiales|Christensenellaceae|Christensenellaceae_R‐7_group | 2.1% |
| Bacteria|Verrucomicrobia|Verrucomicrobiae|Verrucomicrobiales|Akkermansiaceae|Akkermansia | 2.1% |
| Bacteria|Bacteroidetes|Bacteroidia|Bacteroidales|Tannerellaceae|Parabacteroides | 2.0% |
| Bacteria|Firmicutes|Clostridia|Clostridiales|Ruminococcaceae|Other | 1.6% |
| Bacteria|Tenericutes|Mollicutes|Mollicutes_RF39|Other|Other | 1.4% |
| Bacteria|Firmicutes|Clostridia|Clostridiales|Ruminococcaceae|Ruminococcus_2 | 1.4% |
| Bacteria|Actinobacteria|Actinobacteria|Bifidobacteriales|Bifidobacteriaceae|Bifidobacterium | 1.3% |
| Bacteria|Firmicutes|Clostridia|Clostridiales|Ruminococcaceae|Ruminococcaceae_UCG‐005 | 1.2% |
| Bacteria|Firmicutes|Clostridia|Clostridiales|Lachnospiraceae|Lachnospiraceae_NK4A136_group | 1.1% |
| Bacteria|Firmicutes|Clostridia|Clostridiales|Lachnospiraceae|Roseburia | 1.1% |
| Bacteria|Firmicutes|Clostridia|Clostridiales|Ruminococcaceae|Ruminococcus_1 | 1.0% |
| Bacteria|Firmicutes|Clostridia|Clostridiales|Lachnospiraceae|Coprococcus_2 | 0.9% |
| Bacteria|Firmicutes|Clostridia|Clostridiales|Ruminococcaceae|Ruminococcaceae_NK4A214_group | 0.7% |
Table A7.
Distribution of Bifidobacterium and Lactobacillus
| ASV_ID | No. of the ASV present | Ratio of the ASV present |
|---|---|---|
| Bifidobacterium bifidum | 198 | 9.1% |
| Bifidobacterium_1 | 1,525 | 69.8% |
| Bifidobacterium_2 | 445 | 20.4% |
| Bifidobacterium_3 | 190 | 8.7% |
| Bifidobacterium_4 | 42 | 1.9% |
| Bifidobacterium_5 | 30 | 1.4% |
| Lactobacillus iners | 71 | 3.2% |
| Lactobacillus ruminis_1 | 102 | 4.7% |
| Lactobacillus ruminis_2 | 40 | 1.8% |
| Lactobacillus_1 | 206 | 9.4% |
| Lactobacillus_2 | 140 | 6.4% |
| Lactobacillus_3 | 99 | 4.5% |
| Lactobacillus_4 | 55 | 2.5% |
| Lactobacillus_5 | 75 | 3.4% |
| Lactobacillus_6 | 33 | 1.5% |
| Lactobacillus_7 | 26 | 1.2% |
| Lactobacillus_8 | 38 | 1.7% |
| Lactobacillus_9 | 38 | 1.7% |
| Lactobacillus_10 | 21 | 1.0% |
| Bifidobacterium | 1,737 | 79.5% |
| Lactobacillus | 692 | 31.7% |
Table A8.
Frequency of the genera connected analyzed by the bacterial network
| No of the node connected | Phylum | Class | Order | Family | Genus |
|---|---|---|---|---|---|
| 20 | Firmicutes | Clostridia | Clostridiales | Lachnospiraceae | Lachnospiraceae_UCG_010 |
| 19 | Firmicutes | Clostridia | Clostridiales | Lachnospiraceae | Other |
| 19 | Firmicutes | Clostridia | Clostridiales | Lachnospiraceae | Coprococcus_3 |
| 15 | Firmicutes | Clostridia | Clostridiales | Ruminococcaceae | Ruminococcaceae_UCG_002 |
| 15 | Bacteroidetes | Bacteroidia | Bacteroidales | Bacteroidaceae | Bacteroides |
| 12 | Firmicutes | Clostridia | Clostridiales | Defluviitaleaceae | Defluviitaleaceae_UCG_011 |
| 11 | Firmicutes | Clostridia | Clostridiales | Lachnospiraceae | Eubacterium_hallii_group |
| 11 | Firmicutes | Clostridia | Clostridiales | Family_XI | Peptoniphilus |
| 10 | Firmicutes | Clostridia | Clostridiales | Ruminococcaceae | Faecalibacterium |
| 10 | Firmicutes | Clostridia | Clostridiales | Ruminococcaceae | Flavonifractor |
| 10 | Firmicutes | Clostridia | Clostridiales | Ruminococcaceae | uncultured |
| 9 | Firmicutes | Clostridia | Clostridiales | Ruminococcaceae | Ruminiclostridium_9 |
| 9 | Actinobacteria | Coriobacteriia | Coriobacteriales | Coriobacteriaceae | Other |
| 8 | Firmicutes | Clostridia | Clostridiales | Ruminococcaceae | Hydrogenoanaerobacterium |
| 8 | Actinobacteria | Coriobacteriia | Coriobacteriales | Coriobacteriaceae | Eggerthella |
| 8 | Firmicutes | Clostridia | Clostridiales | Ruminococcaceae | Ruminococcaceae_UCG_010 |
| 8 | Firmicutes | Clostridia | Clostridiales | Ruminococcaceae | Ruminococcaceae_UCG_014 |
| 8 | Firmicutes | Erysipelotrichia | Erysipelotrichales | Erysipelotrichaceae | Holdemania |
| 8 | Bacteroidetes | Bacteroidia | Bacteroidales | Prevotellaceae | Prevotella |
| 8 | Firmicutes | Clostridia | Clostridiales | Christensenellaceae | Christensenellaceae_R7_group |
| 8 | Firmicutes | Clostridia | Clostridiales | Family_XI | Murdochiella |
| 8 | Firmicutes | Clostridia | Clostridiales | Family_XIII | uncultured |
| 8 | Firmicutes | Clostridia | Clostridiales | Lachnospiraceae | Blautia |
| 7 | Proteobacteria | Gammaproteobacteria | Enterobacteriales | Enterobacteriaceae | Enterobacter |
| 7 | Proteobacteria | Gammaproteobacteria | Pasteurellales | Pasteurellaceae | Haemophilus |
| 7 | Firmicutes | Clostridia | Clostridiales | Lachnospiraceae | Fusicatenibacter |
| 6 | Firmicutes | Clostridia | Clostridiales | Lachnospiraceae | Eubacterium_oxidoreducens_group |
| 6 | Firmicutes | Clostridia | Clostridiales | Peptostreptococcaceae | Peptoclostridium |
| 6 | Firmicutes | Erysipelotrichia | Erysipelotrichales | Erysipelotrichaceae | Erysipelatoclostridium |
| 6 | Firmicutes | Negativicutes | Selenomonadales | Veillonellaceae | Veillonella |
| 6 | Proteobacteria | Betaproteobacteria | Burkholderiales | Oxalobacteraceae | Ambiguous_taxa |
| 6 | Actinobacteria | Actinobacteria | Actinomycetales | Actinomycetaceae | Varibaculum |
| 6 | Bacteroidetes | Bacteroidia | Bacteroidales | Prevotellaceae | Prevotella_6 |
| 6 | Bacteroidetes | Bacteroidia | Bacteroidales | Rikenellaceae | Alistipes |
| 6 | Firmicutes | Clostridia | Clostridiales | Family_XI | Ezakiella |
| 6 | Firmicutes | Clostridia | Clostridiales | Family_XIII | Mogibacterium |
| 5 | Actinobacteria | Coriobacteriia | Coriobacteriales | Coriobacteriaceae | Collinsella |
| 5 | Firmicutes | Clostridia | Clostridiales | Peptococcaceae | Peptococcus |
| 5 | Firmicutes | Clostridia | Clostridiales | Ruminococcaceae | Ruminococcaceae_UCG_004 |
| 5 | Firmicutes | Clostridia | Clostridiales | Ruminococcaceae | Ruminococcaceae_UCG_009 |
| 5 | Firmicutes | Clostridia | Clostridiales | Ruminococcaceae | Subdoligranulum |
| 5 | Firmicutes | Erysipelotrichia | Erysipelotrichales | Erysipelotrichaceae | Faecalicoccus |
| 5 | Proteobacteria | Epsilonproteobacteria | Campylobacterales | Campylobacteraceae | Campylobacter |
| 5 | Bacteroidetes | Bacteroidia | Bacteroidales | Porphyromonadaceae | Dysgonomonas |
| 5 | Bacteroidetes | Bacteroidia | Bacteroidales | Porphyromonadaceae | Porphyromonas |
| 5 | Firmicutes | Bacilli | Lactobacillales | Streptococcaceae | Streptococcus |
| 5 | Actinobacteria | Actinobacteria | Micrococcales | Micrococcaceae | Rothia |
| 5 | Firmicutes | Clostridia | Clostridiales | Lachnospiraceae | Eisenbergiella |
| 5 | Firmicutes | Clostridia | Clostridiales | Lachnospiraceae | Lachnoclostridium |
| 5 | Firmicutes | Clostridia | Clostridiales | Lachnospiraceae | Lachnospiraceae_ND3007_group |
| 4 | Firmicutes | Clostridia | Clostridiales | Lachnospiraceae | Roseburia |
| 4 | Firmicutes | Clostridia | Clostridiales | Lachnospiraceae | Eubacterium_eligens_group |
| 4 | Actinobacteria | Coriobacteriia | Coriobacteriales | Coriobacteriaceae | Atopobium |
| 4 | Firmicutes | Clostridia | Clostridiales | Lachnospiraceae | Eubacterium_xylanophilum_group |
| 4 | Firmicutes | Clostridia | Clostridiales | Lachnospiraceae | Ruminococcus_gnavus_group |
| 4 | Firmicutes | Clostridia | Clostridiales | Lachnospiraceae | Ruminococcus_torques_group |
| 4 | Firmicutes | Clostridia | Clostridiales | Ruminococcaceae | Anaerotruncus |
| 4 | Firmicutes | Clostridia | Clostridiales | Ruminococcaceae | Ruminococcaceae_NK4A214_group |
| 4 | Firmicutes | Clostridia | Clostridiales | Ruminococcaceae | Ruminococcaceae_UCG_005 |
| 4 | Firmicutes | Erysipelotrichia | Erysipelotrichales | Erysipelotrichaceae | Clostridium_innocuum_group |
| 4 | Tenericutes | Mollicutes | Mollicutes_RF9 | uncultured_bacterium | uncultured_bacterium |
| 4 | Bacteroidetes | Bacteroidia | Bacteroidales | Prevotellaceae | Prevotella_7 |
| 4 | Firmicutes | Bacilli | Lactobacillales | Carnobacteriaceae | Other |
| 4 | Firmicutes | Clostridia | Clostridiales | Family_XI | Anaerococcus |
| 4 | Firmicutes | Clostridia | Clostridiales | Family_XI | Finegoldia |
| 4 | Firmicutes | Clostridia | Clostridiales | Family_XIII | Family_XIII_UCG_001 |
| 4 | Firmicutes | Clostridia | Clostridiales | Lachnospiraceae | Anaerostipes |
| 4 | Firmicutes | Clostridia | Clostridiales | Lachnospiraceae | Coprococcus_1 |
| 4 | Firmicutes | Clostridia | Clostridiales | Lachnospiraceae | Coprococcus_2 |
| 4 | Firmicutes | Clostridia | Clostridiales | Lachnospiraceae | Lachnospira |
| 4 | Firmicutes | Clostridia | Clostridiales | Lachnospiraceae | Lachnospiraceae_FCS020_group |
| 4 | Firmicutes | Clostridia | Clostridiales | Lachnospiraceae | Lachnospiraceae_UCG_001 |
| 3 | Firmicutes | Clostridia | Clostridiales | Lachnospiraceae | Lachnospiraceae_UCG_004 |
| 3 | Firmicutes | Clostridia | Clostridiales | Lachnospiraceae | Eubacterium_fissicatena_group |
| 3 | Firmicutes | Clostridia | Clostridiales | Lachnospiraceae | Eubacterium_rectale_group |
| 3 | Firmicutes | Clostridia | Clostridiales | Ruminococcaceae | Butyricicoccus |
| 3 | Firmicutes | Clostridia | Clostridiales | Ruminococcaceae | Ruminococcaceae_UCG_013 |
| 3 | Firmicutes | Erysipelotrichia | Erysipelotrichales | Erysipelotrichaceae | Erysipelotrichaceae_UCG_003 |
| 3 | Fusobacteria | Fusobacteriia | Fusobacteriales | Fusobacteriaceae | Fusobacterium |
| 3 | Lentisphaerae | Lentisphaeria | Victivallales | Victivallaceae | Victivallis |
| 3 | Proteobacteria | Alphaproteobacteria | Caulobacterales | Caulobacteraceae | Brevundimonas |
| 3 | Proteobacteria | Betaproteobacteria | Burkholderiales | Comamonadaceae | Delftia |
| 3 | Proteobacteria | Deltaproteobacteria | Desulfovibrionales | Desulfovibrionaceae | Other |
| 3 | Actinobacteria | Actinobacteria | Actinomycetales | Actinomycetaceae | Actinomyces |
| 3 | Proteobacteria | Gammaproteobacteria | Xanthomonadales | Xanthomonadaceae | Stenotrophomonas |
| 3 | Bacteroidetes | Bacteroidia | Bacteroidales | Porphyromonadaceae | Parabacteroides |
| 3 | Actinobacteria | Actinobacteria | Bifidobacteriales | Bifidobacteriaceae | Bifidobacterium |
| 3 | Bacteroidetes | Flavobacteriia | Flavobacteriales | Flavobacteriaceae | Flavobacterium |
| 3 | Firmicutes | Bacilli | Bacillales | Family_XI | Gemella |
| 3 | Actinobacteria | Actinobacteria | Corynebacteriales | Corynebacteriaceae | Corynebacterium_1 |
| 3 | Firmicutes | Clostridia | Clostridiales | Clostridiales_vadinBB60_group | Other |
| 3 | Actinobacteria | Actinobacteria | Corynebacteriales | Corynebacteriaceae | Other |
| 3 | Firmicutes | Clostridia | Clostridiales | Lachnospiraceae | Dorea |
| 2 | Firmicutes | Clostridia | Clostridiales | Lachnospiraceae | Lachnospiraceae_UCG_008 |
| 2 | Firmicutes | Clostridia | Clostridiales | Lachnospiraceae | Marvinbryantia |
| 2 | Firmicutes | Clostridia | Clostridiales | Lachnospiraceae | Tyzzerella_4 |
| 2 | Firmicutes | Clostridia | Clostridiales | Lachnospiraceae | Ruminococcus_gauvreauii_group |
| 2 | Firmicutes | Clostridia | Clostridiales | Lachnospiraceae | uncultured |
| 2 | Firmicutes | Clostridia | Clostridiales | Ruminococcaceae | Oscillospira |
| 2 | Firmicutes | Clostridia | Clostridiales | Ruminococcaceae | Ruminiclostridium |
| 2 | Firmicutes | Clostridia | Clostridiales | Ruminococcaceae | Ruminiclostridium_5 |
| 2 | Actinobacteria | Coriobacteriia | Coriobacteriales | Coriobacteriaceae | Senegalimassilia |
| 2 | Firmicutes | Clostridia | Clostridiales | Ruminococcaceae | Ruminococcus_2 |
| 2 | Firmicutes | Clostridia | Clostridiales | Ruminococcaceae | Other |
| 2 | Actinobacteria | Coriobacteriia | Coriobacteriales | Coriobacteriaceae | uncultured |
| 2 | Firmicutes | Erysipelotrichia | Erysipelotrichales | Erysipelotrichaceae | Faecalitalea |
| 2 | Firmicutes | Erysipelotrichia | Erysipelotrichales | Erysipelotrichaceae | Turicibacter |
| 2 | Proteobacteria | Alphaproteobacteria | Rhizobiales | Brucellaceae | Ochrobactrum |
| 2 | Proteobacteria | Betaproteobacteria | Burkholderiales | Alcaligenaceae | Achromobacter |
| 2 | Proteobacteria | Betaproteobacteria | Neisseriales | Neisseriaceae | Neisseria |
| 2 | Bacteroidetes | Bacteroidia | Bacteroidales | Porphyromonadaceae | Barnesiella |
| 2 | Proteobacteria | Gammaproteobacteria | Enterobacteriales | Enterobacteriaceae | Other |
| 2 | Proteobacteria | Gammaproteobacteria | Pseudomonadales | Moraxellaceae | Acinetobacter |
| 2 | Proteobacteria | Gammaproteobacteria | Other | Other | Other |
| 2 | Bacteroidetes | Bacteroidia | Bacteroidales | Porphyromonadaceae | Butyricimonas |
| 2 | Tenericutes | Mollicutes | NB1_n | Other | Other |
| 2 | Verrucomicrobia | Verrucomicrobiae | Verrucomicrobiales | Verrucomicrobiaceae | Akkermansia |
| 2 | Bacteroidetes | Bacteroidia | Bacteroidales | Prevotellaceae | Alloprevotella |
| 2 | Bacteroidetes | Bacteroidia | Bacteroidales | Prevotellaceae | Prevotella_9 |
| 2 | Bacteroidetes | Sphingobacteriia | Sphingobacteriales | Sphingobacteriaceae | Sphingobacterium |
| 2 | Firmicutes | Bacilli | Bacillales | Staphylococcaceae | Staphylococcus |
| 2 | Firmicutes | Bacilli | Lactobacillales | Enterococcaceae | Enterococcus |
| 2 | Firmicutes | Bacilli | Lactobacillales | Enterococcaceae | Other |
| 2 | Firmicutes | Bacilli | Lactobacillales | Lactobacillaceae | Lactobacillus |
| 2 | Firmicutes | Clostridia | Clostridiales | Clostridiaceae_1 | Clostridium_sensu_stricto_1 |
| 2 | Firmicutes | Clostridia | Clostridiales | Family_XIII | Family_XIII_AD3011_group |
| 2 | Firmicutes | Clostridia | Clostridiales | Lachnospiraceae | Lachnospiraceae_NC2004_group |
| 1 | Firmicutes | Clostridia | Clostridiales | Lachnospiraceae | Eubacterium_ruminantium_group |
| 1 | Firmicutes | Clostridia | Clostridiales | Peptococcaceae | uncultured |
| 1 | Firmicutes | Clostridia | Clostridiales | Ruminococcaceae | Oscillibacter |
| 1 | Firmicutes | Clostridia | Clostridiales | Ruminococcaceae | Ruminococcaceae_UCG_003 |
| 1 | Firmicutes | Clostridia | Clostridiales | Ruminococcaceae | Eubacterium_coprostanoligenes_group |
| 1 | Firmicutes | Erysipelotrichia | Erysipelotrichales | Erysipelotrichaceae | Holdemanella |
| 1 | Firmicutes | Negativicutes | Selenomonadales | Acidaminococcaceae | Acidaminococcus |
| 1 | Firmicutes | Negativicutes | Selenomonadales | Acidaminococcaceae | Phascolarctobacterium |
| 1 | Firmicutes | Negativicutes | Selenomonadales | Veillonellaceae | Dialister |
| 1 | Firmicutes | Negativicutes | Selenomonadales | Veillonellaceae | Megasphaera |
| 1 | Proteobacteria | Alphaproteobacteria | Rhizobiales | Brucellaceae | Falsochrobactrum |
| 1 | Proteobacteria | Alphaproteobacteria | Rhizobiales | Brucellaceae | Other |
| 1 | Proteobacteria | Betaproteobacteria | Burkholderiales | Alcaligenaceae | Alcaligenes |
| 1 | Proteobacteria | Betaproteobacteria | Burkholderiales | Alcaligenaceae | Parasutterella |
| 1 | Proteobacteria | Betaproteobacteria | Burkholderiales | Comamonadaceae | Comamonas |
| 1 | Proteobacteria | Deltaproteobacteria | Desulfovibrionales | Desulfovibrionaceae | Desulfovibrio |
| 1 | Proteobacteria | Gammaproteobacteria | Enterobacteriales | Enterobacteriaceae | Ambiguous_taxa |
| 1 | Proteobacteria | Gammaproteobacteria | Enterobacteriales | Enterobacteriaceae | Salmonella |
| 1 | Proteobacteria | Gammaproteobacteria | Enterobacteriales | Enterobacteriaceae | Tatumella |
| 1 | Proteobacteria | Gammaproteobacteria | Pasteurellales | Pasteurellaceae | Other |
| 1 | Synergistetes | Synergistia | Synergistales | Synergistaceae | Cloacibacillus |
| 1 | Bacteroidetes | Bacteroidia | Bacteroidales | Porphyromonadaceae | Coprobacter |
| 1 | Bacteroidetes | Bacteroidia | Bacteroidales | Porphyromonadaceae | Odoribacter |
| 1 | Bacteroidetes | Bacteroidia | Bacteroidales | Porphyromonadaceae | uncultured |
| 1 | Bacteroidetes | Bacteroidia | Bacteroidales | Prevotellaceae | Prevotella_2 |
| 1 | Bacteroidetes | Flavobacteriia | Flavobacteriales | Flavobacteriaceae | Chryseobacterium |
| 1 | Actinobacteria | Actinobacteria | Corynebacteriales | Corynebacteriaceae | Corynebacterium |
| 1 | Firmicutes | Clostridia | Clostridiales | Lachnospiraceae | Butyrivibrio |
| 1 | Firmicutes | Clostridia | Clostridiales | Lachnospiraceae | Lachnospiraceae_NK4A136_group |
| 1 | Firmicutes | Clostridia | Clostridiales | Lachnospiraceae | Lachnospiraceae_NK4B4_group |
Table A9.
Prevalence of Bifidobacterium and Lactobacillus
| Dataset | Prevalence of Bifidobacterium without cut‐off | Prevalence of Lactobacillus without cut‐off | Prevalence of Bifidobacterium a | Prevalence of Lactobacillus a |
|---|---|---|---|---|
| AGP | 79.5% | 31.7% | 79.5% | 31.7% |
| NBT | 100.0% | 100.0% | 93.1% | 39.1% |
Relative abundance of Bifidobacterium and Lactobacillus over 0.0001.
Table A10.
The outcomes of the logistic and negative binomial component of the fitted ZINB regression model for Bifidobacterium
| Logistic regression component | Negative binomial regression component | |||||||
|---|---|---|---|---|---|---|---|---|
| Estimate | Std. Error | Z value | Pr(>|z|) | Estimate | Std. Error | Z value | Pr(>|z|) | |
| (Intercept) | −10.841 | 0.183 | −59.086 | 0 | 6.284 | 0.144 | 43.704 | 0 |
| Age | 0.025 | 0.002 | 12.059 | 0 | −0.021 | 0.001 | −17.697 | 0 |
| Sex | ||||||||
| Female | Reference category | |||||||
| Male | −0.357 | 0.067 | −5.328 | 0 | 0.01 | 0.042 | 0.231 | 0.818 |
| Race | ||||||||
| Caucasian | Reference category | |||||||
| African American | −0.981 | 0.553 | −1.773 | 0.076 | 0.294 | 0.253 | 1.163 | 0.245 |
| Asian or Pacific Islander | −1.116 | 0.221 | −5.061 | 0 | 0.734 | 0.091 | 8.101 | 0 |
| Hispanic | −0.603 | 0.257 | −2.344 | 0.019 | −0.251 | 0.138 | −1.821 | 0.069 |
| Other | −0.087 | 0.191 | −0.454 | 0.65 | −0.113 | 0.113 | −1.005 | 0.315 |
| Geographic location | ||||||||
| North America | Reference category | |||||||
| Europe | −0.587 | 0.074 | −7.922 | 0 | 0.113 | 0.047 | 2.417 | 0.016 |
| Oceania | −0.02 | 0.167 | −0.122 | 0.903 | −0.338 | 0.108 | −3.141 | 0.002 |
| Others | 0.27 | 0.507 | 0.532 | 0.595 | 0.996 | 0.35 | 2.843 | 0.004 |
| Whole grain | ||||||||
| Never | Reference category | |||||||
| Low frequency | −0.471 | 0.1 | −4.709 | 0 | 0.271 | 0.08 | 3.401 | 0.001 |
| High frequency | −0.755 | 0.101 | −7.447 | 0 | 0.569 | 0.08 | 7.119 | 0 |
| Vegetable | ||||||||
| Never | −0.26 | 0.342 | −0.76 | 0.447 | 1.138 | 0.238 | 4.773 | 0 |
| Low frequency | −0.062 | 0.111 | −0.56 | 0.576 | 0.221 | 0.07 | 3.147 | 0.002 |
| High frequency | Reference category | |||||||
| Fruit | ||||||||
| Never | Reference category | |||||||
| Low frequency | −0.444 | 0.144 | −3.091 | 0.002 | −0.076 | 0.116 | −0.657 | 0.511 |
| High frequency | −0.69 | 0.142 | −4.851 | 0 | −0.189 | 0.114 | −1.657 | 0.098 |
| Milk and cheese | ||||||||
| Never | Reference category | |||||||
| Low frequency | −0.321 | 0.099 | −3.257 | 0.001 | −0.162 | 0.072 | −2.236 | 0.025 |
| High frequency | −0.374 | 0.096 | −3.907 | 0 | −0.079 | 0.07 | −1.131 | 0.258 |
| C‐section | ||||||||
| False | Reference category | |||||||
| True | 0.124 | 0.11 | 1.132 | 0.257 | 0.012 | 0.067 | 0.185 | 0.854 |
| Feeding patterns | ||||||||
| Primarily breast milk | Reference category | |||||||
| A mixture of breast milk and formula | 0.171 | 0.085 | 2.01 | 0.044 | 0.032 | 0.056 | 0.566 | 0.572 |
| Primarily infant formula | −0.022 | 0.076 | −0.283 | 0.777 | 0.077 | 0.051 | 1.504 | 0.133 |
| Antibiotic | ||||||||
| Never | Reference category | |||||||
| Low frequency | 0.251 | 0.073 | 3.465 | 0.001 | −0.005 | 0.048 | −0.107 | 0.915 |
| High frequency | 0.11 | 0.134 | 0.815 | 0.415 | 0.4 | 0.099 | 4.021 | 0 |
| IBD | ||||||||
| False | Reference category | |||||||
| True | 0.133 | 0.133 | 1.004 | 0.315 | 0.461 | 0.101 | 4.558 | 0 |
| IBS | ||||||||
| False | Reference category | |||||||
| True | 0.264 | 0.081 | 3.266 | 0.001 | 0.161 | 0.056 | 2.887 | 0.004 |
| Autoimmune disease | ||||||||
| False | Reference category | |||||||
| True | 0.246 | 0.092 | 2.68 | 0.007 | −0.15 | 0.072 | −2.1 | 0.036 |
| Cardiovascular disease | ||||||||
| False | Reference category | |||||||
| True | −0.179 | 0.187 | −0.955 | 0.339 | 0.127 | 0.128 | 0.997 | 0.319 |
| Food allergy | ||||||||
| False | Reference category | |||||||
| True | 0.064 | 0.07 | 0.923 | 0.356 | −0.201 | 0.045 | −4.424 | 0 |
Feng Y, Duan Y, Xu Z, et al. An examination of data from the American Gut Project reveals that the dominance of the genus Bifidobacterium is associated with the diversity and robustness of the gut microbiota. MicrobiologyOpen. 2019;8:e939 10.1002/mbo3.939
Funding information
This work was supported by the National Basic Research Program of China (grant number 2015CB554200), the National Natural Science Foundation of China (grant number 31601081), and the Beijing Municipal Natural Science Foundation (grant number 5174037).
DATA AVAILABILITY STATEMENT
All data used for this paper is available at ebi.ac.uk/ena (accession # https://www.ebi.ac.uk/ena/data/view/PRJEB11419) for the AGP dataset and meta.genomics.cn/meta/dataTools for the NBT dataset. The R scripts used for analysis in this paper are available in the following link: https://doi.org/10.6084/m9.figshare.9756599.v1.
REFERENCES
- Alan, A. (2015). Foundations of linear and generalized linear models. Hoboken, NJ: John Wiley & Sons. [Google Scholar]
- Albert, J. M. , Wang, W. , & Nelson, S. (2014). Estimating overall exposure effects for zero‐inflated regression models with application to dental caries. Statistical Methods in Medical Research, 23, 257–278. 10.1177/0962280211407800 [DOI] [PMC free article] [PubMed] [Google Scholar]
- Albert, R. , Jeong, H. , & Barabási, A.‐L. (2000). Error and attack tolerance of complex networks. Nature, 406, 378–382. 10.1038/35019019 [DOI] [PubMed] [Google Scholar]
- Amir, A. , McDonald, D. , Navas‐Molina, J. A. , Debelius, J. , Morton, J. T. , Hyde, E. , … Knight, R. (2017). Correcting for microbial blooms in fecal samples during room‐temperature shipping. mSystems, 2, e00199‐216 10.1128/mSystems.00199-16 [DOI] [PMC free article] [PubMed] [Google Scholar]
- Angulo, M. T. , Moog, C. H. , & Liu, Y.‐Y. (2019). A theoretical framework for controlling complex microbial communities. Nature Communications, 10, 1045 10.1038/s41467-019-08890-y [DOI] [PMC free article] [PubMed] [Google Scholar]
- Banerjee, S. , Schlaeppi, K. , & van der Heijden, M. G. A. (2018). Keystone taxa as drivers of microbiome structure and functioning. Nature Reviews Microbiology, 16, 567–576. 10.1038/s41579-018-0024-1 [DOI] [PubMed] [Google Scholar]
- Barberán, A. , Bates, S. T. , Casamayor, E. O. , & Fierer, N. (2012). Using network analysis to explore co‐occurrence patterns in soil microbial communities. ISME Journal, 6, 343–351. 10.1038/ismej.2011.119 [DOI] [PMC free article] [PubMed] [Google Scholar]
- Benjamini, Y. , & Hochberg, Y. (1995). Controlling the false discovery rate ‐ A practical and powerful approach to multiple testing. Journal of the Royal Statistical Society: Series B (Methodological), 57, 289–300. 10.1111/j.2517-6161.1995.tb02031.x [DOI] [Google Scholar]
- Bermudez‐Brito, M. , Plaza‐Díaz, J. , Muñoz‐Quezada, S. , Gómez‐Llorente, C. , & Gil, A. (2012). Probiotic mechanisms of action. Annals of Nutrition & Metabolism, 61, 160–174. 10.1159/000342079 [DOI] [PubMed] [Google Scholar]
- Blaser, M. J. (2006). Who are we? Indigenous microbes and the ecology of human diseases. EMBO Reports, 7, 956–960. 10.1038/sj.embor.7400812 [DOI] [PMC free article] [PubMed] [Google Scholar]
- Bray, J. R. , & Curtis, J. T. (1957). An ordination of the upland forest communities of Southern Wisconsin. Ecological Monographs, 27, 325–349. 10.2307/1942268 [DOI] [Google Scholar]
- Callahan, B. J. , McMurdie, P. J. , Rosen, M. J. , Han, A. W. , Johnson, A. J. A. , & Holmes, S. P. (2016). DADA2: High‐resolution sample inference from Illumina amplicon data. Nature Methods, 13, 581–583. 10.1038/nmeth.3869 [DOI] [PMC free article] [PubMed] [Google Scholar]
- Chapman, C. M. C. , Gibson, G. R. , & Rowland, I. (2011). Health benefits of probiotics: Are mixtures more effective than single strains? European Journal of Nutrition, 50, 1–17. 10.1007/s00394-010-0166-z [DOI] [PubMed] [Google Scholar]
- Claesson, M. J. , Jeffery, I. B. , Conde, S. , Power, S. E. , O’Connor, E. M. , Cusack, S. , … O’Toole, P. W. (2012). Gut microbiota composition correlates with diet and health in the elderly. Nature, 488, 178–184. 10.1038/nature11319 [DOI] [PubMed] [Google Scholar]
- Costea, P. I. , Zeller, G. , Sunagawa, S. , Pelletier, E. , Alberti, A. , Levenez, F. , … Bork, P. (2017). Towards standards for human fecal sample processing in metagenomic studies. Nature Biotechnology, 35, 1069–1076. 10.1038/nbt.3960 [DOI] [PubMed] [Google Scholar]
- Cozma‐Petruţ, A. , Loghin, F. , Miere, D. , & Dumitraşcu, D. L. (2017). Diet in irritable bowel syndrome: What to recommend, not what to forbid to patients!. World Journal of Gastroenterology, 23, 3771–3783. 10.3748/wjg.v23.i21.3771 [DOI] [PMC free article] [PubMed] [Google Scholar]
- Delgado‐Baquerizo, M. , Oliverio, A. M. , Brewer, T. E. , Benavent‐González, A. , Eldridge, D. J. , Bardgett, R. D. , … Fierer, N. (2018). A global atlas of the dominant bacteria found in soil. Science, 325, 320–325. 10.1126/science.aap9516 [DOI] [PubMed] [Google Scholar]
- Deschasaux, M. , Bouter, K. E. , Prodan, A. , Levin, E. , Groen, A. K. , Herrema, H. , … Nieuwdorp, M. (2018). Depicting the composition of gut microbiota in a population with varied ethnic origins but shared geography. Nature Medicine, 24, 1526–1531. 10.1038/s41591-018-0160-1 [DOI] [PubMed] [Google Scholar]
- Falony, G. , Joossens, M. , Vieira‐Silva, S. , Wang, J. , Darzi, Y. , Faust, K. , … Raes, J. (2016). Population‐level analysis of gut microbiome variation. Science, 352, 560–564. 10.1126/science.aad3503 [DOI] [PubMed] [Google Scholar]
- Fitzpatrick, C. R. , Copeland, J. , Wang, P. W. , Guttman, D. S. , Kotanen, P. M. , & Johnson, M. T. J. (2018). Assembly and ecological function of the root microbiome across angiosperm plant species. Proceedings of the National Academy of Sciences of the United States of America, 115, E1157–E1165. 10.1073/pnas.1717617115 [DOI] [PMC free article] [PubMed] [Google Scholar]
- Giatsis, C. , Sipkema, D. , Ramiro‐Garcia, J. , Bacanu, G. M. , Abernathy, J. , Verreth, J. , … Verdegem, M. (2016). Probiotic legacy effects on gut microbial assembly in tilapia larvae. Scientific Reports, 6, 33965 10.1038/srep33965 [DOI] [PMC free article] [PubMed] [Google Scholar]
- Han, K. , Wang, J. , Seo, J.‐G. , & Kim, H. (2017). Efficacy of double‐coated probiotics for irritable bowel syndrome: A randomized double‐blind controlled trial. Journal of Gastroenterology, 52, 432–443. 10.1007/s00535-016-1224-y [DOI] [PubMed] [Google Scholar]
- Hesla, H. M. , Stenius, F. , Jäderlund, L. , Nelson, R. , Engstrand, L. , Alm, J. , & Dicksved, J. (2014). Impact of lifestyle on the gut microbiota of healthy infants and their mothers‐the ALADDIN birth cohort. FEMS Microbiology Ecology, 90, 791–801. 10.1111/1574-6941.12434 [DOI] [PubMed] [Google Scholar]
- Hill, J. (2006). Data analysis using regression and multilevel/hierarchical models. Cambridge, UK: Cambridge University Press. [Google Scholar]
- Ives, A. R. , & Carpenter, S. R. (2007). Stability and diversity of ecosystems. Science, 317, 58–62. 10.1126/science.1133258 [DOI] [PubMed] [Google Scholar]
- Iyer, S. , Killingback, T. , Sundaram, B. , & Wang, Z. (2013). Attack robustness and centrality of complex networks. PLoS ONE, 8, e59613 10.1371/journal.pone.0059613 [DOI] [PMC free article] [PubMed] [Google Scholar]
- Jun, W. U. , Barahona, M. , Yue‐Jin, T. , & Hong‐Zhong, D. (2010). Natural connectivity of complex networks. Chinese Physics Letters, 27, 78902 10.1088/0256-307X/27/7/078902 [DOI] [Google Scholar]
- Karlsson, C. , Ahrné, S. , Molin, G. , Berggren, A. , Palmquist, I. , Fredrikson, G. N. , & Jeppsson, B. (2010). Probiotic therapy to men with incipient arteriosclerosis initiates increased bacterial diversity in colon: A randomized controlled trial. Atherosclerosis, 208, 228–233. 10.1016/j.atherosclerosis.2009.06.019 [DOI] [PubMed] [Google Scholar]
- Kato, K. , Odamaki, T. , Mitsuyama, E. , Sugahara, H. , Xiao, J.‐Z. , & Osawa, R. O. (2017). Age‐related changes in the composition of gut Bifidobacterium species. Current Microbiology, 74, 987–995. 10.1007/s00284-017-1272-4 [DOI] [PMC free article] [PubMed] [Google Scholar]
- Kato‐Kataoka, A. , Nishida, K. , Takada, M. , Kawai, M. , Kikuchi‐Hayakawa, H. , Suda, K. , … Rokutan, K. (2016). Fermented milk containing lactobacillus casei strain shirota preserves the diversity of the gut microbiota and relieves abdominal dysfunction in healthy medical students exposed to academic stress. Applied and Environment Microbiology, 82, 3649–3658. 10.1128/AEM.04134-15 [DOI] [PMC free article] [PubMed] [Google Scholar]
- Kristensen, N. B. , Bryrup, T. , Allin, K. H. , Nielsen, T. , Hansen, T. H. , & Pedersen, O. (2016). Alterations in fecal microbiota composition by probiotic supplementation in healthy adults: A systematic review of randomized controlled trials. Genome Medicine, 8, 52 10.1186/s13073-016-0300-5 [DOI] [PMC free article] [PubMed] [Google Scholar]
- Kumar, S. , Stecher, G. , & Tamura, K. (2016). MEGA7: Molecular Evolutionary Genetics Analysis version 7.0 for bigger datasets. Molecular Biology and Evolution, 33, 1870–1874. 10.1093/molbev/msw054 [DOI] [PMC free article] [PubMed] [Google Scholar]
- Kurtz, Z. D. , Müller, C. L. , Miraldi, E. R. , Littman, D. R. , Blaser, M. J. , & Bonneau, R. A. (2015). Sparse and compositionally robust inference of microbial ecological networks. PLoS Computational Biology, 11, e1004226 10.1371/journal.pcbi.1004226 [DOI] [PMC free article] [PubMed] [Google Scholar]
- Laursen, R. P. , Larnkjær, A. , Ritz, C. , Hauger, H. , Michaelsen, K. F. , & Mølgaard, C. (2017). Probiotics and child care absence due to infections: A randomized controlled trial. Pediatrics, 140, e20170735 10.1542/peds.2017-0735 [DOI] [PubMed] [Google Scholar]
- Le Chatelier, E. , Nielsen, T. , Qin, J. , Prifti, E. , Hildebrand, F. , Falony, G. , … Pedersen, O. (2013). Richness of human gut microbiome correlates with metabolic markers. Nature, 500, 541–546. 10.1038/nature12506 [DOI] [PubMed] [Google Scholar]
- Li, J. , Jia, H. , Cai, X. , Zhong, H. , Feng, Q. , Sunagawa, S. , … Wang, J. (2014). An integrated catalog of reference genes in the human gut microbiome. Nature Biotechnology, 32, 834–841. 10.1038/nbt.2942 [DOI] [PubMed] [Google Scholar]
- Li, S. , & Wu, F. (2018). Diversity and co‐occurrence patterns of soil bacterial and fungal communities in seven intercropping systems. Frontiers in Microbiology, 9, 1521 10.3389/fmicb.2018.01521 [DOI] [PMC free article] [PubMed] [Google Scholar]
- Liu, M. , Koh, H. , Kurtz, Z. D. , Battaglia, T. , PeBenito, A. , Li, H. , … Blaser, M. J. (2017). Oxalobacter formigenes‐associated host features and microbial community structures examined using the American Gut Project. Microbiome, 5, 108 10.1186/s40168-017-0316-0 [DOI] [PMC free article] [PubMed] [Google Scholar]
- Mahana, D. , Trent, C. M. , Kurtz, Z. D. , Bokulich, N. A. , Battaglia, T. , Chung, J. , … Blaser, M. J. (2016). Antibiotic perturbation of the murine gut microbiome enhances the adiposity, insulin resistance, and liver disease associated with high‐fat diet. Genome Medicine, 8, 48 10.1186/s13073-016-0297-9 [DOI] [PMC free article] [PubMed] [Google Scholar]
- Martínez, I. , Lattimer, J. M. , Hubach, K. L. , Case, J. A. , Yang, J. , Weber, C. G. , … Walter, J. (2013). Gut microbiome composition is linked to whole grain‐induced immunological improvements. ISME Journal, 7, 269–280. 10.1038/ismej.2012.104 [DOI] [PMC free article] [PubMed] [Google Scholar]
- Mennini, M. , Dahdah, L. , Artesani, M. C. , Fiocchi, A. , & Martelli, A. (2017). Probiotics in asthma and allergy prevention. Frontiers in Pediatrics, 5, 165 10.3389/fped.2017.00165 [DOI] [PMC free article] [PubMed] [Google Scholar]
- Methé, B. A. , Nelson, K. E. , Pop, M. , Creasy, H. H. , Giglio, M. G. , Huttenhower, C. , … White, O. (2012). A framework for human microbiome research. Nature, 486, 215–221. [DOI] [PMC free article] [PubMed] [Google Scholar]
- Moens, F. , Verce, M. , & De Vuyst, L. (2017). Lactate‐ and acetate‐based cross‐feeding interactions between selected strains of lactobacilli, bifidobacteria and colon bacteria in the presence of inulin‐type fructans. International Journal of Food Microbiology, 241, 225–236. 10.1016/j.ijfoodmicro.2016.10.019 [DOI] [PubMed] [Google Scholar]
- Nielsen, H. B. , Almeida, M. , Juncker, A. S. , Rasmussen, S. , Li, J. , Sunagawa, S. , … Ehrlich, S. D. (2014). Identification and assembly of genomes and genetic elements in complex metagenomic samples without using reference genomes. Nature Biotechnology, 32, 822–828. 10.1038/nbt.2939 [DOI] [PubMed] [Google Scholar]
- Presti, I. , D’Orazio, G. , Labra, M. , La Ferla, B. , Mezzasalma, V. , Bizzaro, G. , … Di Gennaro, P. (2015). Evaluation of the probiotic properties of new Lactobacillus and Bifidobacterium strains and their in vitro effect. Applied Microbiology and Biotechnology, 99, 5613–5626. 10.1007/s00253-015-6482-8 [DOI] [PubMed] [Google Scholar]
- Qin, J. , Li, R. , Raes, J. , Arumugam, M. , Burgdorf, K. S. , Manichanh, C. , … Wang, J. (2010). A human gut microbial gene catalogue established by metagenomic sequencing. Nature, 464, 59–65. 10.1038/nature08821 [DOI] [PMC free article] [PubMed] [Google Scholar]
- Qin, J. , Li, Y. , Cai, Z. , Li, S. , Zhu, J. , Zhang, F. , … Wang, J. (2012). A metagenome‐wide association study of gut microbiota in type 2 diabetes. Nature, 490, 55–60. 10.1038/nature11450 [DOI] [PubMed] [Google Scholar]
- Quast, C. , Pruesse, E. , Yilmaz, P. , Gerken, J. , Schweer, T. , Yarza, P. , … Glöckner, F. O. (2012). The SILVA ribosomal RNA gene database project: Improved data processing and web‐based tools. Nucleic Acids Research, 41, 590–596. 10.1093/nar/gks1219 [DOI] [PMC free article] [PubMed] [Google Scholar]
- Ryan, S. M. , Fitzgerald, G. F. , & van Sinderen, D. (2006). Screening for and identification of starch‐, amylopectin‐, and pullulan‐degrading activities in bifidobacterial strains. Applied and Environment Microbiology, 72, 5289–5296. 10.1128/AEM.00257-06 [DOI] [PMC free article] [PubMed] [Google Scholar]
- Salminen, S. , Bouley, C. , Boutron, M.‐C. , Cummings, J. H. , Franck, A. , Gibson, G. R. , … Rowland, I. (1998). Functional food science and gastrointestinal physiology and function. British Journal of Nutrition, 80(Suppl 1), S147–S171. 10.1079/BJN19980108 [DOI] [PubMed] [Google Scholar]
- Sender, R. , Fuchs, S. , & Milo, R. (2016). Are we really vastly outnumbered? Revisiting the ratio of bacterial to host cells in humans. Cell, 164, 337–340. 10.1016/j.cell.2016.01.013 [DOI] [PubMed] [Google Scholar]
- Soliveres, S. , Manning, P. , Prati, D. , Gossner, M. M. , Alt, F. , Arndt, H. , … Allan, E. (2016). Locally rare species influence grassland ecosystem multifunctionality. Philosophical Transactions of the Royal Society of London. Series B, Biological Sciences, 371, 20150269 10.1098/rstb.2015.0269 [DOI] [PMC free article] [PubMed] [Google Scholar]
- Stewart, C. J. , Ajami, N. J. , O’Brien, J. L. , Hutchinson, D. S. , Smith, D. P. , Wong, M. C. , … Petrosino, J. F. (2018). Temporal development of the gut microbiome in early childhood from the TEDDY study. Nature, 562, 583–588. 10.1038/s41586-018-0617-x [DOI] [PMC free article] [PubMed] [Google Scholar]
- Tremaroli, V. , & Backhed, F. (2012). Functional interactions between the gut microbiota and host metabolism. Nature, 489, 242–249. 10.1038/nature11552 [DOI] [PubMed] [Google Scholar]
- Uusitalo, U. , Liu, X. , Yang, J. , Aronsson, C. A. , Hummel, S. , Butterworth, M. , … Virtanen, S. M. (2016). Association of early exposure of probiotics and islet autoimmunity in the TEDDY study. JAMA Pediatrics, 170, 20–28. 10.1001/jamapediatrics.2015.2757 [DOI] [PMC free article] [PubMed] [Google Scholar]
- van Zanten, G. C. , Krych, L. , Roytio, H. , Forssten, S. , Lahtinen, S. J. , Abu Al‐Soud, W. , … Jakobsen, M. (2014). Synbiotic Lactobacillus acidophilus NCFM and cellobiose does not affect human gut bacterial diversity but increases abundance of lactobacilli, bifidobacteria and branched‐chain fatty acids: A randomized, double‐blinded cross‐over trial. FEMS Microbiology Ecology, 90, 225–236. [DOI] [PubMed] [Google Scholar]
- Vital, M. , Howe, A. C. , & Tiedje, J. M. (2014). Revealing the bacterial butyrate synthesis pathways by analyzing (meta)genomic data. MBio, 5, e00889 10.1128/mBio.00889-14 [DOI] [PMC free article] [PubMed] [Google Scholar]
- Vitetta, L. , Saltzman, E. , Nikov, T. , Ibrahim, I. , & Hall, S. (2016). Modulating the gut micro‐environment in the treatment of intestinal parasites. Journal of Clinical Medicine, 5(11), 102 10.3390/jcm5110102 [DOI] [PMC free article] [PubMed] [Google Scholar]
- Zapala, M. A. , & Schork, N. J. (2006). Multivariate regression analysis of distance matrices for testing associations between gene expression patterns and related variables. Proceedings of the National Academy of Sciences of the United States of America, 103, 19430–19435. 10.1073/pnas.0609333103 [DOI] [PMC free article] [PubMed] [Google Scholar]
Associated Data
This section collects any data citations, data availability statements, or supplementary materials included in this article.
Data Availability Statement
All data used for this paper is available at ebi.ac.uk/ena (accession # https://www.ebi.ac.uk/ena/data/view/PRJEB11419) for the AGP dataset and meta.genomics.cn/meta/dataTools for the NBT dataset. The R scripts used for analysis in this paper are available in the following link: https://doi.org/10.6084/m9.figshare.9756599.v1.


