

Abstract
The excess low-frequency vibrational spectrum, called boson peak, and non-affine elastic response are the most important particularities of glasses. Herein, the vibrational and mechanical properties of polymeric glasses are examined by using coarse-grained molecular dynamics simulations, with particular attention to the effects of the bending rigidity of the polymer chains. As the rigidity increases, the system undergoes a glass transition at a higher temperature (under a constant pressure), which decreases the density of the glass phase. The elastic moduli, which are controlled by the decrease of the density and the increase of the rigidity, show a non-monotonic dependence on the rigidity of the polymer chain that arises from the non-affine component. Moreover, a clear boson peak is observed in the vibrational density of states, which depends on the macroscopic shear modulus G. In particular, the boson peak frequency ωBP is proportional to . These results provide a positive correlation between the boson peak, shear elasticity, and the glass transition temperature.
Subject terms: Glasses, Polymers
Introduction
Glasses show vibrational and mechanical properties that are markedly different from other crystalline materials1,2. Thermal measurements and scattering experiments have been performed to study the properties of various glassy systems, such as covalent-bonding3–8, molecular9–13, metallic14–17, and polymeric18–23 glasses. For instance, the excess vibrational modes at low frequencies and the excess heat capacity at low temperatures exceeding the Debye predictions, which describe the corresponding crystalline values, have been observed universally in various glassy materials. This phenomenon, which is referred to as the boson peak (BP), has been widely studied.
The ideas of elastic heterogeneities24–26 and criticality near isostatic state and marginally stable state27–30 have been introduced, following the recent theoretical advances for understanding the origin of anomalies in glasses. Based on these theories, the mean-field formulations have been developed by using the effective medium technique24–26,29,30. In addition, more recent studies31,32 have focused on the local inversion-symmetry breaking, which can explain the microscopic origin of the BP. The anomalous vibrational properties in both crystals and glasses have also been investigated within the framework of the phonon Green's function33.
Molecular dynamics (MD) simulations play an essential role for studying the vibrational and mechanical properties of glasses. Firstly, MD simulations enable to assess the theoretical predictions. In fact, various MD simulations have been performed on simple atomic glasses, e.g., Lennard-Jones (LJ) systems34–40. Concerning the isostaticity and marginal stability27–30, the systems with a finite-ranged, purely repulsive potential have also been studied41–44, and are considered as the simplest model of glasses. In particular, it is crucial for MD simulations to solve finite-dimensional effects that are not captured by the mean-field treatments45–47. Secondly, MD simulations perform quasi-experiments on well-defined systems and access data that cannot be examined experimentally. Relevant systems to experiments and applications have been simulated, including covalent-bonding48–53, metallic54–57, polymeric58–62 glasses. These simulation studies complete theoretical understandings based on simple systems and experimental observations of more complex systems.
The vibrational properties and the BP of polymeric glasses have been studied by both of experiments18–23 and MD simulations58–62. The effects caused by non-covalent bonds including bending forces and chain length represent an important feature of polymer glasses. Previous experiments18,19 have investigated the effects of the pressure or densification on the frequency and intensity of the BP in polymeric glasses. It was demonstrated that the evolution of the BP with pressure cannot be scaled by the Debye values (i.e., the Debye frequency and the Debye level). Therefore, the pressure effects cannot be explained only by the variation of macroscopic elasticity. In contrast, another experiment20 has shown that the polymerization effects on the BP is explained by the change in macroscopic elasticity as the frequency and intensity variations of the BP are both scaled by the Debye values.
In addition, Zaccone et al. have recently performed MD simulations to calculate the vibrational density of states (vDOS) in polymeric glasses by changing the chain length and the rigidity of the chain bending61. This work studied the vibrational eigenstates in a wide range of frequencies and the effects of the chain length and bending rigidity on the high-frequency spectra. Furthermore, Giuntoli and Leporini studied the BP of polymeric glasses having chains with highly rigid bonds62. It was demonstrated that the BP decouples with macroscopic elasticity and arises from non-bonding interactions only. Although these studies61,62 have helped understand polymeric glass properties, the effects of bending rigidity and chain length on the low-frequency spectra and BP need to be further studied.
Herein, the vDOS and the elastic moduli of polymeric glasses are analyzed through coarse-grained MD simulations (see Methods). In particular, the connection between the BP and elasticity as well as the glass transition temperature is explored by systematically changing the bending stiffness of short and long polymer chains. The contributions of the present study are given as follows. We demonstrate that polymeric glasses can exhibit extremely-large non-affine elastic response (compared to atomic glasses), whereas the BP is simply scaled by the behavior of macroscopic shear modulus. This behavior of the BP can be explained by the theory of elastic heterogeneities24–26. Our results indicate that effects of the bending rigidity on the BP are encompassed in change of macroscopic elasticity, which is in contrast to effects of pressure18,19, but instead is similar to effects of polymerization20. Furthermore, we show the positive correlation among the BP, elasticity, and the glass transition temperature. Finally, we will discuss the relaxation dynamics in the liquid state, in relation to our results of low-frequency vibrational spectra.
Results
Glass transition temperature
When the polymeric system is cooled down from the liquid state under a constant pressure, the volume of the system monotonically decreases with decreasing the temperature. Figure 1a shows the specific volume as a function of the temperature for several different bending rigidities and the chain length . For each value of , the slope of the - curve clearly presents a discontinuous change at a certain temperature, which is defined as the glass transition temperature . Figure 1b (triangles) presents the value of as a function of . As the rigidity increases from to , progressively increases from to 0.75. Below and above , the variation of is low or even negligible. In addition, Fig. 1b (circles) plots the density of the system that is quenched down to . The density decreases from to 0.97 as the rigidity increases from to . As the chain bending becomes rigid, the glass transition occurs at a higher temperature, and as a result, the density in the glass state becomes lower. The similar observation was obtained by Milkus et al.61.
Figure 1.
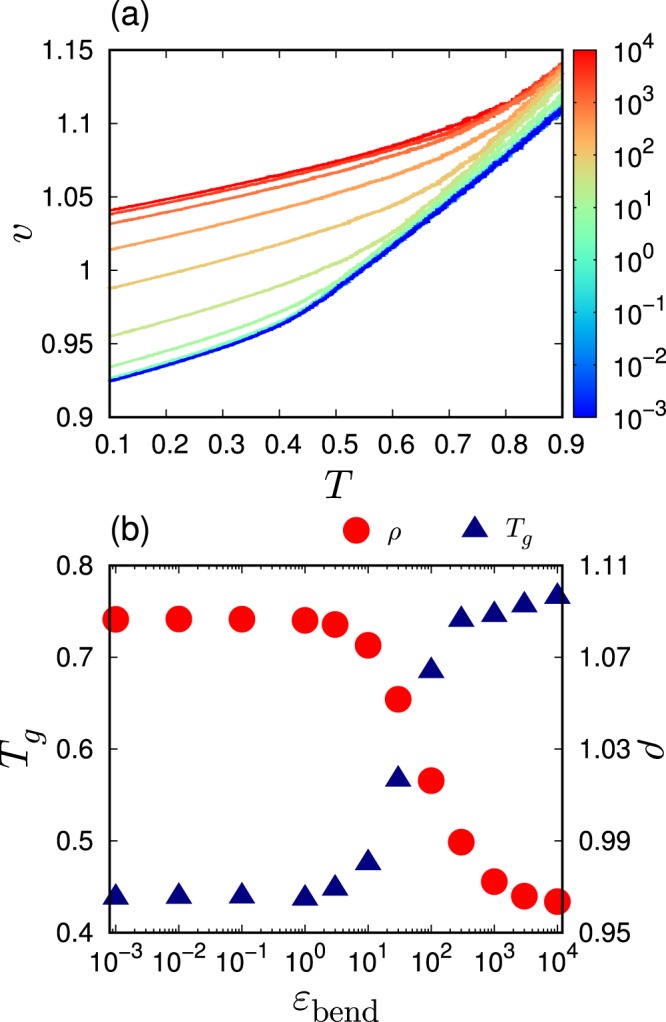
Glass transition temperature and density in the glass state. (a) The specific volume versus the temperature during the process that the system is cooled down from the liquid state to the glass state. The color of line indicates the value of bending rigidity according to the color bar. (b) Glass transition temperature (triangles) and density at zero temperature after the glass transition (circles) are plotted against . The chain length is .
These behaviors of and can be understood by studying the microscopic conformation of the polymeric chains. Figure 2a presents the probability distribution of the angle formed by three consecutive beads along the chain, , when changing the rigidity . Two peaks are observed at approximately and for a low rigidity (). A similar distribution was also reported in ref. 61. As the rigidity increases, the peak position in shifts towards . It is noted that the bending potential in Eq. 5 tends to stabilize the angle at . In addition, Fig. 2b presents the radius of gyration as a function of . It can be observed that increases from to 16.5 with an increasing . Importantly, these variations of conformation are induced intensively when the rigidity increases from to , which exactly matches the region where variations of and are observed in Fig. 1b. Therefore, it can be concluded that the conformation changes of the polymeric chains control the glass transition temperature and the density. In fact, as the rigidity of the chain bending increases, the angle of the polymer chains tends to be stabilized at and the radius of inertia increases. As a result, the glass transition occurs at a higher temperature and the lower density (larger volume). At , the effect of the bending interaction of Eq. 5 is weak compared to those of the LJ and finitely extensible nonlinear elastic (FENE) components of Eqs. 3 and 4 (see Methods). However, at , the opposite phenomenon occurs.
Figure 2.
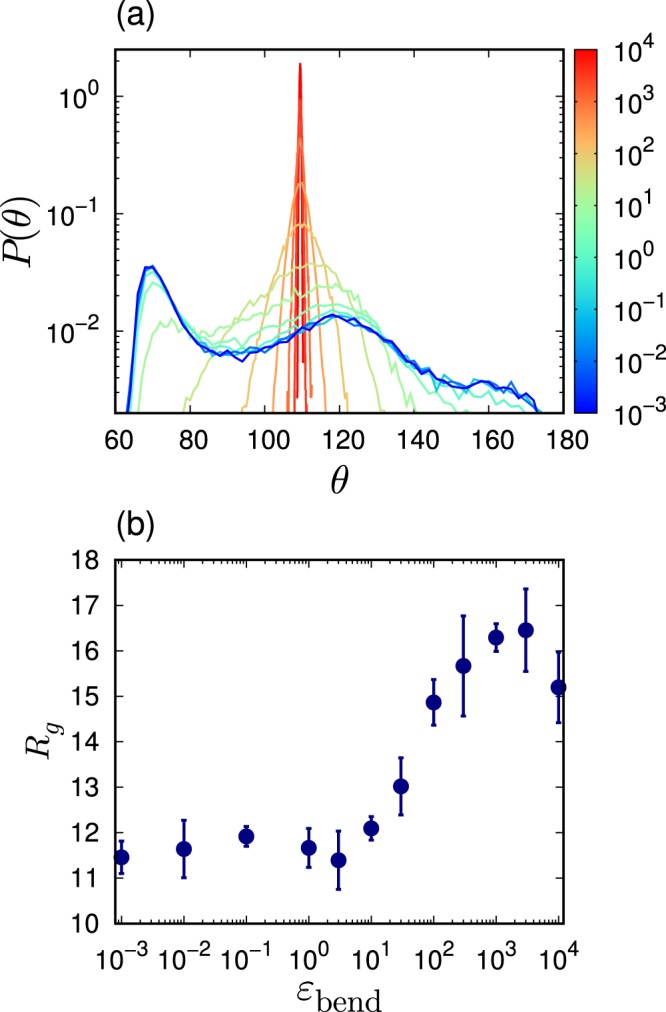
Conformation of polymeric chains. (a) Probability distribution of angle formed by three consecutive beads along the chain, , is presented for several different rigidities . The color of line indicates the value of bending rigidity according to the color bar. (b) Radius of inertia is plotted as a function of . The chain length is .
It is noted that the glass transition occurs at a lower temperature for than for , which is consistent with a previous report64. Correspondingly, the values of for becomes larger than that of . However, common results were observed between and 50 with respect to the dependences on the rigidity . Specifically, and , as well as the conformation of the polymeric chains progressively change when the rigidity increases from to , which also occurs for .
Elastic properties
The elastic properties of polymer glasses are studied by changing the strength of bending rigidity. An external strain is applied to the system at , which enables to measure the corresponding elastic moduli. Specifically, the volume-changing bulk deformation and the volume-conserving shear deformation are applied, which provide the bulk modulus and the shear modulus , respectively63. Figure 3 presents the values of and as functions of . Disordered systems exhibit large non-affine elastic responses2. The elastic moduli, and , are decomposed into affine moduli and non-affine moduli , i.e., 65–67. In Fig. 3, these affine and non-affine components are also presented.
Figure 3.

Elastic properties of polymeric glasses. Plots of the bulk modulus [(a,b) upper panels] and the shear modulus [(c,d) bottom panels] as functions of the strength of bending rigidity . The chain length is [(a),(c) left panels] and [(b,d) right panels]. In the figures, we also plot the affine moduli, and , and the non-affine moduli, and . The horizontal arrows indicate the values, and , of atomic LJ glasses that are extracted from ref. 63.
First, the bulk modulus is analyzed for and presented Fig. 3a. The affine component decreases from to 130 as changes from 1 to . The reduction of is caused by the decrease of the density with the increasing (see Fig. 1b). In contrast, the non-affine component shows a non-monotonic dependence on the . In particular, slightly increases from to 30, which is induced by the decrease of the density . As is further increased above , decreases. This is because the non-affine relaxation process is constrained due to the large rigidity of . As a result, the total modulus of also presents a non-monotonic behavior, which is demonstrated in Fig. 3a. From to , decreases from to 60, which is caused by the reduction of . Moreover, increases from to 65 above , which is caused by the reduction of . Therefore, the dependence of the bulk modulus is determined by the competition between the density reduction and the increase in the bending rigidity.
Further, the shear modulus is analyzed for and presented Fig. 3c. We note that a non-monotonic behavior of the shear modulus as a function of bending stiffness is observed in the previous study60. Figure 3c demonstrates that the bending rigidity strongly affects the shear modulus compared to the bulk modulus. Particularly, above , both of the affine and non-affine components considerably increase. As the shear deformation is anisotropic and causes deformations of the angles of polymeric chains, its response is expected to be highly affected by the bending rigidity. Interestingly, contrary to the important increases of and , the total shear modulus shows a low variation (by comparing with at ). The bending rigidity increases the affine shear modulus but, at the same time, the non-affine component also increases to cancel the increase in , and as a result, the total shear modulus presents a low increase. The elasticity of the shear deformation is therefore different from that of the bulk deformation, which is obvious when the elastic moduli are decomposed into affine and non-affine components.
Figure 3 also shows in (b) and in (d) for . The values of and of are smaller than those of , due to the bonding energy, , connecting the monomers along the polymeric chains. The responses of and to the variation of are also weaker for . However, and , as well as affine and and non-affine and , exhibit overall common dependences on between and 50. Therefore, the decrease in and increase in engenders similar effects on the elasticity for and 50.
Finally, it is remarked that the polymer glasses present larger non-affine elastic components than the atomic (LJ) glasses63,68. Even under an isotropic bulk deformation, the non-affine ( for and for , at ) is approximately half of the magnitude of the affine ( for and for , at ). This result is different from that of the LJ glasses, where a negligible value of (whereas ) was obtained63. Larger non-affine moduli reflect various elastic responses due to the multiple degrees of conformations in polymeric chains. Therefore, the non-affine deformation process must be considered to characterize the elastic property of polymeric systems. Interestingly, ref. 69 has reported that non-affine displacements also play an important role on melting of amorphous polymers.
Low-frequency vibrational spectra
Reduced vDOS
Finally, the spectra of vibrational eigenmodes in polymer glasses are studied. The vibrational mode analysis is performed on the configuration of the polymeric system at , which corresponds to the inherent structure71,72. The Hessian matrix is diagonalized to obtain the eigenfrequencies that corresponds to the square root of the eigenvalues , i.e., (). The specific expression of the Hessian matrix is given in Supplementary Material.
The statistics of the eigenfrequency provide the vDOS, . Figure 4 presents the reduced version of the vDOS, , when changing the rigidity and for in (a) and in (b). The reduced vDOS, , of the Debye theory is the so-called Debye level 71,72. is calculated from the elastic moduli, and , as follows: , where is the Debye frequency defined as , and and are the longitudinal and transverse sound speeds, respectively. Figure 5 presents the values of and as functions of . As the bulk modulus is approximately four times larger than the shear modulus, and are mostly determined with the shear modulus, i.e, and .
Figure 4.

Low-frequency vibrational spectra. We plot the vDOS divided by , i.e., the reduced vDOS , with changing the strength of bending rigidity . The chain length is (a) and (b) . The horizontal lines indicate the Debye level . The color of line indicates the value of bending rigidity according to the color bar. Black lines present value of the LJ glass which is taken from ref. 70.
Figure 5.
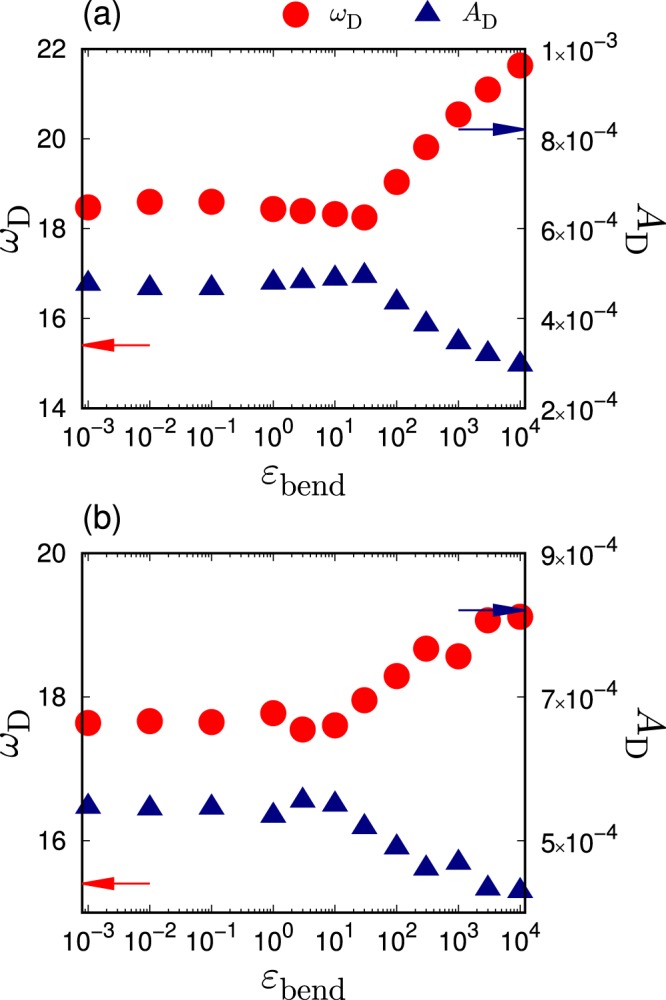
Debye frequency and Debye level. Plots of the Debye frequency (circles) and the Debye level (triangles) as functions of the strength of bending rigidity . The chain length is (a) and (b) . The values of and are calculated from the elastic moduli of and that are presented in Fig. 3. The arrows indicate values of atomic LJ glasses that are taken from ref. 70.
As shown in Fig. 4, the polymer glasses present clear excess peaks over the Debye level, i.e., the BP. The BP frequency, , is defined as the frequency at which is maximal. As increases, shifts to a higher frequency. In addition, the height of the reduced vDOS, , becomes lower. These behaviors of BP are consistent with the previous observation61. These shifts are observed in the region from to for and 3. Importantly, this region corresponds to the shear modulus variations, as shown in Fig. 3c,d. As the bulk modulus is much larger than the shear modulus, the bulk modulus should only have minor effects on the low-frequency spectra. Therefore, the BP of the proposed system should only be controlled by the shear elasticity.
To confirm this hypothesis, the scaled vDOS is plotted as a function of the scaled frequency and presented in Fig. 6. As discussed above, and are determined mostly by the shear modulus . Although deviations are observed, the scaled vDOSs collapse for different values of . This result indicates that the effects engendered by the bending rigidity on the low-frequency spectra are comprised of the the shear modulus changes. A same collapse was observed in effects of pressure on the BP in the covalent-bonding network glass (NaFeSiO)6. In addition, a previous experiment20 demonstrated that the effects of the polymerization are also comprised by the macroscopic elasticity changes. The collapsed results for (a) and (b) are consistent with the experimental observation.
Figure 6.
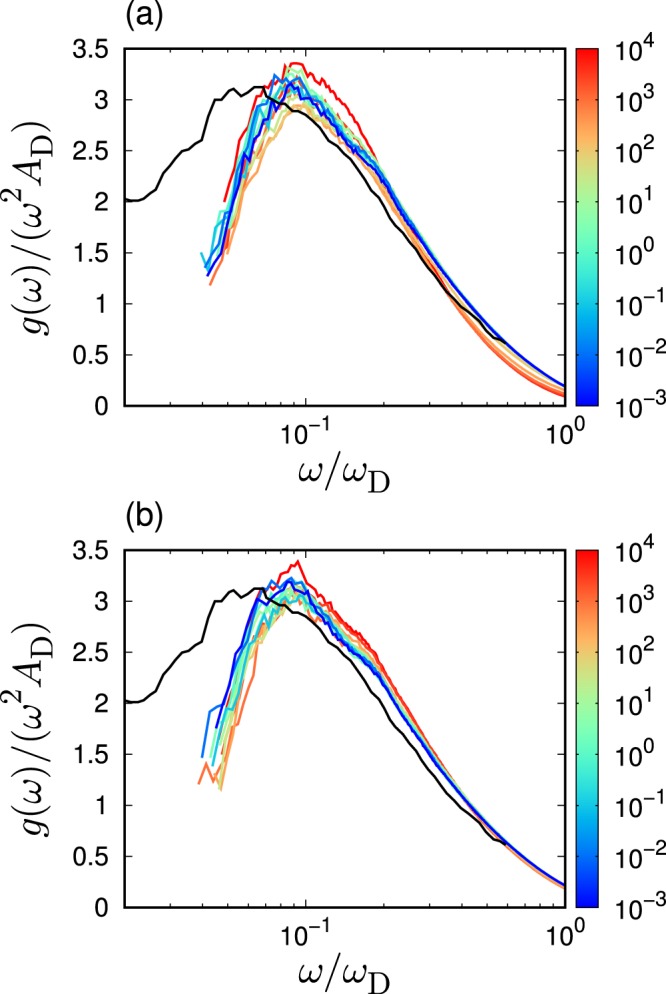
Scaled vibrational spectra. We present the data presented in Fig. 4, in the scaled form: we scale the reduced vDOS and the frequency by the Debye level and the Debye frequency . Here the values of and are presented in Fig. 5. The chain length is (a) and (b) . The color of line indicates the value of bending rigidity according to the color bar. Black lines present value of the LJ glass which is taken from ref. 70.
The collapses observed in Fig. 6 indicates that does not depend on . As stated previously, when varies, . As varies in a range of 15%, as shown in Fig. 1, the effect of on is weak. Thus, is approximately proportional to , which leads to in the variation of . The dependence of the BP frequency is determined by the shear modulus, which is a macroscopic quantity describing the entire system in an averaged manner. According to the heterogeneous elasticity theory24–26, the spatial fluctuations of the local shear modulus control nature of the BP. The value of is quantified by the standard deviation of probability distribution function of the local shear modulus63. The collapse of as a function of indicates that the shear modulus fluctuations relative to the macroscopic value, , are constant for all the cases of different bending rigidities. Therefore, the results of this study can be explained as follows. The increase in bending rigidity does not affect the shear modulus fluctuations (relative to the macroscopic moduli) but only affects the macroscopic shear modulus, which leads to the collapse of the scaled vDOS. Furthermore, it is also noted that the recent theoretical study explains the origin of BP in both crystals and glasses in terms of the competition between elastic phonon propagation and diffusive damping33. The model based on the phonon Green's function leads to the result . This necessitates further investigations regarding the effects of on phonon transport and the phonon's Green function.
Participation ratio
To further study the vibrational eigenstates, the participation ratio that measures the extent of localization of the eigenmodes is calculated as follows34,35:
| 1 |
where are the eigenvectors associated with the eigenfrequencies ( is the index of the monomer particle and is the number of monomer particles). The represents the displacements of each monomer bead in the eigenmode . It is noted that is obtained from the diagonalization of the Hessian matrix and is orthonormalized as ( is the Kronecker delta). The following extreme cases can occur: for an ideal sinusoidal plane wave, for an ideal mode in which all constituent particles vibrate equally, and for a perfect localization, which indicates that each vibrational state is associated only with a single atom and that for a single , otherwise .
Figure 7 presents the value of as a function of the scaled frequency , for different . It is noted that the presented data are the binned average values. Below the BP frequency , progressively decreases when decreases due to the spatially localized vibrations. The low-frequency localization below has also been observed in multiple glasses34,35,48,49. Importantly, below collapses between different values of . This result indicates that the variations of not only the vDOS and the vibrational states due to can be characterized by the macroscopic shear modulus changes. However, does not collapse above , as also shown in Fig. 7. This result is attributed to the fact that the high-frequency modes above reflect microscopic vibrations that cannot be captured by the macroscopic elasticity.
Figure 7.
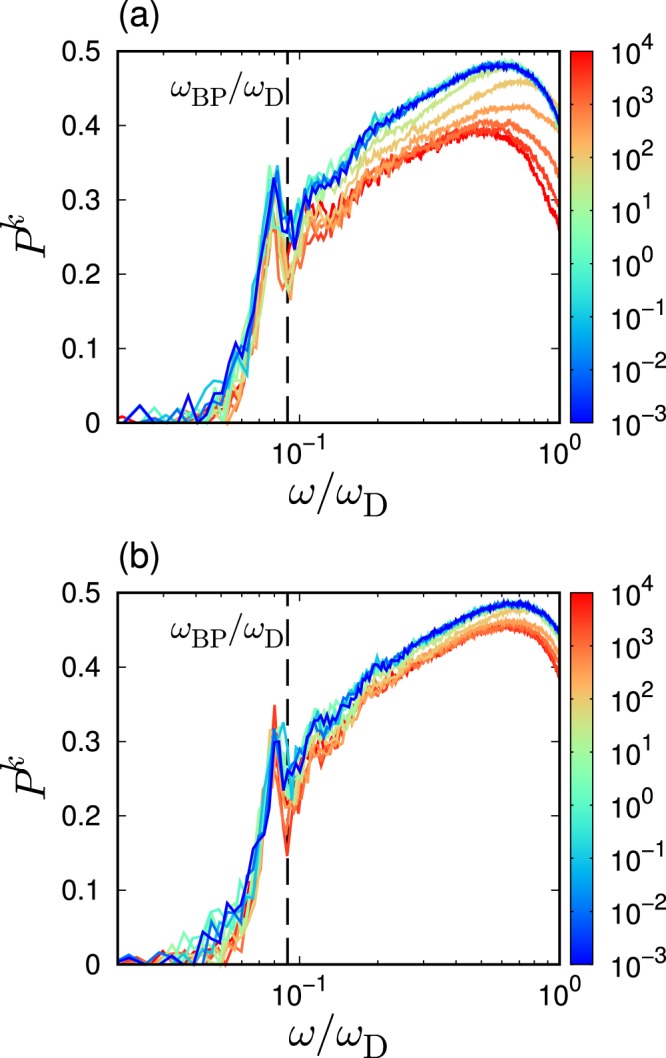
Localization nature of vibrational states. Plots of participation ratio as a function of the scaled frequency , for several different bending rigidities of . The chain length is (a) and (b) . The color of line indicates the value of bending rigidity according to the color bar. Data are shown as the average values over bins in the frequency domain of with . The vertical line indicates the position of averaged over the examined systems with varied .
Comparison with LJ glasses
The low-frequency spectra are comparable to that of atomic LJ glasses reported in ref. 70. As observed in Fig. 4, the height of of LJ glasses is higher than that of polymer glasses, and is lower than that of polymer glasses. These observations are different from the study reported in ref. 62, which demonstrated that the low-frequency spectra of polymer glasses correspond to those atomic LJ glasses. In ref. 62, the bonded monomers interact via a harmonic potential with a large bonding energy scale of . This value is two orders of magnitude larger than , investigated in this study. With respect to the large bonding energy, the rigidity of the polymeric chains has a smaller effect on the low-frequency spectra. Therefore, the low-frequency spectra are mainly determined by the non-bonding LJ interactions, whereas the elasticity is mainly determined mainly by the bonding rigidity. As a results, the BP decouples with the macroscopic elasticity, as demonstrated in the previous study62.
In contrast to the the results presented in ref. 62, the rigidity of the polymeric chains is necessary to determine the elasticity and the low-frequency spectra with respect to the bonding energy scale of . In fact, the reduces the height of , as shown in Fig 4. In this case, the BP couples with the macroscopic elasticity. However, the plot of the scaled as a function of does not collapse between the polymer glasses and LJ glass, as shown in Fig. 6. The height of is consistent between the polymer glasses and LJ glass, but of the LJ glass is lower than that of the polymer glasses. This result indicates that vibrational states differences between polymer glasses and LJ glasses cannot be described only by changes in macroscopic elasticity, changes in the local elastic properties should be considered as well6,18,19,38.
Here we make a note on the finite system size effects. We consider that the present system size of is not enough large to sample the low frequency modes below the BP. The previous work on the LJ glass70 employed the very large system size up to to study the low frequency regime without any system size effect. In contrast, our results of polymer glass for the region below the BP are affected by finite system size effects. However, the system size of is enough large to study the vibrational modes in the BP. Indeed, we confirm that our results in the BP regime are not contaminated by the size effects. Thus, as long as we discuss on the BP, we do not need to care for the system size effects.
In addition, the length scale of collective vibrational modes in the BP region is discussed. For atomic LJ glasses, the length scale was evaluated as , which corresponds to the size of approximately 23 particle68. This length scale diverges near the isostatic point or the marginally stable point, theoretically27–30 as well as numerically41,46,47,73,74. The present study evaluates the length scale of collective vibrational modes in polymeric glasses as , which corresponds to half of that for LJ glasses. The vibrational modes in the BP region are more localized nature due to the polymerization. Moreover, the value of is independent of the bending rigidity because of . In other words, the bending rigidity does not affect the length scale of the collective vibrational motions in the BP region.
Discussion
The glass transition temperature, elastic properties, and the low-frequency vibrational spectra were studied in polymeric glasses. In particular, the bending energy scale was highly varied for long chains () and short chains (). As the system becomes rigid by increasing the bending rigidity, the glass transition occurs at a higher temperature, leading to a lower density in the glass phase. The lowering density directly affects the isotropic bulk deformation, but does not affect the shear elasticity. The shear elasticity is mainly controlled by the bending rigidity. The non-affinity of polymeric glasses is much larger than that of atomic LJ glasses. This is due to the more complex conformational relaxations of the polymeric chains during non-affine deformation. Even under an isotropic elastic deformation, the non-affine relaxation process should be considered to describe the elastic response.
In addition, it is demonstrated that the BP frequency ωBP and its intensity are simply scaled by the Debye frequency ωD and the Debye level AD which are mainly determined by the macroscopic shear modulus G. This result indicates that the BP is controlled by macroscopic shear modulus and that the bending rigidity has a small impact on heterogeneities of local elasticity properties. The effects of the bending rigidity on the BP is similar to that of the polymerization, which has also been explained by macroscopic elasticity changes20.
The presented results provide a simple relationship between the BP and the elasticity as well as the glass transition temperature. As the system becomes more rigid by increasing the bending rigidity, the glass transition temperature Tg and the shear modulus G are increased. On the contrary, the bulk modulus decreases due to the decrease in the density caused by the increase in the glass transition temperature . However, the BP is mainly determined by the shear modulus : . Therefore, the glass transition temperature, the shear elasticity, and the BP frequency are positively correlated. A similar relationship between and was observed experimentally in ionic liquids systems75 and also numerically in LJ glasses76. It is noted that the studies of refs. 75,76 provided the relationship of , but a clear power-law like relationship between and was not observed in polymeric glasses.
Finally, it is worthwhile to discuss the relationship between structural relaxation above the glass transition temperature and the elastic properties. In fact, there have been proposed the shoving model, which characterizes the activation energy of the structural relaxation time in terms of the shear modulus 77,78. In the literature, a recent study79 has demonstrated the scaling relationship between the structural relaxation time and the Debye-Waller factor as (where are constants) for multiple glass-forming liquids including polymeric glasses. Here, the Debye-Waller factor in the harmonic approximation80 is estimated as . It is naturally expected that the relaxation dynamics become drastically slow by increasing the bending rigidity because of the following relationship:
| 2 |
where are constants. This simple relationship demonstrates that the BP below and the structural relaxation above are well correlated in the polymeric glasses with varying the bending rigidity. Further work is necessary to evaluate its validity by calculating , despite the equation analogous to Eq. (2) has empirically been proposed from MD simulations of polymeric glasses81.
Methods
Coarse-grained MD simulations are performed by using the Kremer–Grest model82, which treats polymer chains as linear series of monomer beads (particles) of mass . Each polymer chain is composed of monomer beads, and two cases are considered in this study: long chain length with and short chain length with . In a three-dimensional cubic simulation box under periodic boundary conditions, and 4998 is defined as the total number of monomers for and respectively, which means that the number of polymeric chains is for and 1666 for .
The polymer chain is modeled by three types of inter-particle potentials as follows. Firstly, all the monomer particles interact via the LJ potential:
| 3 |
where is the distance between two monomers, is the diameter of monomer, and is the energy scale of the LJ potential. The LJ potential is truncated at the cut-off distance of , where the potential and the force (first derivative of the potential) are shifted to zero continuously70. Throughout this study, the mass, length, and energy scales are measured in units of , , , respectively. The temperature is measured by ( is the Boltzmann constant). Secondly, sequential monomer-beads along the polymeric chain are connected by the FENE potential:
| 4 |
where is the energy scale of the FENE potential, and is the maximum length of the FENE bond. Their values are defined as and , according to ref. 61. Finally, three consecutive monomer beads along the chain interact via the bending potential defined as follows:
| 5 |
where is the angle formed by three consecutive beads, and is the associated energy scale. This potential intends to stabilize the angle at that we set as . Here, the value of in a wide range from to , and the effects of the bending rigidity on the vibrational and mechanical properties of the polymeric system are studied.
MD simulations are performed by using the Large-scale Atomic/Molecular Massively Parallel Simulator (LAMMPS)83. The polymeric system is first equilibrated in the melted, liquid state at a temperature . Further, the system is cooled down under a fixed pressure condition of and with a cooling rate of . During the cooling process, the glass transition occurs at a particular temperature, i.e., the glass transition temperature. After the glass transition, the system is quenched down towards the zero temperature, i.e., state.
Supplementary information
Acknowledgements
The authors thank Atsushi Ikeda for useful discussions and suggestions. This work was supported by JSPS KAKENHI Grant Numbers: JP19K14670 (H.M.), JP17K14318 (T.M.), JP18H04476 (T.M.), JP18H01188 (K.K.), JP15K13550 (N.M.), and JP19H04206 (N.M.). This work was also partially supported by the Asahi Glass Foundation and by the Post-K Supercomputing Project and the Elements Strategy Initiative for Catalysts and Batteries from the Ministry of Education, Culture, Sports, Science, and Technology. The numerical calculations were performed at Research Center of Computational Science, Okazaki Research Facilities, National Institutes of Natural Sciences, Japan.
Author contributions
H.M., K.K. and N.M. designed and supervised the project; T.N. performed numerical simulations; and all authors discussed the results and wrote the manuscript.
Data availability
The data supporting the findings of this study are available from the corresponding authors upon reasonable request.
Competing interests
The authors declare no competing interests.
Footnotes
Publisher’s note Springer Nature remains neutral with regard to jurisdictional claims in published maps and institutional affiliations.
Contributor Information
Hideyuki Mizuno, Email: hideyuki.mizuno@phys.c.u-tokyo.ac.jp.
Kang Kim, Email: kk@cheng.es.osaka-u.ac.jp.
Nobuyuki Matubayasi, Email: nobuyuki@cheng.es.osaka-u.ac.jp.
Supplementary information
is available for this paper at 10.1038/s41598-019-55564-2.
References
- 1.Phillips, W.A. (ed.) Amorphous Solids: Low-Temperature Properties, vol. 24 of Topics in Current Physics (Springer, Berlin, Heidelberg, 1981).
- 2.Alexander S. Amorphous solids: their structure, lattice dynamics and elasticity. Phys. Rep. 1998;296:65–236. doi: 10.1016/S0370-1573(97)00069-0. [DOI] [Google Scholar]
- 3.Zeller RC, Pohl RO. Thermal Conductivity and Specific Heat of Noncrystalline Solids. Phys. Rev. B. 1971;4:2029–2041. doi: 10.1103/PhysRevB.4.2029. [DOI] [Google Scholar]
- 4.Buchenau U, Nucker N, Dianoux AJ. Neutron Scattering Study of the Low-Frequency Vibrations in Vitreous Silica. Phys. Rev. Lett. 1984;53:2316–2319. doi: 10.1103/PhysRevLett.53.2316. [DOI] [Google Scholar]
- 5.Nakayama T. Boson peak and terahertz frequency dynamics of vitreous silica. Rep. Prog. Phys. 2002;65:1195–1242. doi: 10.1088/0034-4885/65/8/203. [DOI] [Google Scholar]
- 6.Monaco A, et al. Effect of Densification on the Density of Vibrational States of Glasses. Phys. Rev. Lett. 2006;97:135501. doi: 10.1103/PhysRevLett.97.135501. [DOI] [PubMed] [Google Scholar]
- 7.Baldi G, Giordano VM, Monaco G, Ruta B. Sound Attenuation at Terahertz Frequencies and the Boson Peak of Vitreous Silica. Phys. Rev. Lett. 2010;104:195501. doi: 10.1103/PhysRevLett.104.195501. [DOI] [PubMed] [Google Scholar]
- 8.Chumakov AI, et al. Equivalence of the Boson Peak in Glasses to the Transverse Acoustic van Hove Singularity in Crystals. Phys. Rev. Lett. 2011;106:225501. doi: 10.1103/PhysRevLett.106.225501. [DOI] [PubMed] [Google Scholar]
- 9.Yamamuro O, et al. Inelastic neutron scattering study of low energy excitations in glassy 1-butene. J. Chem. Phys. 1996;105:732–737. doi: 10.1063/1.471928. [DOI] [Google Scholar]
- 10.Ramos MA, Talón C, Jiménez-Riobóo RJ, Vieira S. Low-temperature specific heat of structural and orientational glasses of simple alcohols. J. Phys.: Condens. Matter. 2003;15:S1007–S1018. [Google Scholar]
- 11.Monaco G, Giordano VM. Breakdown of the Debye approximation for the acoustic modes with nanometric wavelengths in glasses. Proc. Natl. Acad. Sci. U.S.A. 2009;106:3659–3663. doi: 10.1073/pnas.0808965106. [DOI] [PMC free article] [PubMed] [Google Scholar]
- 12.Shibata T, Mori T, Kojima S. Low-frequency vibrational properties of crystalline and glassy indomethacin probed by terahertz time-domain spectroscopy and low-frequency Raman scattering. Spectrochim. Acta A. 2015;150:207–211. doi: 10.1016/j.saa.2015.05.059. [DOI] [PubMed] [Google Scholar]
- 13.Kabeya M, et al. Boson peak dynamics of glassy glucose studied by integrated terahertz-band spectroscopy. Phys. Rev. B. 2016;94:224204. doi: 10.1103/PhysRevB.94.224204. [DOI] [Google Scholar]
- 14.van den Berg R, Grondey S, Kästner J, Löhneysen HV. Low temperature thermal properties of amorphous Mg Zn. Solid State Commun. 1983;47:137–140. doi: 10.1016/0038-1098(83)90625-7. [DOI] [Google Scholar]
- 15.Li Y, Yu P, Bai HY. Study on the boson peak in bulk metallic glasses. J. Appl. Phys. 2008;104:013520. doi: 10.1063/1.2948926. [DOI] [Google Scholar]
- 16.Bruna P, et al. Acoustic properties of metallic glasses in the mesoscopic regime by inelastic X-ray scattering. J. Alloys Compd. 2011;509:S95–S98. doi: 10.1016/j.jallcom.2010.09.065. [DOI] [Google Scholar]
- 17.Huang B, Bai HY, Wang WH. Relationship between boson heat capacity peaks and evolution of heterogeneous structure in metallic glasses. J. Appl. Phys. 2014;115:153505. doi: 10.1063/1.4871676. [DOI] [Google Scholar]
- 18.Niss K, et al. Influence of Pressure on the Boson Peak: Stronger than Elastic Medium Transformation. Phys. Rev. Lett. 2007;99:055502. doi: 10.1103/PhysRevLett.99.055502. [DOI] [PubMed] [Google Scholar]
- 19.Hong L, et al. Pressure and density dependence of the boson peak in polymers. Phys. Rev. B. 2008;78:134201. doi: 10.1103/PhysRevB.78.134201. [DOI] [Google Scholar]
- 20.Caponi S, et al. Effect of polymerization on the boson peak, from liquid to glass. J. Non-Cryst. Solids. 2011;357:530–533. doi: 10.1016/j.jnoncrysol.2010.06.069. [DOI] [Google Scholar]
- 21.Pérez-Castañeda T, Jiménez-Riobóo RJ, Ramos MA. Two-Level Systems and Boson Peak Remain Stable in 110-Million-Year-Old Amber Glass. Phys. Rev. Lett. 2014;112:165901. doi: 10.1103/PhysRevLett.112.165901. [DOI] [PubMed] [Google Scholar]
- 22.Terao W, et al. Boson peak dynamics of natural polymer starch investigated by terahertz time-domain spectroscopy and low-frequency Raman scattering. Spectrochim. Acta A. 2018;192:446–450. doi: 10.1016/j.saa.2017.11.051. [DOI] [PubMed] [Google Scholar]
- 23.Zorn R, et al. Anomalies in the low frequency vibrational density of states for a polymer with intrinsic microporosity - the Boson peak of PIM-1. Phys. Chem. Chem. Phys. 2018;20:1355–1363. doi: 10.1039/C7CP07141H. [DOI] [PubMed] [Google Scholar]
- 24.Schirmacher W. Thermal conductivity of glassy materials and the "boson peak". EPL. 2006;73:892–898. doi: 10.1209/epl/i2005-10471-9. [DOI] [Google Scholar]
- 25.Schirmacher W, Ruocco G, Scopigno T. Acoustic Attenuation in Glasses and its Relation with the Boson Peak. Phys. Rev. Lett. 2007;98:025501. doi: 10.1103/PhysRevLett.98.025501. [DOI] [PubMed] [Google Scholar]
- 26.Schirmacher W, Scopigno T, Ruocco G. Theory of vibrational anomalies in glasses. J. Non-Cryst. Solids. 2015;407:133–140. doi: 10.1016/j.jnoncrysol.2014.09.054. [DOI] [Google Scholar]
- 27.Wyart M, Nagel SR, Witten TA. Geometric origin of excess low-frequency vibrational modes in weakly connected amorphous solids. EPL. 2005;72:486–492. doi: 10.1209/epl/i2005-10245-5. [DOI] [Google Scholar]
- 28.Wyart M, Silbert LE, Nagel SR, Witten TA. Effects of compression on the vibrational modes of marginally jammed solids. Phys. Rev. E. 2005;72:051306. doi: 10.1103/PhysRevE.72.051306. [DOI] [PubMed] [Google Scholar]
- 29.Wyart M. Scaling of phononic transport with connectivity in amorphous solids. EPL. 2010;89:64001. doi: 10.1209/0295-5075/89/64001. [DOI] [Google Scholar]
- 30.DeGiuli E, Laversanne-Finot A, Düring G, Lerner E, Wyart M. Effects of coordination and pressure on sound attenuation, boson peak and elasticity in amorphous solids. Soft Matter. 2014;10:5628–5644. doi: 10.1039/C4SM00561A. [DOI] [PubMed] [Google Scholar]
- 31.Milkus R, Zaccone A. Local inversion-symmetry breaking controls the boson peak in glasses and crystals. Phys. Rev. B. 2016;93:094204. doi: 10.1103/PhysRevB.93.094204. [DOI] [Google Scholar]
- 32.Krausser J, Milkus R, Zaccone A. Non-affine lattice dynamics of defective fcc crystals. Soft Matter. 2017;13:6079–6089. doi: 10.1039/C7SM00843K. [DOI] [PubMed] [Google Scholar]
- 33.Baggioli M, Zaccone A. Universal Origin of Boson Peak Vibrational Anomalies in Ordered Crystals and in Amorphous Materials. Phys. Rev. Lett. 2019;122:145501. doi: 10.1103/PhysRevLett.122.145501. [DOI] [PubMed] [Google Scholar]
- 34.Schober HR, Oligschleger C. Low-frequency vibrations in a model glass. Phys. Rev. B. 1996;53:11469–11480. doi: 10.1103/PhysRevB.53.11469. [DOI] [PubMed] [Google Scholar]
- 35.Mazzacurati V, Ruocco G, Sampoli M. Low-frequency atomic motion in a model glass. EPL. 1996;34:681–686. doi: 10.1209/epl/i1996-00515-8. [DOI] [Google Scholar]
- 36.Shintani H, Tanaka H. Universal link between the boson peak and transverse phonons in glass. Nat. Mater. 2008;7:870–877. doi: 10.1038/nmat2293. [DOI] [PubMed] [Google Scholar]
- 37.Monaco G, Mossa S. Anomalous properties of the acoustic excitations in glasses on the mesoscopic length scale. Proc. Natl. Acad. Sci. U.S.A. 2009;106:16907–16912. doi: 10.1073/pnas.0903922106. [DOI] [PMC free article] [PubMed] [Google Scholar]
- 38.Mizuno H, Mossa S, Barrat J-L. Elastic heterogeneity, vibrational states, and thermal conductivity across an amorphisation transition. EPL. 2013;104:56001. doi: 10.1209/0295-5075/104/56001. [DOI] [Google Scholar]
- 39.Lerner E, Düring G, Bouchbinder E. Statistics and Properties of Low-Frequency Vibrational Modes in Structural Glasses. Phys. Rev. Lett. 2016;117:035501. doi: 10.1103/PhysRevLett.117.035501. [DOI] [PubMed] [Google Scholar]
- 40.Wang L, et al. Low-frequency vibrational modes of stable glasses. Nat. Commun. 2019;10:26. doi: 10.1038/s41467-018-07978-1. [DOI] [PMC free article] [PubMed] [Google Scholar]
- 41.Silbert LE, Liu AJ, Nagel SR. Vibrations and Diverging Length Scales Near the Unjamming Transition. Phys. Rev. Lett. 2005;95:098301. doi: 10.1103/PhysRevLett.95.098301. [DOI] [PubMed] [Google Scholar]
- 42.Silbert LE, Liu AJ, Nagel SR. Normal modes in model jammed systems in three dimensions. Phys. Rev. E. 2009;79:021308. doi: 10.1103/PhysRevE.79.021308. [DOI] [PubMed] [Google Scholar]
- 43.Vitelli V, Xu N, Wyart M, Liu AJ, Nagel SR. Heat transport in model jammed solids. Phys. Rev. E. 2010;81:021301. doi: 10.1103/PhysRevE.81.021301. [DOI] [PubMed] [Google Scholar]
- 44.Xu N, Vitelli V, Liu AJ, Nagel SR. Anharmonic and quasi-localized vibrations in jammed solids–Modes for mechanical failure. EPL. 2010;90:56001. doi: 10.1209/0295-5075/90/56001. [DOI] [Google Scholar]
- 45.Mizuno H, Shiba H, Ikeda A. Continuum limit of the vibrational properties of amorphous solids. Proc. Natl. Acad. Sci. U.S.A. 2017;114:E9767–E9774. doi: 10.1073/pnas.1709015114. [DOI] [PMC free article] [PubMed] [Google Scholar]
- 46.Shimada M, Mizuno H, Wyart M, Ikeda A. Spatial structure of quasilocalized vibrations in nearly jammed amorphous solids. Phys. Rev. E. 2018;98:060901(R). doi: 10.1103/PhysRevE.98.060901. [DOI] [Google Scholar]
- 47.Mizuno H, Ikeda A. Phonon transport and vibrational excitations in amorphous solids. Phys. Rev. E. 2018;98:062612. doi: 10.1103/PhysRevE.98.062612. [DOI] [Google Scholar]
- 48.Taraskin S, Elliott S. Nature of vibrational excitations in vitreous silica. Phys. Rev. B. 1997;56:8605–8622. doi: 10.1103/PhysRevB.56.8605. [DOI] [Google Scholar]
- 49.Taraskin S, Elliott S. Anharmonicity and localization of atomic vibrations in vitreous silica. Phys. Rev. B. 1999;59:8572–8585. doi: 10.1103/PhysRevB.59.8572. [DOI] [Google Scholar]
- 50.Horbach J, Kob W, Binder K. High frequency sound and the boson peak in amorphous silica. Eur. Phys. J. B. 2001;19:531–543. doi: 10.1007/s100510170299. [DOI] [Google Scholar]
- 51.Léonforte F, Tanguy A, Wittmer J, Barrat JL. Inhomogeneous Elastic Response of Silica Glass. Phys. Rev. Lett. 2006;97:055501. doi: 10.1103/PhysRevLett.97.055501. [DOI] [PubMed] [Google Scholar]
- 52.Beltukov YM, Fusco C, Parshin DA, Tanguy A. Boson peak and Ioffe-Regel criterion in amorphous siliconlike materials: The effect of bond directionality. Phys. Rev. E. 2016;93:023006. doi: 10.1103/PhysRevE.93.023006. [DOI] [PubMed] [Google Scholar]
- 53.Beltukov YM, Parshin DA, Giordano VM, Tanguy A. Propagative and diffusive regimes of acoustic damping in bulk amorphous material. Phys. Rev. E. 2018;98:023005. doi: 10.1103/PhysRevE.98.023005. [DOI] [PubMed] [Google Scholar]
- 54.Derlet PM, Maaß R, Löffler JF. The Boson peak of model glass systems and its relation to atomic structure. Eur. Phys. J. B. 2012;85:148. doi: 10.1140/epjb/e2012-20902-0. [DOI] [Google Scholar]
- 55.Fan Y, Iwashita T, Egami T. Evolution of elastic heterogeneity during aging in metallic glasses. Phys. Rev. E. 2014;89:062313. doi: 10.1103/PhysRevE.89.062313. [DOI] [PubMed] [Google Scholar]
- 56.Crespo D, Bruna P, Valles A, Pineda E. Phonon dispersion relation of metallic glasses. Phys. Rev. B. 2016;94:144205. doi: 10.1103/PhysRevB.94.144205. [DOI] [Google Scholar]
- 57.Brink T, Koch L, Albe K. Structural origins of the boson peak in metals: From high-entropy alloys to metallic glasses. Phys. Rev. B. 2016;94:224203. doi: 10.1103/PhysRevB.94.224203. [DOI] [Google Scholar]
- 58.Jain TS, de Pablo JJ. Influence of confinement on the vibrational density of states and the Boson peak in a polymer glass. J. Chem. Phys. 2004;120:9371–9375. doi: 10.1063/1.1689952. [DOI] [PubMed] [Google Scholar]
- 59.Schnell B, Meyer H, Fond C, Wittmer JP, Baschnagel J. Simulated glass-forming polymer melts: Glass transition temperature and elastic constants of the glassy state. Eur. Phys. J. E. 2011;34:97. doi: 10.1140/epje/i2011-11097-4. [DOI] [PubMed] [Google Scholar]
- 60.Ness C, et al. Nonmonotonic dependence of polymer-glass mechanical response on chain bending stiffness. Phys. Rev. E. 2017;96:030501(R). doi: 10.1103/PhysRevE.96.030501. [DOI] [PubMed] [Google Scholar]
- 61.Milkus R, et al. Interpretation of the Vibrational Spectra of Glassy Polymers Using Coarse-Grained Simulations. Macromolecules. 2018;51:1559–1572. doi: 10.1021/acs.macromol.7b02352. [DOI] [Google Scholar]
- 62.Giuntoli A, Leporini D. Boson Peak Decouples from Elasticity in Glasses with Low Connectivity. Phys. Rev. Lett. 2018;121:185502. doi: 10.1103/PhysRevLett.121.185502. [DOI] [PubMed] [Google Scholar]
- 63.Mizuno H, Mossa S, Barrat J-L. Measuring spatial distribution of the local elastic modulus in glasses. Phys. Rev. E. 2013;87:042306. doi: 10.1103/PhysRevE.87.042306. [DOI] [PubMed] [Google Scholar]
- 64.Durand M, Meyer H, Benzerara O, Baschnagel J, Vitrac O. Molecular dynamics simulations of the chain dynamics in monodisperse oligomer melts and of the oligomer tracer diffusion in an entangled polymer matrix. J. Chem. Phys. 2010;132:194902. doi: 10.1063/1.3420646. [DOI] [PubMed] [Google Scholar]
- 65.Tanguy A, Wittmer J, Leonforte F, Barrat JL. Continuum limit of amorphous elastic bodies: A finite-size study of low-frequency harmonic vibrations. Phys. Rev. B. 2002;66:174205. doi: 10.1103/PhysRevB.66.174205. [DOI] [Google Scholar]
- 66.Lemaître A, Maloney C. Sum Rules for the Quasi-Static and Visco-Elastic Response of Disordered Solids at Zero Temperature. J. Stat. Phys. 2006;123:415–453. doi: 10.1007/s10955-005-9015-5. [DOI] [Google Scholar]
- 67.Zaccone A, Scossa-Romano E. Approximate analytical description of the nonaffine response of amorphous solids. Phys. Rev. B. 2011;83:184205. doi: 10.1103/PhysRevB.83.184205. [DOI] [Google Scholar]
- 68.Leonforte F, Boissière R, Tanguy A, Wittmer J, Barrat JL. Continuum limit of amorphous elastic bodies. III. Three-dimensional systems. Phys. Rev. B. 2005;72:224206. [Google Scholar]
- 69.Zaccone A, Terentjev EM. Disorder-Assisted Melting and the Glass Transition in Amorphous Solids. Phys. Rev. Lett. 2013;110:178002. doi: 10.1103/PhysRevLett.110.178002. [DOI] [PubMed] [Google Scholar]
- 70.Shimada M, Mizuno H, Ikeda A. Anomalous vibrational properties in the continuum limit of glasses. Phys. Rev. E. 2018;97:022609. doi: 10.1103/PhysRevE.97.022609. [DOI] [PubMed] [Google Scholar]
- 71.Kittel, C. Introduction to Solid State Physics (John Wiley and Sons, New York, 2004), edition 8th edn.
- 72.Ashcroft, N. W. & Mermin, N. D. Solid State Physics (Harcourt College Publishers, New York, 1976).
- 73.Lerner E, DeGiuli E, Düring G, Wyart M. Breakdown of continuum elasticity in amorphous solids. Soft Matter. 2014;10:5085–5092. doi: 10.1039/c4sm00311j. [DOI] [PubMed] [Google Scholar]
- 74.Karimi K, Maloney CE. Elasticity of frictionless particles near jamming. Phys. Rev. E. 2015;92:022208. doi: 10.1103/PhysRevE.92.022208. [DOI] [PubMed] [Google Scholar]
- 75.Kofu M, et al. Inelastic neutron scattering study on boson peaks of imidazolium-based ionic liquids. J. Mol. Liq. 2015;210:164–168. doi: 10.1016/j.molliq.2015.07.021. [DOI] [Google Scholar]
- 76.Wang L, Xu N. Probing the Glass Transition from Structural and Vibrational Properties of Zero-Temperature Glasses. Phys. Rev. Lett. 2014;112:055701. doi: 10.1103/PhysRevLett.112.055701. [DOI] [PubMed] [Google Scholar]
- 77.Dyre JC. Source of non-Arrhenius average relaxation time in glass-forming liquids. J. Non-Cryst. Solids. 1998;235-237:142–149. doi: 10.1016/S0022-3093(98)00502-X. [DOI] [Google Scholar]
- 78.Dyre JC. Colloquium: The glass transition and elastic models of glass-forming liquids. Rev. Mod. Phys. 2006;78:953–972. doi: 10.1103/RevModPhys.78.953. [DOI] [Google Scholar]
- 79.Larini L, Ottochian A, De Michele C, Leporini D. Universal scaling between structural relaxation and vibrational dynamics in glass-forming liquids and polymers. Nat. Phys. 2008;4:42–45. doi: 10.1038/nphys788. [DOI] [Google Scholar]
- 80.Shiba H, Yamada Y, Kawasaki T, Kim K. Unveiling Dimensionality Dependence of Glassy Dynamics: 2D Infinite Fluctuation Eclipses Inherent Structural Relaxation. Phys. Rev. Lett. 2016;117:245701. doi: 10.1103/PhysRevLett.117.245701. [DOI] [PubMed] [Google Scholar]
- 81.Puosi F, Leporini D. Communication: Correlation of the instantaneous and the intermediate-time elasticity with the structural relaxation in glassforming systems. J. Chem. Phys. 2012;136:041104. doi: 10.1063/1.3681291. [DOI] [PubMed] [Google Scholar]
- 82.Kremer K, Grest GS. Dynamics of entangled linear polymer melts: A molecular-dynamics simulation. J. Chem. Phys. 1990;92:5057–5086. doi: 10.1063/1.458541. [DOI] [Google Scholar]
- 83.Plimpton S. Fast parallel algorithms for short-range molecular dynamics. J. Comput. Phys. 1995;117:1–19. doi: 10.1006/jcph.1995.1039. [DOI] [Google Scholar]
Associated Data
This section collects any data citations, data availability statements, or supplementary materials included in this article.
Supplementary Materials
Data Availability Statement
The data supporting the findings of this study are available from the corresponding authors upon reasonable request.