

SUMMARY
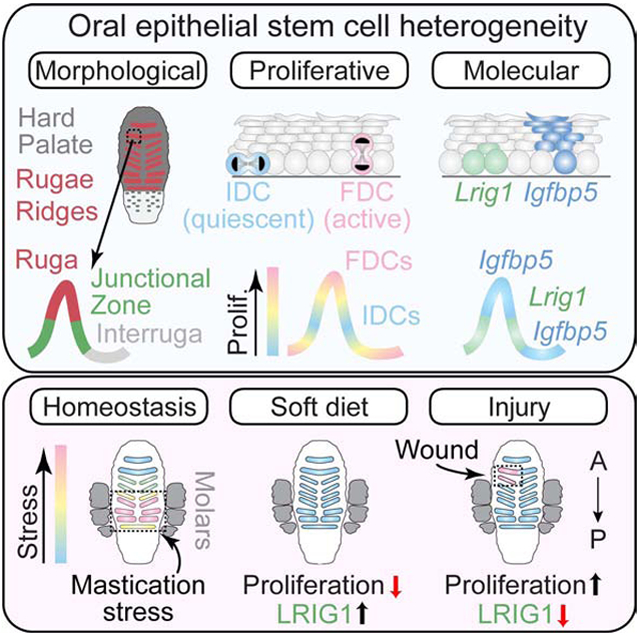
Stem cells in stratified epithelia are generally believed to adhere to a non-hierarchical single-progenitor model. Using lineage tracing and genetic label retention assays, we show that the hard palatal epithelium of the oral cavity is unique in displaying marked proliferative heterogeneity. We identify a previously uncharacterized, infrequently-dividing stem cell population that resides within a candidate niche, the junctional zone (JZ). JZ stem cells tend to self-renew by planar symmetric divisions, respond to masticatory stresses, and promote wound healing, while frequently-dividing cells reside outside the JZ, preferentially renew through perpendicular asymmetric divisions, and are less responsive to injury. LRIG1 is enriched in the infrequently-dividing population in homeostasis, dynamically changes expression in response to tissue stresses, and promotes quiescence, while Igfbp5 preferentially labels a rapidly-growing, differentiation-prone population. These studies establish the oral mucosa as an important model system to study epithelial stem cell populations and how they respond to tissues stresses.
Keywords: oral epithelium, stem cell, lineage tracing, label retention, tongue, palate, Lrig1, Igfbp5, diet, wound healing
Graphical Abstract:
eTOC
Byrd et al. show that stratified epithelia of the oral cavity display unusual proliferative heterogeneity, particularly in the hard palate region. A slow-cycling population residing in the junctional zone niche is LRIGHI, self-renews through planar symmetric divisions, responds to masticatory stress, and promotes wound healing.
INTRODUCTION
Epithelial stem cells must balance differentiation and self-renewal to build new tissues during development, maintain homeostasis, and repair after injury, and disequilibrium may result in stem cell depletion or cancer (Arwert et al., 2012; Hsu et al., 2014). Oral epithelia comprise highly proliferative, stratified squamous mucosa specialized for the varied functions of feeding, speech, barrier function, breathing, and early digestion. Oral epithelial stem cells (OESCs) reside within the proliferative basal layer while differentiating cells populate suprabasal (SB) layers (Papagerakis et al., 2014), although a recent study in revealed a differentiation gradient among basal layer cells (Jones et al., 2018). Understanding how this spectrum of stem-like to transit-amplifying states is regulated may shed light on why oral mucosa heal rapidly and with minimal scarring, even in the face of constant challenges from mastication and pathogen exposure (Iglesias-Bartolome et al., 2018; Jones and Klein, 2013).
In adult epidermis, differentiation occurs primarily via delamination, or detachment, of basal cells from the underlying basement membrane (Blanpain and Fuchs, 2009). However, particularly during development, both oral epithelial and epidermal basal cells can position their mitotic spindles perpendicular to the basement membrane to execute asymmetric cell divisions (ACDs), whereby the suprabasal daughter differentiates while the basal daughter continues to proliferate. Alternatively, basal cells can execute self-renewing symmetric cell divisions (SCDs) when they divide within the epithelial plane (Byrd et al., 2016; Lechler and Fuchs, 2005; Williams et al., 2011). However, in adult epidermis, planar divisions can be either symmetric or operationally asymmetric, when one basal daughter delaminates after mitosis (Clayton et al., 2007; Rompolas et al., 2016). Collectively, these and other studies report that nearly all divisions in adult stratified epithelia are planar (Ichijo et al., 2017; Ipponjima et al., 2016; Jones et al., 2018; Mesa et al., 2018), suggesting that perpendicular ACDs may be a developmental adaptation to promote rapid stratification.
The epidermis was originally proposed to consist of homogeneous clones—each containing a single asymmetrically dividing stem cell, surrounded by transit-amplifying cells—forming ordered columns called epidermal proliferative units (Potten, 1974). More recently, this “invariant asymmetry” model has been opposed by a “population asymmetry” model. Genetic lineage tracing and quantitative modeling have suggested that a single population of committed progenitors makes stochastic decisions to either self-renew or to differentiate (Clayton et al., 2007; Doupe et al., 2012; Jones et al., 2007; Klein and Simons, 2011). This leads to a phenomenon known as “neutral drift,” which makes several predictions of how clones evolve over time: 1) the number of stem cells per clone increases linearly, 2) clone sizes demonstrate “scaling” behavior, and 3) surviving clone fractions decrease in inverse proportion to the stem cell replacement rate (Klein and Simons, 2011). However, this single progenitor model has been challenged by evidence that both proliferative committed progenitor and more quiescent stem cell populations exist in the epidermis (Mascré et al., 2012; Sada et al., 2016).
Proliferative heterogeneity among OESCs was suggested by pulse-chase studies which showed that label retaining cells (LRCs) exist in the gingiva, tongue papillae, and palate (Asaka et al., 2009; Bickenbach, 1981; Bickenbach and Mackenzie, 1984; Willberg et al., 2006). However, a recent study utilizing lineage tracing and genetic label retention demonstrated that buccal epithelia adhere to a neutral drift model (Jones et al., 2018). Thus, whether regional OESC subpopulations exist, which markers define them, and whether they adhere to a single progenitor model remains largely unknown.
The leucine-rich repeats and immunoglobulin-like domains (Lrig) family of transmembrane proteins has emerged as key regulators of stem cell behavior due to their function in growth factor receptor regulation (Gur et al., 2004; Laederich et al., 2004). Lrig1 has been reported to label quiescent epithelial stem cell populations in the small intestine, stomach, hair follicle infundibulum, and labial cervical loop of the incisors (Choi et al., 2018; Jensen et al., 2009; Jensen and Watt, 2006; Page et al., 2013; Powell et al., 2012; Seidel et al., 2017). Lrig1−/− mice display regional epidermal hyperplasia, supporting the idea that Lrig1 negatively regulates proliferation (Suzuki et al., 2002). Lrig1 and other family members are expressed in the oral cavity (Jones et al., 2018), but little is known about their function.
Here, using lineage tracing, genetic label retention, and functional assays, we report striking OESC proliferative heterogeneity and provide evidence for the existence of a candidate niche within the junctional zone (JZ) of the hard palate (HP). We show that JZ OESCs display characteristics of stemness, including quiescence, self-renewal through planar oriented cell divisions, and Lrig1 enrichment. We demonstrate that OESCs are sensitive to both masticatory and wounding stresses, which impact tissue cycling/proliferation as well as Lrig1 expression. Finally, using RNA-seq and confirmatory lineage tracing, we identify two markers of HP heterogeneity. Lrig1 marks small, basal-rich JZ clones while Igfbp5 labels large suprabasal-rich clones located outside the JZ. Collectively, these data support the existence of regional OESC heterogeneity and provide early clues of niche-specific regulatory mechanisms.
RESULTS
The HP displays unique patterns of oriented cell divisions
During stratified epithelial development, basal progenitors execute a bimodal pattern of planar SCDs and perpendicular ACDs to balance self-renewal and differentiation (Byrd et al., 2016; Lu and Johnston, 2013; Morin and Bellaiche, 2011; Seldin and Macara, 2017). However, since virtually all divisions are reported to be planar in adult stratified epithelia, differentiation may be driven by delamination rather than ACDs. To explore whether patterns of division orientation vary across oral epithelia, we investigated three different tissues: 1) ventral tongue (VT), an ectodermal-derived mucosal epithelium; 2) hard palate (HP), an ectodermal-derived masticatory epithelium, and 3) oropharynx, an endodermal-derived mucosal epithelium (Figure 1A). Despite their differences in location and morphology, proliferation rates were similar among these tissues (Figure S1A-B). To characterize division orientation, we used Survivin (Figure 1B), which localizes to the cleavage furrow during telophase, when division axis commitment occurs (Williams et al., 2011). While all oral epithelia display a mix of planar and perpendicular divisions during development (Byrd et al., 2016), the majority of divisions in adult VT and oropharynx were planar. However, in HP, a bimodal distribution of perpendicular and planar divisions was observed (Figure 1C,D), making it the only adult stratified epithelium described where the majority of cell divisions (53%, n=137) remain perpendicular.
Figure 1 ∣. Palatal epithelium displays unique renewal properties.

(A) Sagittal section of adult oral cavity. (B) High magnification images of late stage mitotic cells in ventral tongue (VT), oropharynx (Oro) and hard palate (HP) used to characterize division orientation. Angles (yellow) calculated relative to basement membrane (dashed line). (C,D) Division orientation by region, displayed as radial histograms (C) and cumulative frequency plots (D). (E) Overview of short-term and long-term lineage tracing strategies, with examples of the four different clonal patterns observed, quantified in (F). (G) 1 month Krt14CreER lineage tracing showing representative clones (left), indicated by X’s in clonal density arrays (CDAs, right). Bounding box defines slow-growing latent clones, defined as containing ≤2 basal and suprabasal (SB) cells; % of total clones that are latent is indicated. HP1 represents a SB-rich clone; HP2 represents a latent clone. (H) Basal cells/clone for each region, quantified as dot plots. The % of total clones with one basal cell is indicated by the boxed region; blue bars indicate means. (I,J) Clone size (I) and clonal density (J) over time; HP clones grow most slowly and have the lowest extinction rates. **p<0.01, ***p<0.0001, by χ2 (C,F), Kolmogorov-Smirnov test (D), or Mann-Whitney test (H). Data in (I,J) are mean ± s.e.m. ACD, asymmetric cell division; SCD, symmetric cell division. Scale bars: 500 μm (A), 25 μm (G), 10 μm (B,E); n values in (B,G) indicate cells and (animals/biological replicates); in (F,H-J), n = 3-5 animals per group per timepoint. See also Figure S1.
Short-term lineage tracing reveals regional patterns of renewal
To determine the relative contributions of ACDs, SCDs and delamination to differentiation during OE homeostasis, we performed short-term (24h, 36h and 48h) lineage tracing using a tamoxifen-inducible, basal layer-specific Krt14CreER transgenic crossed to a multi-fluorophore reporter (LSL-Confetti). We assumed that: 1) two-cell clones consisting of one basal and one SB cell divided by perpendicular ACD; 2) two-basal cell clones divided by planar SCD; 3) single-basal cell clones had not divided, and 4) single-SB clones differentiated by delamination (Figure 1E). Confirming that they have similar overall proliferation rates, the fraction of clones that divided during a 24h labeling period was similar for all tissues (35% for HP; 34.6% for oropharynx; 38% for VT), although the HP showed a lower incidence of larger clones, particularly at 48h (Figure 1F; S1C). Since ~1/3 of all clones across tissues were single SB cells (Figure 1F), delamination is a significant driver of differentiation in oral epithelia. In agreement with the high proportion of planar divisions observed in VT and oropharynx, SCD clones outnumbered ACD clones in these tissues, while ACDs were more numerous than SCDs in HP, a result independently confirmed with a second K5CreER reporter line (Figure 1F). The strong correlation between division angles and clone types in each tissue strongly suggests that division orientation dictates cell fate, at least within this labeling period.
Long-term lineage tracing reveals unique properties of HP epithelium
Genetic lineage tracing represents a powerful means to determine how stem cell populations contribute to tissue growth and maintenance (Blanpain and Simons, 2013). To study regional growth dynamics in oral epithelia, we induced clones with a single dose of tamoxifen in Krt14CreER; LSL-Confetti mice, and harvested one month later. To display clone size distributions we created clonal density arrays (CDAs, Figure 1G), where basal and SB cells/clone are plotted on x and y axes, respectively, and darker colors represent higher frequencies. We used CDAs to define four clone subtypes (Figure S1D): 1) latent (≤2 B and SB cells/clone), 2) basal-rich (B:SB Ratio ≥3), 3) suprabasal-rich (SB:B ratio ≥3), and 4) balanced (all others).
Both VT and oropharynx favored balanced basal layer expansion and SB differentiation, similar to what was recently reported in buccal OE (Jones et al., 2018) and consistent with stochastic fate choices/neutral drift (Klein and Simons, 2011). However, HP frequently displayed perpendicularly oriented columns of cells with one or few basal cells (Figure 1G, HP1), with 50% of clones in the SB-rich subtype, compared to 10% and 6% in VT and oropharynx, respectively. In addition, latent clones (Figure 1G, HP2) were more numerous in HP (38%) compared to VT or oropharynx (10% and 8%, respectively), and 49% of HP clones consisted of a single basal cell, compared to 11% for VT and 23% for oropharynx (Figure 1H). Similar results were independently confirmed with the Krt5CreER reporter (Figure S1E,F). Collectively, these data suggest that a high percentage of HP clones utilize a unique renewal pattern of invariant ACDs during homeostasis.
To follow clonal growth dynamics and turnover, we extended our lineage tracing experiments out to 6 months. Consistent with neutral drift kinetics, all regions demonstrated a linear increase in basal cells/clone over time and a progressive decrease in surviving clone density (Figure 1I,J). Of note, however, HP displayed the slowest rate of increase in clone size over time, and the highest proportion of surviving clones at late timepoints (Figure S1G). Thus, despite having similar proliferation rates, HP clones grow slower and have an increased probability of survival compared to VT and oropharynx. Together, these findings suggest that the HP harbors unusual proliferative heterogeneity.
Slow-dividing OESCs are enriched in HP junctional zones, a candidate stem cell niche
The mammalian HP contains numerous rugae, which are mediolaterally-oriented, corrugated ridges thought to function together with the dorsal tongue in tactile sensation, bolus formation and speech articulation (Moayedi et al., 2018; Peterkova et al., 1987). Mice have between 8-9 rugae (R), subclassified into antemolar (R1-R3) and intermolar (R4-R8) based on their positions relative to the three maxillary teeth (Figure 2A,B). Ruga peaks are separated by valleys of flattened epithelium termed inter-rugae (IR).
Figure 2 ∣. Lineage tracing reveals regional clonal diversity within the HP.

(A,B) Illustration (A) and whole mount (B) of the hard palate (HP) pseudocolored to demonstrate rugae (R1-R8, red) and interrugae regions (IR). Area within dashed box magnified below. (C) 1 mo and 3 mo lineage tracing in Krt14CreER;LSL-confetti HP reveals different clone sizes among HP regions: rugae (R, red); junctional zone (JZ, green); interrugae (IR, white). K10 (red) labels suprabasal (SB) differentiated cells. (D,E) Representative images (D) and CDAs (E) of R, IR and JZ after 1 wk, 1 mo, and 3 mo chases. Arrows in (D) indicate small clones; boxed regions and percentages in (E) indicate latent clone frequency. (F) Plot of basal cells/clone over time for each region; JZ grows most slowly up to 6 mo. (G) Tukey box-and-whisker plots (+, mean) comparing SB cells/clone showing reduced differentiation in JZ compared to R. (H) Quantification of surviving clone location over time reveals that JZ clones tend to be more persistent and long-lived compared to IR and R clones. *p<0.05, **p<0.01, ***p<0.0001, by Mann-Whitney test (G) and χ2 (H). Scale bars: 500 μm (B); 100 μm (C), 50 μm (D); n values in (F-H) indicate number of biological replicates.
Interestingly, most long-lived HP clones localized to the slopes of palatal rugae, at R/IR junctions (Figure S1G). While the R and IR are delimited by molecularly distinct developmental programs (Welsh and O'Brien, 2009), no markers have been described to distinguish these regions in the adult. Therefore, we used morphological criteria (Figure 2C) to define the R region as the upper 50% of the ruga peaks; the IR region as the area between the inflection points of ruga slopes; and the junctional zone (JZ) as the lower 50% of the ruga slope, between the R and IR domains.
We employed CDAs to display clone distributions by location at 1 wk, 1 month, and 3 months (Figure 2D,E). R clones appeared to expand most rapidly and tended to be SB-rich, with ~1/3 of clones consisting of >10 basal cells and >12 SB cells at 3 months. Although less expansive than R clones, IR clones were mostly of the SB-rich and balanced types. Conversely, JZ clones displayed an unusual bifurcation of clonal behavior by 3 months (basal-rich and SB-rich both represented ~17%). While many clones consisted of 1-2 basal cells with multiple SB cells, consistent with invariant asymmetric expansion, a sizable minority of clones also expanded through SCDs with little differentiation (basal-rich + latent clone fraction = 41%). This behavior was uncommon in the R and IR (basal-rich + latent fraction = 0% for R and 26% for IR).
While basal cell numbers increased linearly with time in each region, the JZ also showed the lowest average number of basal cells/clone at all timepoints (Figure 2F). Moreover, the number of SB cells/clone was lowest in the JZ (Figure 2G), suggesting that they undergo comparatively less differentiation. Finally, in examining the location of surviving clones (Figure 2H), we noted that JZ clones persist, while R and IR clones are lost over time, demonstrating that JZ clones are long-lived. These data show that the JZ demonstrates unique growth behaviors and may be a stem cell niche for slow-dividing OESCs.
Label-retaining cells reside in discrete niches in the HP junctional zone
Label-dilution assays represent another means to assess proliferation kinetics and identify populations of relative quiescence. Genetically, this can be accomplished by using doxycycline (dox)-regulable bipartite “tet-off” transgenics (Krt5tTA; tetOH2B-GFP or K5-GFP; Figure 3A). During the pulse period, stable histone H2B-GFP expression is initiated in all K5+ stratified epithelia, beginning during embryogenesis. Subsequent dox administration initiates the chase period, where existing label is diluted with each cell division (Tumbar et al., 2004). Because of subtle differences in K5/K14 expression seen across OE (Figure S2A), we also took a parallel approach with Krt14Cre; LSLtTA; tetOH2B-GFP mice (K14-GFP), which we compared to the K5-GFP line (Figure 3B,C; S2B,C).
Figure 3 ∣. Label-retaining cells are found in palate but not other OE.

(A) Schematic of tet-off genetic label retention assay. Induction was achieved in OE using one of two promoters, Krt5 or Krt14, with similar results. (B) Whole mount images of H2B-GFP expression in unchased adult tongue and palate. VT, ventral tongue; DT, dorsal tongue; Oro, oropharynx. (C) H2B-GFP+ label-retaining cells (LRCs) following 0, 1, 2, and 4 wk chase periods in indicated regions for K5-GFP (top three rows) and K14-GFP (bottom row) transgenics. Far right, high magnification images of yellow, boxed regions at 4 wks with DAPI (blue) removed; arrowheads indicate pockets of LRCs. (D) Quantification of GFP fluorescent intensity by region following a 2 wk chase, binned into deciles. (E) Cumulative frequency plots of division orientation for GFPLO (gray) and GFPHI (green) HP cells from K5-GFP and K14-GFP mice, chased for 1 or 2 wks. GFPHI populations trend toward planar SCDs, while GFPLO favor perpendicular ACDs. n values indicate cells and (biological replicates). Scale bars: 500 μm (B), 100 μm (C). *p<0.05, **p<0.01, ***p<0.0001, by Kolmogorov-Smirnov test (D,E). See also Figure S2.
We first confirmed near-complete initial labeling (>95% of basal cells) of oral epithelia before chasing for 1, 2, or 4 weeks (wks, Figure 3B,C). In lingual epithelia (tongue and oropharynx), GFP was rapidly diluted by 1 wk and virtually absent by 2 wks, while in the HP, discrete pockets of GFP+ label-retaining cells (LRCs) remained (Figure 3C; S2B,C). Since post-mitotic sensory Merkel cells reside in palatal rugae (Moayedi et al., 2018), we used βIII-tubulin and p75/NGFR to label neuronal afferents, but observed no colocalization with GFP (Figure S2D). Although rare, GFP+ LRCs were still detectable in the HP at 4 wks using a GFP antibody, which enhanced the signal without altering label retention kinetics (Figure S2E). In palatal whole mounts, LRCs were consistently found in the JZ (Figure S2F), the same region where long-lived, basal-rich clones were observed (Figure S1G). Quantification of GFP intensity in K5-GFP mice chased for 2 wks confirmed highest levels of label retention in the JZ (Figure 3D).
Slow-cycling palatal LRCs self-renew through planar symmetric divisions
Since label dilution was nearly complete after a 4 wk chase, we believed that LRCs were not truly quiescent, but more accurately, infrequently dividing cells (IDCs). We utilized three markers—Ki67 (cycling cells), pHH3 (mitotic cells) and 5-Ethynyl-2´-deoxyuridine/EdU (S-phase entry)—to compare proliferation between GFPHI IDCs to GFPLO frequently dividing cells (FDCs). As expected, cells with the highest GFP expression were the least proliferative (Figure S2G-K). While GFPLO FDCs were occasionally double-positive for EdU and pHH3, indicative of more rapid progression from S-phase into G2/M, no double-positive GFPHI IDCs were observed (Figure S2L). We next asked whether IDCs and FDCs display distinct patterns of oriented cell divisions. In both K5-GFP and K14-GFP lines, GFPHI IDCs displayed a high proportion of planar SCDs, while GFPLO FDCs divided almost exclusively through perpendicular ACDs. These differences became more pronounced with longer chases (Figure 3E). Thus, IDCs are biased toward self-renewal while FDCs exhibit a propensity for differentiation.
IDCs are mobilized by symmetric expansion during wound healing
OE are remarkable in that they heal more rapidly than skin and without scarring (Sciubba et al., 1978; Szpaderska et al., 2003). Recently, it was suggested that oral mucosa are “primed” for repair by expressing high levels of stem cell genes such as Sox2 under homeostatic conditions, which blocks differentiation during wound healing (Iglesias-Bartolome et al., 2018). To determine how the HP epithelium responds to injury, we developed an assay whereby a small puncture wound (~500μm × 250μm) is made in the largest (~1mm) IR space between R2/R3 (Figure 4A). As expected, re-epithelialization was rapid, with complete wound closure occurring by day 3 and restoration of normal epithelium by day 7 (Figure 4B). Injury induced localized hyperproliferation adjacent to the wound site, which was evident as early as 1d and abated by 7d post-wounding (Figure S3A). While proliferation was elevated throughout the anterior palate (R1-R4), the largest increase was localized to the wound proximal area (R2/R3), particularly in the first ~20 cells adjacent to the wound site (Figure S3B,C). This finding differs from the epidermis, where proliferation occurs behind a proximal migratory front (Aragona et al., 2017; Park et al., 2017).
Figure 4 ∣. IDCs are recruited during wound repair.

(A) Schematic (left) and stereoscope image (right) of puncture wound in the IR space between R2 and R3. Dotted red line represents wound site. (B) Wound healing timeline at 0, 1, 3, 5, and 7 days reveals rapid reapproximation (0-1 days) and reepithelialization (3-7 days). Yellow bracket shows wound margin. (C-E) K5-GFP mice chased for 2 wks then wounded between R2-R3 and harvested 1d later. (C) Colocalization of GFP+ LRCs with Ki67 in wound-proximal region in sham controls (left) and wound +1d (right) palates; + signs: Ki67+ (red), GFP/Ki67 double-positive (yellow). Quantification of pHH3+ mitotic cells in IDC (GFPHI) and FDC (GFPLO) populations (D) and binned by GFP expression levels (E) for regions distal (R1, R4) and proximal (R2,R3) to wound site. GFPHI populations become highly proliferative in the periwound area following injury. (F) Image of wound region in K5-GFP mice chased for 2 wks, wounded, and chased an additional 7d. Loss of GFP label retention 7d post-wound occurs specifically in wound-proximal rugae (R2/R3), but not in distal rugae (R1,R4). Boxed regions shown at higher magnification below; remaining LRCs in R2 are largely SB cells (arrows). (G) Cumulative frequency plot of division orientation in R2/R3 at 0d, 1d, 3d, and 5d post-wounding. Note transient switch toward planar SCDs 1-3d post-wounding, recovering to a normal bimodal distribution by 5d. (H, I) Lineage tracing using K14CreER; LSL-confetti mice, treated with tamoxifen 1d prior to wounding and harvested 7d later. (H) Comparison of basal cells/clone by region in control and wounded animals. (I) CDAs outlining basal-rich clonal expansion in the JZ following wounding. *p<0.05, **p<0.01, ***p<0.0001, by Kolmogorov-Smirnov (G) or Student’s t-test (D,E,H); n values in (G,I) represent cells and (biological replicates) or biological replicates in (D,E,H). Error bars are s.e.m. Scale bars: 100 μm. See also Figure S3.
The immediate, focal response to injury led us to hypothesize that wounding induces localized activation of IDCs. To test this, we chased K5-GFP mice for 2 wks, puncture wounded, and assessed proliferation 1d after wounding (Figure 4C). The GFPLO population in both wound-distal (R1,R4) and wound-proximal (R2,R3) areas showed no change in pHH3+ cells following injury. Conversely, IDCs responded to wounding by elevating mitotic activity, particularly in the wound-proximal area, and most dramatically in populations with the highest GFP levels (Figure 4D,E). We further predicted that if IDCs re-enter the cell cycle upon wounding, they should dilute their GFPHI label following repair. To test this, we wounded 2 wk-chased K5-GFP mice, then chased an additional 7d during reepithelialization. This led to a near-complete local dilution of GFP at the wound site between R2-R3, while IDCs could still be found in wound-distal R1 and R4 (Figure 4F).
Finally, since oral wound healing is thought to involve limiting differentiation (Iglesias-Bartolome et al., 2018), we asked whether injury affects division orientation. We observed a transient shift toward planar divisions that peaked 3d post-wounding, then returned to a homeostatic bimodal distribution by 5d post-wounding (Figure 4G). Taken together, these data confirm that IDCs from the JZ respond to wounding by losing quiescence and expanding rapidly through SCDs to contribute disproportionately to reepithelialization of the wound bed.
Lineage tracing reveals that JZ OESCs are activated during wound healing
To determine how different HP regions respond to wounding, we adapted a genetic lineage tracing strategy used previously in the epidermis (Mascré et al., 2012). We administered tamoxifen 1d prior to wounding to establish clonal labeling and then harvested 7d later once reepithelialization was complete (Figure S3D). The JZ showed the significant increase in the number of basal cells/clone, while the R was largely unaffected (Figure 4H, S3E). Using CDAs to display clonal composition, both the JZ and IR showed a decrease in latent, and increase in balanced clones (Figure 4I). Interestingly, we also observed a large increase in basal-rich clones following injury—from 8% to 43%—specifically in the JZ, suggesting that this region may be largely responsible for the expansion in planar SCDs observed following injury. Thus, basal cells in the JZ—and to a lesser extent, IR—respond to injury by losing quiescence and rapidly proliferating/migrating into the wound region, while R clones contribute minimally to reepithelialization.
OESCs are sensitive to physiologic masticatory stress
Our genetic lineage tracing and label-retention studies revealed striking anterior-posterior differences across the HP epithelium. Specifically, we noted larger clones and more rapid label dilution in the posterior palate (Figure 5A,B). We hypothesized that this may be due to the position of the molars, which concentrate the mechanical forces experienced during mastication (Dutzan et al., 2017). To assess baseline levels of tissue turnover, we analyzed proliferation (Ki67-positivity) and K5-GFP intensity in each ruga following a 2 wk chase. We observed inverse anterior-posterior gradients of proliferation and label-retention, such that the highest proportion of Ki67+ cells was observed in intermolar rugae (R4-R8), while the greatest numbers of LRCs were observed in antemolar rugae (R1-R3) (Figure 5C,D; S4A). On a per-cell basis, K5-GFP intensity was significantly higher in the anterior rugae, whether looking at the whole palate or the JZ alone (Figure 5C; S4A).
Figure 5 ∣. IDCs are sensitive to physiologic masticatory forces.

(A) 4 wk lineage tracing of K14CreER; LSL-Confetti whole mount palate imaged with confocal microscope (RFP channel only) reveals a tendency toward larger clones by volume (μm3) in the intermolar rugae (R5-R6) compared to antemolar rugae (R2-R4). Clones were statistically color coded for volume (right). (B) Stereoscope image of 1 wk-chased K5-GFP whole mount palate revealing a tendency toward less GFP in the intermolar rugae compared to antemolar rugae. (C) Quantification of GFP label retention (% max intensity) by ruga shows significantly reduced levels in posterior HP compared to anterior whether comparing whole palate or JZ. (D) Proliferation, as assessed by Ki67, across each ruga. Greater Ki67 positivity is observed in intermolar rugae. (E) Schematic of label-retention assay in hard chow vs. soft diet. (F) Sagittal sections from K5-GFP mice chased for 2 wks on hard or soft chow showing increased GFP in both basal (K14+) and suprabasal (K14−) cells on soft diet. (G) Intensity coded images of LRC GFP expression in palate whole mounts for the chase periods indicated. Note both AP gradient in label retention in hard chow cohort as well as increased posterior label-retention in soft chow cohort. (H) Quantification of GFP intensity binned by max GFP fluorescence in basal OESCs. (I,J) Co-staining for Ki67 and LRCs in hard (left) and soft (right) chow; + signs: Ki67+ (red), GFP+ (green), double positive (yellow). Overall frequency of cycling cells in posterior palate on soft chow is significantly reduced (J). (K) Quantification of the % of GFPHI IDCs that are SB (K14−) for hard and soft diet conditions. A greater proportion of IDCs are SB in soft diet, indicative of decreased tissue turnover. *p<0.05, **p<0.01, ***p<0.0001, by Student’s t-test (C,H,J,K). Error bars are s.e.m. Scale bars: 250 μm (A,B), 100 μm (F,I). See also Figure S4.
These test whether these anterior-posterior differences are caused by physiologic mastication stress, we compared tissue turnover rates in 2 wk-chased K5-GFP mice fed standard pelleted hard dox chow versus softened chow (Figure 5E). We hypothesized that a “low stress” soft diet might induce OESC quiescence, particularly in the posteriorly positioned, intermolar rugae. Soft chow indeed led to a dramatic increase in GFP+ cells, particularly in the posterior HP (Figure 5F,G; S4B). This “anteriorization” of the posterior rugae was reflected by a >2-fold increase in mean GFP levels in the intermolar rugae after 2 weeks on a soft diet, accompanied by a significant decrease in Ki67+ cycling cells (Figure 5H-J).
To examine whether tissue turnover rates differ in hard and soft chow conditions, we compared the K14− (suprabasal) GFPHI populations, since these represent cells which have left the proliferative basal layer but have not yet terminally differentiated. As expected, soft diet increased mean GFP levels in both K14+ and K14− populations, particularly in posterior rugae (Figure S4D). Strikingly, the proportion of GFPHI cells that are K14− increased from 28% in hard diet to 45% in soft diet (Figure 5K), consistent with soft diet leading to slower tissue turnover. Collectively, these data demonstrate that OESCs are exquisitely sensitive to physiological masticatory stresses that occur during normal feeding, and respond to soft diet by slowing proliferation and tissue turnover rates.
LRIG1 is a marker of IDCs
Next, we sought to identify genes that regulate OESC quiescence by performing transcriptional analysis of FACS-isolated GFPHI IDCs and GFPLO FDCs from 2 wk-chased K5-GFP mice (Figure 6A; S5A). Among the list of differentially expressed genes (Figure 6B; Data S1), one of the most significantly enriched genes in the GFPHI population was Lrig1 (Leucine-rich repeats and immunoglobulin-like domains 1), which marks quiescent stem cell populations in numerous tissues (Choi et al., 2018; Jensen et al., 2009; Powell et al., 2012; Seidel et al., 2017). Using an LRIG1-specific antibody (for validation, see Figure S6A), we confirmed that LRIG1 was enriched in the JZ region where IDCs reside (Figure 6C). LRIG1HI cells (e3x expression over background) were less likely to be cycling compared to LRIG1LO cells (<2x over background), and quiescence became more pronounced with increasing LRIG1 expression (Figure 6D,E). LRIG1LO cells were most frequently observed in the rugae, while LRIG1HI cells were concentrated in the IR and JZ, and LRIG1HI cells were more abundant in the anterior compared to posterior HP (Figure 6F,G; S5B). Thus, overall LRIG1 is enriched in regions with less proliferation.
Figure 6 ∣. RNAseq and lineage tracing reveal that Lrig1 marks IDCs and Igfbp5 FDCs.

(A) FACS histogram of K5-GFP 2 wk-chased GFPLO (FDC) and GFPHI (IDC) populations used for bulk RNAseq analysis. Original GFP signal in unchased K5-GFP cohort shown by dashed line for reference. (B) Top 25 significant differentially expressed genes in FDCs and IDCs with base mean greater than 25. Asterisks indicate genes that have reported roles in stem cell populations based on literature search. Genes in red indicate those used in this study for follow-up and validation. (C) Lrig1 protein intensity plot of R2-R6. Double arrows indicate regions of highest Lrig1 enrichment. (D,E) Co-labeling of Lrig1 with Ki67. Lrig1LO cells tend to be Ki67+ while Lrig1HI cells are Ki67-; quantified in (E). (F) Frequency of Lrig1LO (defined as <2x over background) and Lrig1HI (>3x over background) cells within each region. (G) Lrig1HI cell frequency by ruga, showing concentration in the in anterior rugae. (H) 2 wk lineage tracing using Lrig1CreER and Igfbp5CreER drivers. White arrows in Lrig1CreER tile scan reveal small latent clones; white open arrows in Igfbp5CreER highlight unlabeled JZ. Zoomed in images from yellow dashed rectangles at right. (I) Location of labeled clones for each driver line. (J) Quantification of basal and SB cells/clone for each driver (Krt14CreER, Igfbp5CreER and Lrig1CreER) show most significant differences in SB cell count. (J) CDAs of anterior clones for each driver. Note high frequency of latent clones in Lrig1CreER and high frequency of SB-rich clones in Igfbp5CreER. (L) Subtractive CDA reveals enrichment of SB-rich clones in Igfbp5CreER and latent clones in Lrig1CreER. *p<0.05, **p<0.01, by Student’s t-test (E), χ2 (I), or Kolmogorov-Smirnov test (J). Error bars in are s.e.m. Scale bars: 100 μm (C,H), 20 μm (D). n = 3 biological replicates per condition for (D-L). See also Figure S5.
Lineage tracing reveals that IDCs favor self-renewal and FDCs differentiation
To assess growth kinetics in IDC and FDC populations, we performed genetic lineage tracing with CreER reporter lines of genes enriched in IDCs (Lrig1), FDCs (Igfbp5) or expressed throughout the HP (Krt14). Of FDC signature genes, Igfbp5 was of particular interest because of its enrichment in transit-amplifying populations in the interfollicular epidermis and tooth, as well as stem cells of the hair follicle bulge (Ichijo et al., 2017; Seidel et al., 2017; Tumbar et al., 2004). Moreover, lineage tracing performed with Lrig1CreER and Igfbp5CreER in the incisor demonstrated that despite both being expressed in the labial cervical loop stem cell compartment, Igfbp5 clones grew rapidly and expanded distally into differentiated regions while Lrig1 clones remained smaller and closer to the proximal stem cell niche (Seidel et al., 2017).
We adjusted the tamoxifen regimen for each line in order to achieve sparse induction of clones and then performed lineage tracing for 2 wks. Lrig1CreER; R26REYFP clones were small, rare and frequently observed in the anterior palate. On the other hand, Igfbp5CreER; R26RtdTomato clones were large, columnar, and enriched in the posterior palate, where they were too densely packed, even after a single low dose of tamoxifen, to distinguish individual clones (Figure 6H). Notably, even with near saturation labeling in the posterior HP, unlabeled gaps were frequently observed in the JZ (open arrows in Figure 6H). To induce sparser labeling in the Igfbp5CreER line, we reduced the tamoxifen dose 6-fold, and restricted our subsequent analyses of all three lines to clones found in R1-R3 (see Methods). We noted that the majority of Lrig1 clones (70%) were found in the JZ, while conversely, 80% of Igfbp5 clones were found in the IR or R (Figure 6I). Thus, the Lrig1 and Igfbp5 drivers label populations residing within distinct regions of the HP.
While the average number of basal cells/clone was similar between all lines for this short 2wk labeling period, SB cell counts varied widely, with Lrig1 clones containing significantly fewer, and Igfbp5 significantly more than Krt14 clones (Figure 6J). We next plotted basal and SB cell counts in CDAs for each driver (Figure 6K). Lrig1 clones generally consisted of 1-2 basal cells and 4 or fewer SB cells (basal and latent clone fractions = 10% and 63%, respectively), while Igfbp5 clones were large and contained many SB cells (SB-rich fraction = 79%; Figure 6K; S5C). To compare the clonal distributions of Lrig1 and Igfbp5 directly, we wrote a script to create a subtractive CDA (Figure 6L). This revealed that Igfbp5 shows an enrichment of SB-rich clones while Lrig1 shows an enrichment in basal-rich clones (Figure 6L). These data suggest that Lrig1 and Igfbp5 label populations of OESCs that reside in distinct locations, with different growth kinetics, and that together, these two populations mirror the collective behavior of OESCs within the HP.
LRIG1HI cells divide symmetrically and are IDCs
The small size and basal-rich nature of Lrig1CreER clones suggested a predisposition to self-renewal. To ask whether LRIG1 expression levels correlate with preferences toward SCDs or ACDs, we analyzed division orientation in LRIG1HI and LRIGLO populations. LRIG1LO cells often divided through perpendicular ACDs, while LRIG1HI cells displayed a high proportion of planar SCDs (Figure 7A). This divergent behavior mirrored what we observed with GFPHI and GFPLO populations in our label-retention studies (Figure 3E), with LRIG1HI cells behaving like IDCs and LRIG1LO cells like FDCs. LRIG1 immunostaining in 2 wk-chased K5-GFP mice revealed a strong positive correlation between GFP and LRIG1 levels, particularly in the JZ (Figure 7B,C). Collectively, these findings indicate that LRIG1HI cells and IDCs display similar characteristics of stemness, and may represent the same population.
Figure 7 ∣. Lrig1 adapts OESCs to tissue stress and maintains quiescence.

(A) Cumulative frequency distribution of division orientation for Lrig1LO (gray) and Lrig1HI (black) populations. Like IDCs (Figure 3E), Lrig1HI cells frequently execute planar divisions. (B) GFP intensity (% max) plotted against Lrig1 enrichment for cells located within the JZ (green), R (red) or IR (white). There is a strong positive correlation for the JZ (green line, r2 = 0.54). (D-F) R2 region in K5-GFP mice chased for 2 wks, 1d after wounding. (D) Lrig1 decreases in early wound healing as cycling concomitantly increases. Note that many IDCs near wound site are Ki67+. (E) Quantification of Lrig1 expression levels in periwound area 1d after wounding (red) and in unwounded controls (black). (F) Frequency of Ki67+ cells in Lrig1LO (<2x enrichment), Lrig1MED (2-3-fold enrichment) and Lrig1HI (>3-fold enrichment) populations. Lrig1HI cells, normally quiescent, re-enter the cell cycle 1d after wounding. (G-I) R6 region in K5-GFP mice chased for 2 wks on either hard or soft diet. (G) Lrig1 levels increase in soft diet as cycling (Ki67+) decreases. (H) Quantification of Lrig1 expression levels in intermolar rugae, showing a significant increase in Lrig1 expression on soft diet. (I) Ki67+ cell frequency binned by Lrig1 levels for hard and soft diet conditions. Soft diet leads to a global decrease in cycling. (J,K) Expression of proliferation markers in control (Lrig1Ap/+) and Lrig1-null (Lrig1Ap/Ap) HP. Arrowheads indicate mitotic (pHH3+, green) cells. Boxed areas of JZ shown at higher magnification below. (K) Quantification of Ki67 (left) and pHH3 (right) positivity, demonstrating significantly increased proliferation in Lrig1 Ap/Ap nulls, particularly in JZ region. *p<0.05, **p<0.01, by Student’s t-test except Kolmogorov-Smirnov in (A). Error bars in are s.e.m. Scale bars: 100 μm (J), 50 μm (D,G), 10 μm (A). n = 3 biological replicates for D-K. See also Figure S6.
LRIG1 expression changes dynamically in response to wounding and mastication stress
We next asked whether LRIG1 expression is altered under conditions where IDCs are either activated (wounding) or maintained in a more quiescent state (soft diet). Since wounding induces rapid local proliferation within the IDC population near the wound site, we examined LRIG1 expression in 2 wk-chased K5-GFP mice 1d post-wounding. As expected, wounding induced local OESC proliferation, as measured by Ki67 expression within the IDC population (Figure 7D). This was accompanied by downregulation of LRIG1 expression in the wound area and an increase in the proportion of LRIG1+ cells that entered the cell cycle (Figure 7E,F). Conversely, a 2 wk soft diet in K5-GFP chased mice led to a significant decrease in proliferation and increase in the number of GFPHI IDCs in posterior rugae, which correlated with an increase in LRIG1 expression (Figure 7G-I). Thus, LRIG1 expression is diminished by stress-inducing wounding, and elevated by stress-mitigating soft diet.
LRIG1 loss leads to a loss of quiescence during homeostasis
We next assessed how Lrig1 loss affects quiescence using a null Lrig1-Apple knockin reporter allele (Poulin et al., 2014). We first confirmed that the LRIG1 antibody is coexpressed with the endogenous reporter in control Lrig1Ap/+ heterozygotes and that LRIG1 antibody staining was lost in the JZ of Lrig1Ap/Ap nulls (Figure S6A). Although no obvious differences were observed in division orientation in the HP between Lrig1Ap/Ap nulls and Lrig1Ap/+ controls (Figure S6B), a clear difference was observed in proliferation. Both pHH3 and Ki67 were significantly upregulated in Lrig1Ap/Ap nulls compared to controls (Figure 7J,K; S6C,D). Most of the increased proliferation could be attributed to loss of quiescence in the JZ, where the proportion of pHH3+ mitotic cells increased from 1.36 ± 0.34% to 9.4 ± 1.06%, a 7-fold change (Figure 7K). Comparatively, the R and IR regions showed a modest ~2-fold increase in pHH3 positivity. Collectively, these data indicate that LRIG1 is an important regulator of OESC quiescence under homeostatic conditions.
DISCUSSION
Our studies show that there are important inter- and intra-regional differences by which OESCs self-renew in the oral cavity. Among the tissues studied here, the HP is unique in displaying marked proliferative heterogeneity and containing a regional niche where slow-cycling OESCs reside. IDCs reside in the JZ and primarily self-renew through SCDs while FDCs of the IR and R are biased toward differentiative ACDs. Similar behaviors are observed with LRIG1HI and LRIG1LO populations, respectively, and Lrig1 loss leads to a striking loss of quiescence, particularly in the JZ. IDCs are sensitive to both stress-inducing (wounding) and stress-mitigating (soft diet) events, which evoke opposite proliferative responses. Wounding induces a localized response whereby JZ IDCs are disproportionately activated to self-renew through SCDs and migrate into the wound bed to promote reepithelialization. Collectively, these data demonstrate that JZ IDCs possess many defining characteristics of “reserve” stem cells: quiescence, self-renewal by SCD, LRIG1 expression, and activation following injury.
Our analysis of oriented cell divisions and short-term lineage tracing (Figure 1B-F) reveal many important similarities—as well as differences—among OE. The fraction of clones that had undergone at least one division at 48h was 48% for HP, 58% for oropharynx and 56% for VT (Figure 1F). These data are consistent with the estimated average cell cycle length of ~2d in the buccal epithelium (Jones et al., 2018), while also revealing that the HP is overall more quiescent despite the rapid renewal in the rugae. Additionally, delamination appears to be an important contributor to differentiation—representing ~1/3 of all clones in each tissue—and was more common than ACDs (Figure 1F). Notably, the delamination:SCD ratio in the VT and oropharynx was nearly balanced (0.82 and 0.86, respectively), consistent with a model of delamination driving local tissue differentiation, as proposed in the adult epidermis (Mesa et al., 2018). However, the delamination:ACD ratio varied widely between tissues (3.03 in VT versus 1.64 in HP), suggesting that ACDs may supplement delamination to drive differentiation in high-turnover regions that experience greater stress such as the rugae ridges.
We also noted a strong correlation between division orientation and ACD:SCD clone ratios across all tissues, suggesting that oriented cell divisions dictate fate choices in oral epithelia. Notably, however, in some tissues, particularly oropharynx, the fraction of delamination clones decreases while the ACD fraction increases from 24h to 48h (Figure 1F). It is likely that some of these ACD clones may actually represent an “asymmetric” planar division where one daughter subsequently delaminates following mitosis, as has been observed in the epidermis (Rompolas et al., 2016). This notion is supported by scRNA-seq data, which revealed that buccal OESCs frequently initiate differentiation in the basal layer (Jones et al., 2018). Both this study and our data (Figure S3A) report that K14 expression is heterogeneous in the basal layer, suggesting that K14LO basal cells may be in the process of differentiating.
The favored model of stem cell dynamics in stratified epithelia—based on mathematical modeling of clonal evolution in genetic lineage-tracing studies—has been termed population asymmetry/neutral drift (Clayton et al., 2007; Jones et al., 2007). This model of stochastic competition has been shown to predict stem cell behaviors in a wide variety of tissues, including the intestine, epidermis, and seminiferous tubules (Klein and Simons, 2011). The mucosal buccal epithelium also adheres to this model (Jones et al., 2018), and in agreement with these findings, we find that VT and oropharynx rapidly and uniformly dilute K5/K14-GFP label (Figure 3C; S2B,C). However, while the HP also displays scaling behavior of linear expansion of stem cell number/clone as a function of time (Figure 1I), we noted significant differences in growth rates and differentiation behaviors between the JZ and other palatal regions (Figure 2D-H). Of note, the IR and JZ were the only regions to contain completely undifferentiated clones (exclusively basal cells), even at the 12 wk timepoint (8.7 and 14.3%, respectively). Whether there is a hierarchical relationship between IDCs and FDCs or whether they exist as separate regional stem cell pools remains to be determined. We the latter hypothesis because we rarely observed clonal expansion across HP zones even in our longest lineage tracing experiments.
It is interesting to note that in the epidermis, genetic lineage tracing revealed that “transit-amplifying” (InvCreER) and “stem cell” (Krt14CreER) populations show different potential in wound healing assays, with Krt14 cells contributing substantially—and Inv cells minimally—to reepithelialization (Mascré et al., 2012). This is in many ways similar to what we observe with the differential wound healing capacity of the JZ relative to other palatal populations such as the R and IR (Figure 6H,I). Ultimately, lineage tracing using the Lrig1CreER and Igfbp5CreER lines after wounding could further clarify the relative contributions of distinct HP populations to reepithelialization.
LRIG1 marks stem cells in the GI tract (Choi et al., 2018; Powell et al., 2012) and the hair follicle (Jensen et al., 2009; Jensen and Watt, 2006). Although it seems to perform a similar function in palatal epithelium, our RNAseq data (Data S1) suggest that Lrig1 is expressed at relatively low levels compared to other stem cell compartments. In support of this, we performed lineage tracing with two different Lrig1CreER lines (Page et al., 2013; Powell et al., 2012) using single and multiple low tamoxifen doses in a week, and although we observed sparse labeling throughout the oral cavity at 2 wks, we could only detect rare clones in the HP epithelium, in agreement with a recent study (Jones et al., 2018). Ultimately, we required both higher and multiple doses (5x over one week, 15 mg tamoxifen total) to achieve sufficient labeling. Nonetheless, we provide several strong lines of evidence that LRIG1 maintains OESC quiescence in the palatal epithelium: 1) LRIG1 colocalizes with IDCs, 2) Clones are smaller and have lower LRIG1 expression in the antemolar rugae where proliferation rates are higher; 3) LRIG1Hi and LRIG1LO populations display distinct patterns of oriented cell division that match IDCs and FDCs, respectively; 4) LRIG1 is upregulated in the more quiescent posterior palate on soft diet; 5) LRIG1 expression decreases after wounding as IDCs lose quiescence; and 6) Lrig1 loss induces a massive increase in proliferation, particularly in the JZ.
This work illustrates the influences that both environmental and genetic influences have on regional OESC activity. The striking change to OESC activity in the posterior rugae by the simple change in diet was a surprising result, and this finding demonstrates how homeostasis in the oral cavity is a dynamic process that can incorporate daily functional stressors. It is tempting to consider how the microenvironment of neuronal afferents and Merkel cells—which are known to be highly concentrated in posterior rugae JZ and rarer in antemolar rugae (Moayedi et al., 2018)—may be able to signal to OESCs for increased/decreased activity. Whether it is because the JZ is protected from masticatory stresses, a signaling niche, or both, IDCs consistently localize to this region. Developmentally, these HP junctional zones are well delineated by various markers, including Shh (rugae-specific) and Sostdc1 (interrugae-specific) (Welsh and O'Brien, 2009), suggesting that unique region-specific transcriptional programs may exist that are important for OESC behaviors. It is also interesting that HP is an uncommon site for oral cancers in humans (Bagan et al., 2010; Cerami et al., 2012). Knowledge of the transcriptional and cellular programs that regulate HP OESC behavior may yield important insights into why this tissue is refractory to transformation.
STAR★METHODS
LEAD CONTACT AND MATERIALS AVAILABILITY
Requests for further information should be directed to and will be fulfilled by the Lead Contact, Scott Williams (scott_williams@med.unc.edu). This study did not generate new unique reagents.
EXPERIMENTAL MODEL DETAILS
Mouse Husbandry and Experimental Conditions
All mice were maintained, manipulated, and harvested in an AAALAC certified animal facility under IACUC approved protocols and were monitored daily by certified veterinarian technicians daily at the University of North Carolina at Chapel Hill. For research, we use carbon dioxide and physical euthanasia in accordance with the Panel on Euthanasia of the American Veterinary Medical Association to euthanize animals. For all experiments: at least two animals were used for each analysis, including both males and females. Each of the animals were determined to be ‘healthy’/body score 3; animals that deviated from health or housing conditions were not included in these studies. For each experiment, no animals had previously been included in any other experiments. Animals were housed according to IACUC guidelines on ‘standard housing’ with ‘environmental enrichment’ (including group housing compatible animals and providing animals nest building materials) in the same racks at UNC—or at UCSF for the Igfbp5creER lineage tracing experiments. The trained veterinarian technicians worked daily to accomplish the following tasks: to facilitate animal well-being for research, providing adequate cage space and a comfortable environment with 12 hour light/dark cycles that is escape-proof but with appropriate ventilation, making food (Envigo Rodent Irradiated 2920x) and water easy to access ad libitum, washing and changing cages to clean and maintain the environment free from hazards, alerting the lab to changes in health conditions, and providing the availability to monitor the mice at least once per 24 hour period.
Mouse Lines
The following mouse lines were obtained from collaborators; 1) Tg(KRT14-cre)1Amc/J (Krt14Cre; The Jackson Laboratory, Jax strain 004782); Dougald Monroe (UNC); 2) Tg(KRT14-cre/ERT)20Efu (Krt14CreER; Jax strain 005107); Tony Amelio (UNC). The following strain was obtained from the National Cancer Institute Mouse Repository: FVB/N-Tg(KRT5-tTA) (Krt5tTA; strain 01XM8). The following strains were obtained from The Jackson Laboratory: 1) Krt5tm1.1(cre/ERT2)Blh (Krt5CreER; Jax strain 029155); 2) Gt(ROSA)26Sortm1(CAG-Brainbow2.1)Cle (LSL-Confetti: Jax strain 013731); 3) B6.129P2(Cg) Gt(ROSA)26Sortm1(tTA)Roos/J (LSLtTA; Jax strain 011008); and 4) Cd1/Tg(tetO-HIST1H2BJ/GFP (TREH2B-GFP; Jax strain 005104). Lrig1mAppleC1 (referred to as Lrig1Ap/+ or Lrig1Ap/Ap; (Poulin et al., 2014)) and Lrig1CreERT2/+ ;RosaR26REYFP/EYFP (Powell et al., 2012; Wang et al., 2015) strains were maintained, manipulated, and harvested in an AAALAC certified animal facility under IACUC approved protocols at Vanderbilt University. Igfbp5CreER;RosaR26tdTomato (Seidel et al., 2017) mice were maintained, manipulated, and harvested in an AAALAC certified animal facility under IACUC approved protocols at the University of California, San Francisco. Krt5CreER and Krt14CreER mice were crossed with LSL-Confetti mice to generate heterozygous or homozygous reporter mice for lineage tracing experiments. K14cre mice were crossed with LSLtTA mice to generate heterozygous or homozygous driver mice. Krt5tTA and K14cre;LSLtTA mice were mated with TREH2B-GFP to generate heterozygous K5-GFP or K14-GFP mice for label retaining experiments. At least two animals were used for each analysis and all mice were between 4-12 weeks old, except for the Lrig1Ap experiments in Figure 7/6S, which were 12 months old.
METHOD DETAILS
Fluorescence immunohistochemistry
Tissues were microdissected into cold 1x PBS and fixed for 30 min at room temperature (RT) in 4% paraformaldehyde (PFA). After washing with PBS 3x/10min at RT, samples were equilibrated sequentially in 15% and 30% sucrose solutions at 4°C, and then mounted in Tissue-Tek optimal cutting temperature (OCT) compound (Electron Microscopy Services). 12 μm sagittal sections were cut on a Leica CM1950 cryostat onto SuperFrost Plus slides (Thermo Fisher Scientific) and stored at −80°C. Samples were dried at 37°C for 30 min before a 1h incubation with gelatin block (5% normal donkey serum, 1% BSA, 2% gelatin, and 0.1% Triton X-100 in 1x PBS). Slides were incubated with primary antibodies diluted in gelatin block O/N at 4°C and washed 3x/5min in 1x PBS at RT. Secondary antibodies were also diluted in gelatin block and added to the slide for 2h at RT. DAPI (1:2000 dilution) was added to the slide for 5 min at RT; samples were mounted in 100 μL ProLong Gold (Invitrogen) and covered by glass coverslips (Thermo Fisher). All mice from label-retaining cell assays were injected intraperitoneally (IP) with a dose of 50 μg/g body weight EdU (Life Technologies) 2 hours before harvest. EdU Click-iT® (Thermo Fisher) chemical reactions were performed on slides for 30 min according to manufacturer’s protocol before performing the described secondary antibody protocol.
Genetic Lineage Tracing
Male and Female adult (between 4-12 weeks old) Krt5CreER;LSL-Confetti and Krt14CreER;LSL-Confetti mice were given a single IP dose (30 mg/kg and 100 mg/kg body weight, respectively) of tamoxifen (Sigma⊠Aldrich) and harvested 24h, 36h, 48h, 1 week, 2 weeks, 1 month, 3 months, and 6 months later. Male and female adult (between 4-12 weeks old) LrigCreERT2/+;RosaR26REYFP/EYFP(cis) and Igfbp5CreER;RosaR26tdTomato mice were given doses of IP tamoxifen (5x injections over 1 week at 120 mg/kg, and 1x injection at 20 mg/kg, respectively) and harvested 2 weeks after the last tamoxifen dose. Sagittal sections (≥2 animals/timepoint, ≥2 slides, and ≥5 sections/slide) were stained for K10, RFP and GFP. The LSL-Confetti mice, the anti-GFP antibody (Abcam) labels and enhances three of the four Confetti reporters, each with distinct subcellular localization patterns (nuclear GFP, membranous CFP, and cytoplasmic YFP) that allow clones to be easily distinguished . 20x/1.5x optical zoom single field images were acquired for every labelled clone. For long-term lineage tracing experiments (Figure 2D-H), tile-scan composite images were taken of the entire palate region (Supplementary Figure 1I). For comparisons between the Lrig1CreER, Krt14CreER, and Igfbp5CreER lines (Figure 6H-L), only clones in anterior rugae (R1-R3) were analyzed because the labeling density was too high to resolve single clones in R4-R8 of the Igfbp5CreER line. Clones deemed as being too close to one another, which was defined as any clone where the anterior or posterior extension of the clone (suprabasal or basal fraction) was less than 10 cells away from the nearest clone, were excluded from these analyses.
For 24, 36, ad 48-hour experiments (Figure 1), each clone each clone was categorized as follows: 1) asymmetric cell division (ACD; one basal cell and one suprabasal cell); 2) symmetric cell division (SCD; two basal cells); 3) single basal cells (non-mitotic; 4) delaminating (non-mitotic, single suprabasal cell in spinous layer); or 5) ≥2 cell clones (multiple divisions within the labelling period). Clones were categorized as 1) single basal cells if no labelled SB cell was seen surrounding the clone in the z-stack and 2) delaminating if no labelled basal cell was seen surrounding the clone in the z-stack and the clone was in the first third of the differentiated cell layers (spinous layer only).
Genetic Label Retention Assays
Genetic label-retention studies are based on the previous work of (Tumbar et al., 2004), which utilized Krt5tTA and tetOH2B-GFP mice. We used this combination of strains (K5-GFP) as well as the triple transgenic Ket14Cre;LSLtTA; tetOH2B-GFP (K14-GFP) line. GFP levels were readily detectable at birth using a fluorescent flashlight (NIGHTSEA DFP-1). To initiate the “chase” period, by inhibiting new expression of H2B-GFP, male and female adult K5-GFP and K14-GFP mice between 4-12 weeks of age were switched to pelleted doxycycline chow (Harlan TD.08541 Rodent Diet: 2018, Teklad Global 18% Protein Rodent Diet 999.175 g/kg, 0.625g/kg Doxycycline Hyclate, Red Food Color 0.2g/kg) for 0, 3, 7, 14, or 28 days . Doxycycline chow was kept refrigerated at 4°C and away from light un til use.
Flow Cytometry
Hard palates (rugae 1-8) were microdissected and immediately transferred to 12-well plates with 1 mL of PBS and kept on ice. 500 μL 1x dispase (Life Technologies) was added to each palate and incubated for 1 hour at 37°C. Dissecting forceps (Roboz) were used to peel the epithelia from the underlying lamina propria and scissors/forceps were used to physically separate the epithelia into smaller pieces. Further isolation of basal palatal cells was adapted from the epidermal method of (Nowak and Fuchs, 2009). Palatal epithelia were transferred to a new 12- well plate with 0.25% Trypsin-EDTA. After 60 min incubation at 37°C with vigorous shaking, samples were triturated with P1000 pipette tips precoated with FACS buffer (PBS + 1% FBS) several times to suspend basal epithelial cells. Single cells were isolated using a 35 μm Falcon cell strainer (Thermo Fisher), rinsed with 2 mL of epidermal low calcium medium (E low Ca2+, and then centrifuged for 5 minutes at RT/300x g. The cell pellet was resuspended in FACS buffer and stored on ice. To isolate basal cells by FACS, Rat anti-CD49f-Alexa Fluor® 647 (α6-Integrin, BioLegend) was added to cells and incubated for 60 min on ice. Sytox® Dead Cell Stain (Thermo Fisher, 1:1000) was added 5 minutes before FACS to evaluate cell viability. FACS was performed on a Sony SH800S Cell Sorter, with the following single-channel compensation controls: unchased GFP palatal epithelial cells, anti-CD49f:Alexa Fluor® 647 negative, and Sytox® Dead Cell Stain negative cell suspensions. Flow cytometry analyses were performed using FlowJo 10 software.
RNA-sequencing
RNA was isolated from 200-1000 cells and libraries prepared using the SoLo RNA-Seq library preparation kit (NuGEN). Paired-end RNA sequencing was performed at the UNC High Throughput Sequencing Facility on an Illumina HiSeq4000 with 150 cycles. ~30 million reads were obtained per sample. Illumina output data was first processed using Illumina’s bcl2fastq pipeline (v.2.20.0). Quality control of the samples was performed using FastQC.
Softened Chow Experiments
For soft chow experiments (Figure 5E-K; 7G-I), hard chow was mechanically pulverized into a fine powder using a mallet. Twenty grams of doxycycline chow (Harlan) was added to a 10-cm petri dish (Falcon), and weighed with an automatic scale to determine the amount of water required. Paste was made by slowly adding mouse drinking water to pulverized chow until the mass ratio of water:food was 1.5 (30 g water per 20 g dox chow for 50 g paste/petri dish). New soft dox chow was freshly made every day. Male and female adult K5-GFP were chased for 2 weeks as described using the pelleted “hard” chow or using the pulverized “soft” chow until harvest.
Wound Healing
Male and female adult mice (4-12 weeks old) were anesthetized in an induction chamber with 1L/min O2 and 3% isoflurane vapor. Animals were switched from the induction chamber to the nose cone attached to a homemade aluminum-coated surgical platform. An assistant opened the mouth mediolaterally and superoinferiorly for visual access using two pairs of blunted surgical forceps (Roboz). Puncture wounds were made using a 16 gauge (g) needle (Becton Dickinson) that was heated using a Bunsen burner and bent at a 90° only at the beveled tip. Autoclaved wounding tips were coated in blue dye (Davidson marking system; Bradley Products) to label the wound site immediately before making a small puncture wound in the right interrugae space (between R2-R3) with the wider wound measurement oriented mediolaterally (Figure 4A). Mice were placed on a liquid diet (Envigo; TD.170605.PWD) for 5 days following wounding and weighed daily. Briefly, this powdered diet is based on the Lieber-DeCarli liquid diet formulation. To make the liquid diet, molecular grade water (mL) was measured powdered diet (g) to approximate a liquid/diet ratio of 4.5mL/g. The diet was mixed for about 30 seconds by vigorously shaking in glassware with a lid. Liquid chow was prepared fresh daily. The dry powder was kept refrigerated at 4C for ≤6 months and was stored away from light post-manufacturing. Liquid chow was given to a cage of up to 3 animals using Liquid Diet Feeding Tube (Bio-Serv). Meloxicam was injected 1x/day (5mg/ml) at 24 and 48 hours post-wounding to alleviate post-surgical pain. Pilot studies included animals that were harvested on 0, 1, 3, 5, and 7 days post-wounding to assess for wound healing timelines.
For genetic lineage tracing experiments (Figure 4H,I), male and female adult Krt14CreER;LSL-Confetti mice were given a single dose intraperitoneally of tamoxifen (100 mg/kg body weight). Animals were wounded one day after tamoxifen injection and then harvested 7d post-wounding (8 days total). Sagittal sections (≥3 animals/timepoint) from wounded and and matched unwounded animals were stained for K10, RFP and GFP. Only the anterior rugae (R1-R4) around the wound site were imaged and analyzed.
For genetic label-retention experiments, male and female adult K5-GFP animals were chased for 2 weeks using doxycycline chow. Animals were wounded according to the standard protocol with only a minor accommodations for soft chow. In the 1-day wounding studies (Figure 4C-E), wounded and unwounded control animals were given pulverized ‘soft’ chow in petri dishes for 24 hours before harvest. In the 7-day studies (Figure 4F), wounded and unwounded control animals were given pulverized ‘soft’ chow in petri dishes for 2 days before switching back to ‘hard’ dox chow for 5 days before harvest 7 days after wounding.
Imaging Acquisition
All images are displayed in an anteroposterior orientation from left to right and with the spinous layers superior to the basal layer, irrespective of 3D anatomical orientation. For sections, images were acquired using LAS X software on a Leica TCS SPE-II 4 laser confocal system on a DM5500 upright microscope with ACS Apochromat 10x/0.30 air, ACS Apochromat 20x/0.60 multi-immersion, ACS Apochromat 40x/1.15 oil, and ACS Apochromat 63x/1.30 oil objectives. Lineage tracing and oriented cell division images were acquired at 20x/1.5 and 63x/3.0x optical zoom, respectively, using between 9-12 z-stacks spaced every 2-3 μm to examine the whole section. For whole field label retention and proliferation experiments, images were acquired at 20x/1.5x optical zoom using the tile scan feature from the center of the section as determined by DAPI and stitched together using the LAS X mosaic merge “statistical” feature. For confocal wholemount imaging (Figure 3E), which included a combination of tile scans and z-stacks, z-volume was determined using endogenous GFP signal from the K14-GFP and the endogenous RFP signal from the Krt14CreER; LSL-Confetti reporter, optical section thickness was manually manipulated for thicker slices (10 μm) to preserve fluorescent signal. For stereoscope wholemount imaging (Figure 2B, 4A, 5B), images were acquired with a Leica M165 FC using Leica V4.7 software. All image analysis was performed using FIJI. All Images were edited using Adobe Photoshop CS6/CC and figures were created using Adobe Illustrator CS6/CC.
QUANTIFICATION AND STATISTICAL ANALYSES
Differential Gene Expression Analysis
RNA-seq fastq files were trimmed and aligned to the latest mouse genome, mm10 (GRCm38/GCA_000001635.2) using BBMap. A matrix of the data was generated using featureCounts. RNAseq data was analyzed with DESeq2 (Love et al., 2014), excluding one sample that was an extreme outlier by PCA analysis and two samples that had very poor quality scores. All statistical analyses were performed using R version 3.4.1 and RStudio version 1.0.143.
Clonal Density Arrays
In order to display three-dimensional data from lineage tracing data (suprabasal cells/clone, basal cells/clone, and frequency), we developed clonal density arrays (CDAs), which were inspired by (Alcolea et al., 2014). Scripts to create CDA plots were generated with python 3.6.4, input into Plotly (https://plot.ly), and are available at GitHub.com (byrdkm/oral-stem/cda-original). Each array uses the same cut-off (8% of total clonal distribution) for consistency. CDAs also allow us easily visualize several distinct types of clone: 1) "latent” (B: <2 cells and SB: <2 cells/clones), 2) “basal-rich” (B:SB Ratio >3), 3) “suprabasal-rich” (SB:B ratio >3), and 4) “balanced” (all others). See Supplemental Figure 1F for an example, including annotations. In Figure 6L, the subtractive CDA was also generated with python 3.6.4, input into Plotly: see GitHub.com (byrdkm/oral-stem/cda-diff). The average Lrig1 CDA values were subtracted from the Igfbp5 CDA values to demonstrate clonal density differences between the two populations. On a color value spectrum from blue to red, the difference between CDA basal, SB cell coordinates (x, y) were assigned a color between >10% labelled “blue” to ≥10% (“red”).
GFP label-retention intensity quantification
K5-GFP and K14-GFP tissues were processed for immunofluorescence, including enhancing the GFP signal with chicken anti-GFP antibody (1:2000; Abcam). Unchased (Day 0) K5-GFP and K14-GFP tissues were used to adjust the confocal parameters to the maximum saturated EGFP fluorescence intensity at baseline. These settings were used for the various chase intervals. Tile-scan confocal images of the entire palate region were acquired at 20x/1.5x optical zoom. GFP fluorescence values were calculated by manually measuring fluorescence intensity (a.u.) using the FIJI Multi-point tool (type: dot, color: yellow, size: large) in every basal DAPI+ cell from anterior to posterior in 1) every experimental condition, 2) in multiple slides (n≥2), and 3) in multiple embryos (n≥3). Blinding to GFP intensity was accomplished by using the DAPI channel to select nuclei for analysis. Raw values were captured and binned between <5%, ≥5%, ≥10%, ≥20%, and ≥50% of max.
Quantification of Oriented Cell Division Vectors
Measurement of division orientation is relative to the basement membrane (indicated by dashed lines) and relies on using the late stage mitotic marker survivin to delineate the position of the two daughter cells, as has been described previously (Williams et al., 2011). Briefly, the vector that bisects the two daughter nuclei defines the angle of division relative to the vector defined by the basement membrane. This assay determines division orientation in telophase to analyze division vectors because mitotic spindles at earlier stages of mitosis may not yet have adopted their final orientation. Division angles were measured by at least 2 observers and then angles were binned into 10° increments using Prism 8 and plotted as radial histograms using Origin 2016. For statistical analyses, oriented cell divisions were grouped into three groups: planar (0≤x<30°), oblique (30≤x<60°), and perpendicular (6 0≤x<90°). Chi-square tests were used for statistical analyses.
Quantification of Ki67+, EdU+ and pHH3+ Cells
Quantification of the frequency of cycling cells (Ki67+), mitotic cells (pHH3+), and cells in S-phase during the 2-hour labeling period (EdU+) was determined using FIJI. In Supplementary Figure 3K, cells that have exited S-phase and entered G2/M during the labeling period are double-labeled with EdU and pHH3 (EdU+/pHH3+), whereas cells still within S-phase are only EdU+. Every DAPI+ basal cell along the entire anterior-posterior axis of the palate was counted in each experimental condition, in multiple slides (n≥2), and in multiple embryos (n≥3). Using DAPI+ cells only allowed for measurements to be blinded during each measurement.
Clone size quantification from whole mounts
For clonal surface volume quantification of 1 month lineage-traced clones (Fig. 5A), the endogenous RFP signal from the Krt14CreER; LSL-Confetti reporter was tile-scan imaged using a Leica TCS SPE-II 4 confocal with ACS Apochromat 10x/0.30 air objective. Optical section thickness was manually manipulated for thicker slices (10 μm) to preserve fluorescent signal. LAS X stitched image files (.tiff) were uploaded into Imaris v8.4 (Bitplane) and cropped/reoriented. The RFP signal from labelled clones was used to generate statistically coded 3D surfaces using the Imaris “surfaces” feature for the entire image at once.
Quantification of LRIG1 Enrichment
Measurement of enrichment values was performed using FIJI on tile-scanned confocal images acquired at 20x/1.5x optical zoom. Each cell was circumferentially measured for LRIG1 protein fluorescence values using the FIJI freehand line tool (Line Width = 5) on the same magnification for each image. Five random values were also acquired and averaged for LRIG1 expression in the lamina propria, which was defined as the “baseline.” Enrichment was calculated as the circumferential basal epithelial cell fluorescence of each cell divided by the average lamina propria fluorescence for each tissue section. Every DAPI+ basal cell was counted for each experimental condition, in multiple slides (n≥2), and in multiple embryos (n≥2).
Statistical Analyses
All statistical analyses, plots, graphs, and radial histograms were generated using Prism 8 (GraphPad) and Origin 2016 (OriginLab). p values: *p<0.05, **p<0.01, ***p<0.001. Categorical values, such as binned division orientation data, were analyzed by chi-square tests. Similar results were observed when Kolmogorov-Smirnov tests were performed on cumulative frequency distributions of division angles (e.g. Fig. S1C vs Fig. 1B). Continuous data were analyzed by Student’s t-test except where data were not normally distributed, in which case the Mann-Whitney test was applied. For normality tests, Shapiro-Wilk, and D’Agostino-Pearson omnibus tests were used. For bar graphs, error bars represent standard error of the mean (s.e.m.) unless otherwise indicated in the text/figure legends. For box-and-whisker plots, the boxes represent the minimum and maximum values, the horizontal line represents the median, and the “plus” represents the mean. Where “n” values are indicated in figure panels, the first value represents the number of samples while the value in parentheses indicates the number of animals from which this was pooled. For stacked bar graphs, each box represents a mean value of assigned category from >3 animals/experiment. For cumulative frequency plots, each line represents >3 animals/experiment.
DATA AND CODE AVAILABILITY
Plotly scripts are deposited on Github (github.com/byrdkm/oral-stem). RNA-seq data are deposited on GEO (Accession number GSE139146).
Supplementary Material
Highlights.
Oral epithelia are maintained by both delamination and oriented cell divisions
The hard palate contains a slow-cycling population residing in the junctional zone
Lrig1+ clones are biased toward self-renewal, and Igfbp5+ clones to differentiation
Lrig1+ slow-cycling junctional zone stem cells are stress responsive
Acknowledgements
We thank the Tabin and Goodrich (Harvard) and Amelio labs (UNC) for sharing mice. We are grateful to members of the Williams, Klein, Coffey and Watt labs for helpful discussions. We thank Matteo Battilocchi for coordinating mouse experiments, and Susan Henning, Scott Magness, and Carlton Anderson (UNC Advanced Analytics Core) for technical advice. Funding: K08 DE026537 (KMB), Center for Gastrointestinal Biology & Disease (supported by P30 KD034987) (SEW), Kimmel Scholar Award SKF-15-165 (SEW), P50 CA095103 (RJC), R35 CA197570 (RJC), R35 DE026602 (ODK).
Footnotes
Publisher's Disclaimer: This is a PDF file of an unedited manuscript that has been accepted for publication. As a service to our customers we are providing this early version of the manuscript. The manuscript will undergo copyediting, typesetting, and review of the resulting proof before it is published in its final form. Please note that during the production process errors may be discovered which could affect the content, and all legal disclaimers that apply to the journal pertain.
Declaration of Interests
We have no interests or conflicts to declare
REFERENCES
- Alcolea MP, Greulich P, Wabik A, Frede J, Simons BD, and Jones PH (2014). Differentiation imbalance in single oesophageal progenitor cells causes clonal immortalization and field change. Nature cell biology 16, 615. [DOI] [PMC free article] [PubMed] [Google Scholar]
- Aragona M, Dekoninck S, Rulands S, Lenglez S, Mascré G, Simons BD, and Blanpain C (2017). Defining stem cell dynamics and migration during wound healing in mouse skin epidermis. Nature communications 8, 14684. [DOI] [PMC free article] [PubMed] [Google Scholar]
- Arwert EN, Hoste E, and Watt FM (2012). Epithelial stem cells, wound healing and cancer. Nat Rev Cancer 12, 170–180. [DOI] [PubMed] [Google Scholar]
- Asaka T, Akiyama M, Kitagawa Y, and Shimizu H (2009). Higher density of label-retaining cells in gingival epithelium. J Dermatol Sci 55, 132–134. [DOI] [PubMed] [Google Scholar]
- Bagan J, Sarrion G, and Jimenez Y (2010). Oral cancer: clinical features. Oral oncology 46, 414–417. [DOI] [PubMed] [Google Scholar]
- Bickenbach J (1981). Identification and behavior of label-retaining cells in oral mucosa and skin. Journal of dental research 60, 1611–1620. [DOI] [PubMed] [Google Scholar]
- Bickenbach JR, and Mackenzie IC (1984). Identification and localization of label-retaining cells in hamster epithelia. Journal of Investigative Dermatology 82, 618–622. [DOI] [PubMed] [Google Scholar]
- Blanpain C, and Fuchs E (2009). Epidermal homeostasis: a balancing act of stem cells in the skin. Nature reviews Molecular cell biology 10, 207–217. [DOI] [PMC free article] [PubMed] [Google Scholar]
- Blanpain C, and Simons BD (2013). Unravelling stem cell dynamics by lineage tracing. Nature reviews Molecular cell biology 14, 489–502. [DOI] [PubMed] [Google Scholar]
- Byrd KM, Lough KJ, Patel JH, Descovich CP, Curtis TA, and Williams SE (2016). LGN plays distinct roles in oral epithelial stratification, filiform papilla morphogenesis and hair follicle development. Development (Cambridge, England) 143, 2803–2817. [DOI] [PMC free article] [PubMed] [Google Scholar]
- Cerami E, Gao J, Dogrusoz U, Gross BE, Sumer SO, Aksoy BA, Jacobsen A, Byrne CJ, Heuer ML, Larsson E, et al. (2012). The cBio cancer genomics portal: an open platform for exploring multidimensional cancer genomics data. Cancer discovery 2, 401–404. [DOI] [PMC free article] [PubMed] [Google Scholar]
- Choi E, Lantz TL, Vlacich G, Keeley TM, Samuelson LC, Coffey RJ, Goldenring JR, and Powell AE (2018). Lrig1+ gastric isthmal progenitor cells restore normal gastric lineage cells during damage recovery in adult mouse stomach. Gut 67, 1595–1605. [DOI] [PMC free article] [PubMed] [Google Scholar]
- Clayton E, Doupe DP, Klein AM, Winton DJ, Simons BD, and Jones PH (2007). A single type of progenitor cell maintains normal epidermis. Nature 446, 185–189. [DOI] [PubMed] [Google Scholar]
- Doupe DP, Alcolea MP, Roshan A, Zhang G, Klein AM, Simons BD, and Jones PH (2012). A single progenitor population switches behavior to maintain and repair esophageal epithelium. Science 337, 1091–1093. [DOI] [PMC free article] [PubMed] [Google Scholar]
- Dutzan N, Abusleme L, Bridgeman H, Greenwell-Wild T, Zangerle-Murray T, Fife ME, Bouladoux N, Linley H, Brenchley L, and Wemyss K (2017). On-going mechanical damage from mastication drives homeostatic Th17 cell responses at the oral barrier. Immunity 46, 133–147. [DOI] [PMC free article] [PubMed] [Google Scholar]
- Gur G, Rubin C, Katz M, Amit I, Citri A, Nilsson J, Amariglio N, Henriksson R, Rechavi G, and Hedman H (2004). LRIG1 restricts growth factor signaling by enhancing receptor ubiquitylation and degradation. The EMBO journal 23, 3270–3281. [DOI] [PMC free article] [PubMed] [Google Scholar]
- Hsu YC, Li L, and Fuchs E (2014). Emerging interactions between skin stem cells and their niches. Nat Med 20, 847–856. [DOI] [PMC free article] [PubMed] [Google Scholar]
- Ichijo R, Kobayashi H, Yoneda S, lizuka Y, Kubo H, Matsumura S, Kitano S, Miyachi H, Honda T, and Toyoshima F (2017). Tbx3-dependent amplifying stem cell progeny drives interfollicular epidermal expansion during pregnancy and regeneration. Nature Communications 8, 508. [DOI] [PMC free article] [PubMed] [Google Scholar]
- Iglesias-Bartolome R, Uchiyama A, Molinolo AA, Abusleme L, Brooks SR, Callejas-Valera JL, Edwards D, Doci C, Asselin-Labat M-L, and Onaitis MW (2018). Transcriptional signature primes human oral mucosa for rapid wound healing. Science translational medicine 10, eaap8798. [DOI] [PMC free article] [PubMed] [Google Scholar]
- Ipponjima S, Hibi T, and Nemoto T (2016). Three-Dimensional Analysis of Cell Division Orientation in Epidermal Basal Layer Using Intravital Two-Photon Microscopy. PloS one 11, e0163199. [DOI] [PMC free article] [PubMed] [Google Scholar]
- Jensen KB, Collins CA, Nascimento E, Tan DW, Frye M, Itami S, and Watt FM (2009). Lrig 1 expression defines a distinct multipotent stem cell population in mammalian epidermis. Cell stem cell 4, 427–439. [DOI] [PMC free article] [PubMed] [Google Scholar]
- Jensen KB, and Watt FM (2006). Single-cell expression profiling of human epidermal stem and transit-amplifying cells: Lrig1 is a regulator of stem cell quiescence. Proceedings of the National Academy of Sciences of the United States of America 103, 11958–11963. [DOI] [PMC free article] [PubMed] [Google Scholar]
- Jones KB, Furukawa S, Marangoni P, Ma H, Pinkard H, D'Urso R, Zilionis R, Klein AM, and Klein OD (2018). Quantitative Clonal Analysis and Single-Cell Transcriptomics Reveal Division Kinetics, Hierarchy, and Fate of Oral Epithelial Progenitor Cells. Cell Stem Cell. [DOI] [PMC free article] [PubMed] [Google Scholar]
- Jones KB, and Klein OD (2013). Oral epithelial stem cells in tissue maintenance and disease: the first steps in a long journey. International journal of oral science 5, 121–129. [DOI] [PMC free article] [PubMed] [Google Scholar]
- Jones PH, Simons BD, and Watt FM (2007). Sic transit gloria: farewell to the epidermal transit amplifying cell? Cell Stem Cell 1, 371–381. [DOI] [PubMed] [Google Scholar]
- Klein AM, and Simons BD (2011). Universal patterns of stem cell fate in cycling adult tissues. Development (Cambridge, England) 138, 3103–3111. [DOI] [PubMed] [Google Scholar]
- Laederich MB, Funes-Duran M, Yen L, Ingalla E, Wu X, Carraway KL, and Sweeney C (2004). The leucine-rich repeat protein LRIG1 is a negative regulator of ErbB family receptor tyrosine kinases. Journal of Biological Chemistry 279, 47050–47056. [DOI] [PubMed] [Google Scholar]
- Lechler T, and Fuchs E (2005). Asymmetric cell divisions promote stratification and differentiation of mammalian skin. Nature 437, 275–280. [DOI] [PMC free article] [PubMed] [Google Scholar]
- Lu MS, and Johnston CA (2013). Molecular pathways regulating mitotic spindle orientation in animal cells. Development (Cambridge, England) 140, 1843–1856. [DOI] [PMC free article] [PubMed] [Google Scholar]
- Mascré G, Dekoninck S, Drogat B, Youssef KK, Brohee S, Sotiropoulou PA, Simons BD, and Blanpain C (2012). Distinct contribution of stem and progenitor cells to epidermal maintenance. Nature 489, 257–262. [DOI] [PubMed] [Google Scholar]
- Mesa KR, Kawaguchi K, Cockburn K, Gonzalez D, Boucher J, Xin T, Klein AM, and Greco V (2018). Homeostatic epidermal stem cell self-renewal is driven by local differentiation. Cell stem cell. [DOI] [PMC free article] [PubMed] [Google Scholar]
- Moayedi Y, Duenas-Bianchi LF, and Lumpkin EA (2018). Somatosensory innervation of the oral mucosa of adult and aging mice. Scientific reports 8, 9975. [DOI] [PMC free article] [PubMed] [Google Scholar]
- Morin X, and Bellaiche Y (2011). Mitotic spindle orientation in asymmetric and symmetric cell divisions during animal development. Developmental cell 21, 102–119. [DOI] [PubMed] [Google Scholar]
- Nowak JA, and Fuchs E (2009). Isolation and culture of epithelial stem cells. Methods Mol Biol 482, 215–232. [DOI] [PMC free article] [PubMed] [Google Scholar]
- Page ME, Lombard P, Ng F, Gottgens B, and Jensen KB (2013). The epidermis comprises autonomous compartments maintained by distinct stem cell populations. Cell Stem Cell 13, 471–482. [DOI] [PMC free article] [PubMed] [Google Scholar]
- Papagerakis S, Pannone G, Zheng L, About I, Taqi N, Nguyen NP, Matossian M, McAlpin B, Santoro A, McHugh J, et al. (2014). Oral epithelial stem cells - implications in normal development and cancer metastasis. Experimental cell research 325, 111–129. [DOI] [PMC free article] [PubMed] [Google Scholar]
- Park S, Gonzalez DG, Guirao B, Boucher JD, Cockburn K, Marsh ED, Mesa KR, Brown S, Rompolas P, Haberman AM, et al. (2017). Tissue-scale coordination of cellular behaviour promotes epidermal wound repair in live mice. Nat Cell Biol 19, 155–163. [DOI] [PMC free article] [PubMed] [Google Scholar]
- Peterkova R, Klepacek I, and Peterka M (1987). Prenatal development of rugae palatinae in mice: scanning electron microscopic and histologic studies. Journal of craniofacial genetics and developmental biology 7, 169–189. [PubMed] [Google Scholar]
- Potten CS (1974). The epidermal proliferative unit: the possible role of the central basal cell. Cell and tissue kinetics 7, 77–88. [DOI] [PubMed] [Google Scholar]
- Poulin EJ, Powell AE, Wang Y, Li Y, Franklin JL, and Coffey RJ (2014). Using a new Lrig1 reporter mouse to assess differences between two Lrig1 antibodies in the intestine. Stem cell research 13, 422–430. [DOI] [PMC free article] [PubMed] [Google Scholar]
- Powell AE, Wang Y, Li Y, Poulin EJ, Means AL, Washington MK, Higginbotham JN, Juchheim A, Prasad N, and Levy SE (2012). The pan-ErbB negative regulator Lrig1 is an intestinal stem cell marker that functions as a tumor suppressor. Cell 149, 146–158. [DOI] [PMC free article] [PubMed] [Google Scholar]
- Rompolas P, Mesa KR, Kawaguchi K, Park S, Gonzalez D, Brown S, Boucher J, Klein AM, and Greco V (2016). Spatiotemporal coordination of stem cell commitment during epidermal homeostasis. Science 352, 1471–1474. [DOI] [PMC free article] [PubMed] [Google Scholar]
- Sada A, Jacob F, Leung E, Wang S, White BS, Shalloway D, and Tumbar T (2016). Defining the cellular lineage hierarchy in the interfollicular epidermis of adult skin. Nat Cell Biol 18, 619–631. [DOI] [PMC free article] [PubMed] [Google Scholar]
- Sciubba JJ, Waterhouse JP, and Meyer J (1978). A fine structural comparison of the healing of incisional wounds of mucosa and skin. Journal of oral pathology 7, 214–227. [DOI] [PubMed] [Google Scholar]
- Seidel K, Marangoni P, Tang C, Houshmand B, Du W, Maas RL, Murray S, Oldham MC, and Klein OD (2017). Resolving stem and progenitor cells in the adult mouse incisor through gene co-expression analysis. Elife 6, e24712. [DOI] [PMC free article] [PubMed] [Google Scholar]
- Seldin L, and Macara I (2017). Epithelial spindle orientation diversities and uncertainties: recent developments and lingering questions. F1000Research 6, 984. [DOI] [PMC free article] [PubMed] [Google Scholar]
- Suzuki Y, Miura H, Tanemura A, Kobayashi K, Kondoh G, Sano S, Ozawa K, Inui S, Nakata A, and Takagi T (2002). Targeted disruption of LIG - 1 gene results in psoriasiform epidermal hyperplasia 1. FEBS letters 521, 67–71. [DOI] [PubMed] [Google Scholar]
- Szpaderska AM, Zuckerman JD, and DiPietro LA (2003). Differential injury responses in oral mucosal and cutaneous wounds. Journal of dental research 82, 621–626. [DOI] [PubMed] [Google Scholar]
- Tumbar T, Guasch G, Greco V, Blanpain C, Lowry WE, Rendl M, and Fuchs E (2004). Defining the epithelial stem cell niche in skin. Science 303, 359–363. [DOI] [PMC free article] [PubMed] [Google Scholar]
- Wang Y, Shi C, Lu Y, Poulin EJ, Franklin JL, and Coffey RJ (2015). Loss of Lrig1 leads to expansion of Brunner glands followed by duodenal adenomas with gastric metaplasia. Am J Pathol 185, 1123–1134. [DOI] [PMC free article] [PubMed] [Google Scholar]
- Watt FM, and Green H (1982). Stratification and terminal differentiation of cultured epidermal cells. Nature 295, 434. [DOI] [PubMed] [Google Scholar]
- Welsh IC, and O'Brien TP (2009). Signaling integration in the rugae growth zone directs sequential SHH signaling center formation during the rostral outgrowth of the palate. Developmental biology 336, 53–67. [DOI] [PMC free article] [PubMed] [Google Scholar]
- Willberg J, Syrjänen S, and Hormia M (2006). Junctional epithelium in rats is characterized by slow cell proliferation. Journal of periodontology 77, 840–846. [DOI] [PubMed] [Google Scholar]
- Williams SE, Beronja S, Pasolli HA, and Fuchs E (2011). Asymmetric cell divisions promote Notch-dependent epidermal differentiation. Nature 470, 353–358. [DOI] [PMC free article] [PubMed] [Google Scholar]
- Williams SE, Ratliff LA, Postiglione MP, Knoblich JA, and Fuchs E (2014). Par3-mInsc and Galphai3 cooperate to promote oriented epidermal cell divisions through LGN. Nat Cell Biol 16, 758–769. [DOI] [PMC free article] [PubMed] [Google Scholar]
Associated Data
This section collects any data citations, data availability statements, or supplementary materials included in this article.
Supplementary Materials
Data Availability Statement
Plotly scripts are deposited on Github (github.com/byrdkm/oral-stem). RNA-seq data are deposited on GEO (Accession number GSE139146).