

SUMMARY
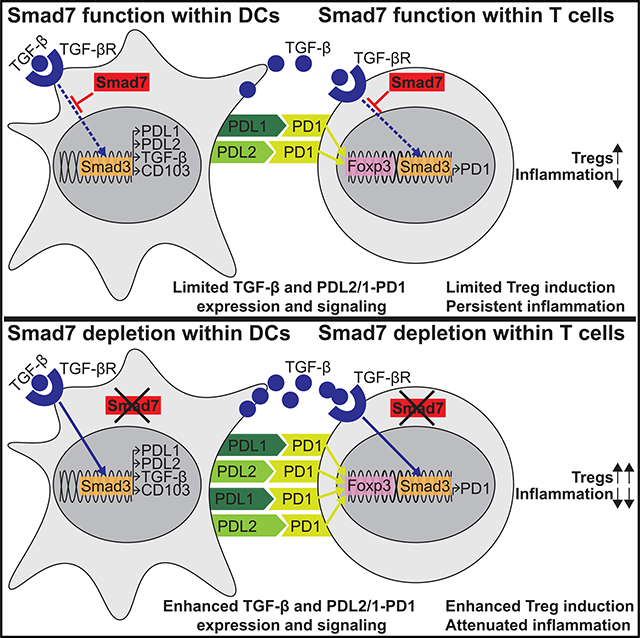
Smad7, a negative regulator of TGF-β signaling, has been implicated in the pathogenesis and treatment of inflammatory bowel diseases (IBDs), including Crohn’s disease (CD) and ulcerative colitis (UC). Here, we found that Smad7 mediates intestinal inflammation by limiting the PDL2/1-PD1 axis in dendritic cells (DCs) and CD4+T cells. Smad7 deficiency in DCs promotes TGF-β responsiveness and the coinhibitory molecules PDL2/1 on DCs, and it further imprints T cell-PD1 signaling to promote Treg differentiation. DC-specific Smad7 deletion mitigates DSS-induced colitis by inducing CD103+PDL2/1+DCs and Tregs. In addition, Smad7 deficiency in CD4+T cells promotes PD1 and PD1-induced Tregs in vitro. The transfer of Smad7-deficient CD4+T cells enhances Tregs in vivo and protects against T cell-mediated colitis. Furthermore, Smad7 antisense ameliorates DSS-induced UC, increasing TGF-β and PDL2/1-PD1 signaling. Enhancing PD1 signaling directly via Fc-fused PDL2/1 is also beneficial. Our results identify how Smad7 mediates intestinal inflammation and leverages these pathways therapeutically, providing additional strategies for IBD intervention.
In Brief
Smad7, a negative regulator of TGF-β signaling, is implicated in the pathogenesis and treatment of inflammatory bowel diseases (IBDs). Here, Garo et al. describe how Smad7 within both dendritic cells and CD4+ T cells limits PD1-mediated Treg induction to promote intestinal inflammation, providing additional therapeutic strategies for IBD intervention.
Graphical Abstract
INTRODUCTION
Although the etiology of inflammatory bowel diseases (IBDs) such as Crohn’s disease (CD) and ulcerative colitis (UC), remains unclear, exaggerated immune responses to the gut microbiota are thought to perpetuate the disease (Dalal and Chang, 2014). Among the regulatory mechanisms that prevent pathogenic inflammation, Foxp3-expressing regulatory CD4+ T (Treg) cells are critical for controlling aberrant immune responses in the gut (Boden and Snapper, 2008; Izcue et al., 2009; Tanoue et al., 2016). The gut environment appears to be a preferential site for Treg development, reflecting the high immune challenge and continuous need for immune suppression (Harrison and Powrie, 2013). Dendritic cells (DCs) play a central role in regulating these intestinal responses (Manicassamy and Pulendran, 2011; Rescigno and Di Sabatino, 2009). In particular, CD103+ DCs exhibit an enhanced ability to induce Tregs (Jaensson et al., 2008; Ruane and Lavelle, 2011). Dysfunction and reduced frequencies of intestinal CD103+ DCs and Tregs have been observed in IBD patients and animal models (Eastaff-Leung et al., 2010; Kourepini et al., 2014; Matsuno et al., 2017; Wenzel et al., 2014). Although DC-T cell dysfunction is a major factor underlying exaggerated immune responses in IBD, the mechanisms that limit regulatory DCs and Tregs in the gut are incompletely understood.
Programmed death 1 (PD1) and its ligands, PDL1 and PDL2, have emerged as critical inhibitory pathways that regulate T cell responses and maintain immune tolerance (Fife and Bluestone, 2008; Francisco et al., 2010; Sharpe et al., 2007). PD1 is expressed on CD4+ T cells, while PDL1 and PDL2 are expressed on antigen-presenting cells (APCs), such as DCs. One major mechanism by which PD1 induces tolerance is by promoting Foxp3+ Tregs when engaged to PDL1-expressing APCs (Francisco et al., 2009; Liu et al., 2013). Defective PDL1 expression in intestinal APCs has been observed in IBD patients, and blocking PD1 can promote intestinal inflammation in mice and humans (Bertha et al., 2017; Reynoso et al., 2009; Robertson et al., 2016; Scandiuzzi et al., 2014; Wang et al., 2017). Although PDL1-PD1 signaling has been shown to be critical for the control of intestinal inflammation, the contribution of PDL2 in intestinal Treg differentiation and the molecular pathways that control PDL2/1-PD1-mediated Treg differentiation in IBDs remain unclear.
Smad7, an inhibitor of regulatory transforming growth factor b (TGF-β) signaling, has been heavily implicated in IBDs. Elevated colonic Smad7 has been associated with enhanced inflammation in IBD patients (Monteleone et al., 2001, 2005). Knock down of Smad7 with a specific antisense oligonucleotide has been shown to resolve multiple sources of inflammation in mice and has yielded mixed results in IBD patients (Boirivant et al., 2006; Feagan et al., 2018; Kleiter et al., 2007; Lowe, 2017; Marafini et al., 2017; Monteleone et al., 2015). However, Smad7 inhibition and therapeutic studies have been hindered by the fact that the molecular pathways by which Smad7 mediates its pathogenic functions in IBDs, including its cell type-specific functions, remain poorly understood.
Here, we uncovered a role for Smad7 in mediating intestinal inflammation by limiting PDL2/1-PD1 signaling. Our results suggest that Smad7 sustains detrimental immune responses in IBDs by inhibiting the PDL2/1-PD1 axis within both DCs and CD4+ T cells. Specific deletion of Smad7 within DCs and T cells protects mice from intestinal inflammation and is associated with increased TGF-β responsiveness, PDL2/1-PD1 signaling, and Treg differentiation. We also demonstrate that silencing Smad7 ameliorates dextran sodium sulfate (DSS)-induced colitis and is associated with increased TGF-β and PDL2/1-PD1 signaling. Finally, we show that enhancing PD1 signaling directly via the administration of recombinant Fc-fused PDL1 or PDL2 is effective in mitigating colitis. Our results identify previously unknown mechanisms by which Smad7 mediates intestinal inflammation and establishes how these insights could be leveraged therapeutically in patients with IBDs.
RESULTS
Smad7 Deficiency Promotes the Development of CD103+ PDL2+ Regulatory DCs
To study the effect of Smad7 on DCs, we generated mice deficient in Smad7 in CD11c+ DCs (DC-Smad7−/−) (Figure S1A). We saw a minor increase in CD11c+ DC frequency (Figure S1B) and no change in DC co-stimulatory molecule expression (Figure S1C). Notably, we found that mesenteric lymph node (MLN) DCs from DC-Smad7−/− mice present with a regulatory phenotype, expressing much higher levels of PD1 ligand, PDL2, and CD103 (Figure 1A). This was observed in both CD11c+CD11b− and CD11c+CD11b+ populations in the gut (data not shown; Muzaki et al., 2016). Similarly, bone marrow-derived DCs (BMDCs) from DC-Smad7−/− mice generated in vitro show enhanced PDL2 and CD103, with no significant difference in other co-stimulatory molecules (Figure S1D). Since we found that Smad7−/− DCs secrete more TGF-β (Figure 1B), we asked whether TGF-β could be inducing the regulatory phenotype we observed. For this, we generated BMDCs in the presence or absence of TGF-β and found that BMDCs generated with TGF-β also express increased PDL2 and CD103 and moderately higher PDL1 (Figure 1C). In contrast, blocking TGF-β inhibits PDL2 and CD103, while moderately reducing PDL1 in DCs (Figure S1E). Similar to the effects observed in other cell types (Afrakhte et al., 1998; Tang et al., 2009), we found that the stimulation of DCs by TGF-β results in increased Smad7, a negative regulator of TGF-β signaling that inhibits Smad2 and Smad3 (Figure 1D).
Figure 1. Smad7 Deficiency Promotes a PDL2+CD103+ Regulatory Phenotype in DCs.

(A) Representative fluorescence-activated cell sorting (FACS) histograms (left) and median fluorescence intensities (MFIs) (right) of PDL2, PDL1, and CD103 in CD11c+ MLN DCs from naive Smad7fl/fl and DC-Smad7−/− mice (n = 11).
(B) ELISA quantification of secreted TGF-β by MLN DCs from these mice (n = 4).
(C) Representative FACS histograms (left) and MFIs (right) of PDL2, PDL1, and CD103 in CD11c+ BMDCs generated with or without TGF-β (30 ng/mL) from WT mice (n = 5).
(D) Western blot of Smad7 in WT CD11c+ BMDCs stimulated with or without TGF-β (2.5 ng/mL) for 30 min.
(E) ChIP analysis of Smad3 binding promoter regions of Pdcdl2 (PDL2), Pdcdl1 (PDL1), and Itgae (CD103) in WT CD11c+ DCs stimulated with or without TGF-β (10 ng/mL). ChIP data expressed as fold enrichment as compared to input control (n = 3).
(F and G) Luciferase reporter activity of Pdcdl2, Pdcdl1, and Itgae promoters in HEK293 cells stimulated (F) with control or Smad3 construct or (G) with or without TGF-β (2 ng/mL) (n = 3). Luciferase activity as relative activity fold change (FC) from (F) control or (G) media condition.
(H) Representative FACS histograms (left) and MFIs (right) of PDL2 and PDL1 in CD103+ and CD103− MLN CD11c+ DCs from WT mice (n = 4).
Data representative of ≥3 independent experiments. MFI data reflective of CD11c+ population and expressed as FC from (A) Smad7fl/fl condition, (C) media condition, or (H) CD103− condition. Means ± SEMs. *p < 0.05, **p < 0.01, and ***p < 0.001 by unpaired t test. See also Figure S1.
Since DCs generated in the presence of TGF-β in vitro and DCs lacking a negative regulator of TGF-β generated in vivo show enhanced expression of PDL2 and CD103 and a moderate increase in PDL1, we asked whether TGF-β-induced Smad transcription factors are involved in the transcriptional activation of PDL2, PDL1, and CD103 genes. We performed a transcription factor binding site (TFBS) analysis for the promoter regions of human and mouse Pdcdl2 (PDL2), Pdcdl1 (PDL1), and Itgae (CD103) genes and found multiple putative Smad3 binding sites on all three (Figure S1F). To confirm that Smad3 binds these promoters, we performed chromatin immunoprecipitation (ChIP) assays with Smad3 antibody using DCs stimulated with or without TGF-β. We found significantly increased binding of Smad3 to all three gene promoters from TGF-β-stimulated DCs (Figure 1E). To further investigate TGF-β on the Smad3-dependent transcriptional regulation of these genes, we performed reporter assays using constructs in which a PDL2, PDL1, or CD103 promoter sequence was cloned upstream of a luciferase gene. Transfection of Smad3 cDNA construct in HEK293 cells transactivates PDL2, PDL1, and CD103 promoters, as shown by increased luciferase expression (Figure 1F). In addition, the upregulation of endogenous Smad3 by TGF-β stimulation also induces promoter binding (Figure 1G). Consistent with a role for Smad3 in the transcriptional activation of PDL2, PDL1, and CD103, we found BMDCs and ex vivo-isolated splenic and MLN DCs from Smad3-deficient (Smad3−/−) mice express significantly lower levels of PDL2, PDL1, and CD103 (Figures S1G and S1H). In contrast to Smad7−/− DCs (Figure 1B), these DCs also express less TGF-β (Figure S1I).
Based on observations that CD103+ DCs express increased levels of TGF-β and that TGF-β transcriptionally regulates PDL2, PDL1, and CD103, we asked whether these tolerogenic markers are regulated concomitantly in vivo under normal conditions. For this, we evaluated the expression of PDL2/1 in CD103+ and CD103− MLN DC populations in wild-type (WT) mice. We found that PDL2 is highly associated with CD103, while PDL1 correlates less robustly (Figure 1H). This pattern is analogous to the stark and modest upregulation of PDL2 and PDL1, respectively, in response to TGF-β (Figure 1C). Together, these findings suggest that TGF-β stimulation induces a tolerogenic transcriptional program in DCs, which is enhanced by the absence of Smad7.
Smad7 Restricts the Responsiveness of DCs to TGF-β Stimulation
TGF-β has been shown to induce its own expression in multiple cell types, including DCs (Bouché et al., 2000; Kashiwagi et al., 2015). Smad7 negatively regulates TGF-β signaling by inhibiting Smad2 and Smad3 phosphorylation, two major transcription factors downstream of TGF-β signaling (Shi and Massagué, 2003). Based on our observations of enhanced expression of regulatory markers and TGF-β in Smad7−/− DCs, both of which are induced by TGF-β stimulation, we tested whether Smad7 restricts the responsiveness of DCs to TGF-β. We found that autocrine induction of TGF-β is amplified in the absence of Smad7 in DCs (Figure 2A). Consistent with this, increased phosphorylation of Smad2 and Smad3 is measured in Smad7−/− DCs in response to TGF-β (Figure 2B). Correspondingly, autocrine induction of TGF-β is completely impaired in Smad3−/− DCs (Figure S2A). In addition, our TGF-β signaling array identified the upregulation of assorted TGF-β-responsive genes in Smad7−/− DCs (Figure 2C). These results show that Smad7 deficiency in DCs promotes responsiveness to TGF-β stimulation.
Figure 2. Smad7 Restricts DC Responsiveness to TGF-β and Their Ability to Induce Tregs.

(A) ELISA quantification of secreted TGF-β from Smad7fl/fl and Smad7−/− MLN CD11c+ DCs stimulated with or without TGF-β (0.5 ng/mL), for 12 h, washed, and cultured for another 48 h (n = 4).
(B) Representative FACS histograms (left) and MFIs (right) of phospho-Smad2/3 in BMDCs stimulated with or without TGF-β (2 ng/mL), for 1 h (n = 6).
(C) qRT-PCR (using Qiagen Mouse TGF-β Signaling Pathway RT2 Profiler PCR Array) of TGF-β and associated TGF-β signaling molecules in Smad7fl/fl and Smad7−/− CD11c+ DCs stimulated with or without TGF-β (10 ng/mL), for 10 h.
(D) Representative FACS plots (left), frequencies (center), and cell counts per well (right) of Foxp3-GFP+ populations in naive CD4+ Foxp3-GFPT cells co-cultured with MLN CD11c+ DCs from Smad7fl/fl or DC-Smad7−/− mice at a 1:3 DC:T cell ratio, with or without TGF-β (0.5 ng/mL), for 4 days (n = 8).
(E) Representative FACS histograms (left) and frequencies (right) of PD1 in naive CD4+ T cells co-cultured with MLN CD11c+ DCs from Smad7fl/fl or DC-Smad7−/− mice at a 1:3 DC:T cell ratio, for 18 h.
(F) Representative FACS plots (left), frequencies (center), and cell counts per well (right) of Foxp3-GFP+ populations in naive CD4+Foxp3-GFP T cells co-cultured with MLN CD11c+ DCs from Smad7fl/fl or DC-Smad7−/− mice at a 1:3 DC:T cell ratio, with or without anti-TGF-β (10 μg/mL) and/or anti-PD1 (10 μg/mL), for 4 days (n = 3).
(G) Representative FACS plots (left), frequencies (center), and cell counts per well (right) of Foxp3+ populations in naive CD4+ T cells from WT or PD1-deficient mice co-cultured with CD103− or CD103+ DCs from WT mice at a 1:3 DC:T cell ratio, for 3 days (n = 3).
(H) Representative FACS plots (top), frequencies (bottom left), and cell counts per well (bottom right) of Foxp3-GFP+ populations in naive CD4+Foxp3-GFP T cells stimulated with or without TGF-β (0.5 ng/mL), recombinant plate-bound PDL1-Fc or PDL2-Fc (30 μg/mL), and/or anti-TGF-β (10 μg/mL), for 4 days (n = 6).
MFI data reflective of (B) CD11c+ or (E) CD4+ populations and expressed as FC from Smad7fl/fl condition. Data representative of ≥3 independent experiments. Means ± SEMs. *p < 0.05, **p < 0.01, and ***p < 0.001 by unpaired t test. See also Figure S2.
Smad7−/− DCs Promote the Differentiation of Naive CD4+ T Cells Into Foxp3+ Tregs
Given the enhanced TGF-β levels and regulatory surface markers of Smad7−/− DCs, we then investigated whether this apparent immunosuppressive phenotype is associated with immunosuppressive functions. For this, we co-cultured naive CD4+ T cells derived from Foxp3GFP mice with either Smad7fl/fl or Smad7−/− DCs in the presence or absence of TGF-β. We found that Smad7−/− DCs induce enhanced differentiation of Foxp3+ Tregs, a difference that is further amplified by TGF-β (Figure 2D). We also found enhanced expression of the regulatory marker PD1 on T cells co-cultured with Smad7−/− DCs (Figure 2E). To investigate whether the increased production of TGF-β alone may account for the ability of Smad7−/− DCs to upregulate Foxp3 in CD4+ T cells, we tested the ability of Smad7−/− DCs to induce Foxp3 in the presence of the TGF-β-neutralizing antibody. Neutralizing TGF-β results in the partial abrogation of Foxp3 induction in CD4+ T cells, suggesting that an additional pathway may be involved (Figure 2F). We did not observe differences in Smad7fl/fl DCs, which show minimal baseline Foxp3 induction under all treatment conditions (data not shown).
The PDL1/PD1 axis has been characterized as a potent inhibitor of immune activation, particularly through the inhibition of effector T cell function (Francisco et al., 2010). PD1 signaling has been shown to induce tolerance in part by promoting the development of Foxp3+ Tregs (Francisco et al., 2009). We thus asked whether the higher PDL1 and PDL2 expression by Smad7−/− DCs, as well as the increased PD1 induction on T cells by Smad7−/− DCs, serve as an additional signal to promote Foxp3+ Treg development. Although we found that blocking PD1 reduces Foxp3+ Tregs, the combination of both TGF-β-neutralizing and PD1-blocking antibodies synergistically reduces the Treg differentiation induced by Smad7−/− DCs to the level induced by Smad7fl/fl DCs (Figure 2F). Smad3−/− DCs, which express reduced CD103, PD1 ligands, and TGF-β, are also defective in inducing Foxp3+ Tregs (Figure S2B). Correspondingly, enhanced Foxp3+ Treg induction by WT CD103+ DCs compared to CD103− DCs is abrogated when co-cultured with PD1-deficient T cells (Figure 2G), suggesting that PD1 signaling also mediates CD103+ DC-induced Treg differentiation. To further investigate the relative contribution of PDL1-PD1 and PDL2-PD1 signaling on Foxp3+ Treg cell development, we activated naive CD4+ T cells with or without TGF-β in the presence or absence of recombinant PDL1 and PDL2 Fc chimera proteins (PDL1-Fc and PDL2-Fc). The addition of either PDL1-Fc or PDL2-Fc without TGF-β (either added alone or with additional TGF-β-neutralizing antibody to address low levels of endogenous TGF-β) modestly promotes Tregs, but PDL1-Fc and PDL2-Fc greatly enhance Tregs induced by exogenous TGF-β (Figure 2H). These results suggest that Smad7 deficiency in DCs promotes TGF-β- and PDL2/1-mediated Treg differentiation.
Smad7 Deletion in Dendritic Cells Reduces Colitis Severity in Mice
Smad7 has been reported to be increased in IBD patients (Monteleone et al., 2001, 2005). In parallel, we found Smad7 to be upregulated in immune cells in a DSS-induced colitis model (Figure S3A). Since we found that Smad7−/− DCs demonstrate an enhanced ability to drive Treg differentiation, we asked whether Smad7 deficiency in DCs could protect mice from intestinal inflammation. Compared to Smad7fl/fl mice, DC-Smad7−/− mice given DSS lose significantly less weight (Figure 3A) and show a reduction in overall disease activity index, which accounts for the presence of blood in the stool and diarrhea in addition to weight changes (Figure 3B). DC-Smad7−/− colons also display a significantly decreased histopathological score, as characterized by more intact crypt architecture and decreased inflammatory cell infiltration (Figure 3C). Furthermore, the pathological shortening of colon length was modestly less pronounced in colitic DC-Smad7−/− mice (Figure 3D). To characterize differences in inflammatory signaling associated with colitis, we profiled the expression of inflammatory cytokines and chemokines in distal colon homogenates from colitic Smad7fl/fl and DC-Smad7−/− mice. Consistent with decreased inflammatory infiltrates, we found reduced levels of proinflammatory mediators in DC-Smad7−/− mice (Figure 3E). We then validated the expression of selected genes (interleukin 1β [IL-1β], IL-6, tumor necrosis factor α [TNF-α], and IL-18) known to play a key role in inflammation by qRT-PCR (Figure 3F) (Kaser et al., 2010). In addition, we found that MLN DCs from colitic DC-Smad7−/− mice express higher levels of TGF-β and reduced levels of Thi- and Th17-polarizing cytokines (Figure 3G). We also found that increased TGF-β in Smad7−/− DCs is associated with increased PDL2 and CD103 (Figures 3H). Although a previous report found altered indoleamine 2,3-dioxygenase (IDO) in Smad7−/− DCs in vivo in other contexts (Lukas et al., 2017), we found no difference in IDO expression (data not shown). We also found no difference in retinoic acid (RA)-metabolizing enzymes in Smad7−/− DCs during colitis (data not shown), which have been associated with CD103+ DCs (Coombes et al., 2007). To assess whether Smad7 deficiency in DCs has the capacity to modulate T cell cytokines in vivo, we measured these cytokines in colitic mice. CD4+ T cells from DC-Smad7−/− mice express more Foxp3 and less interferon γ (IFN-γ) and IL-17a, both at mRNA (Figure 3I) and protein levels in the MLN and lamina propria (Figure 3J).
Figure 3. Smad7 Deficiency in DCs Protects Mice against DSS-Induced Colitis.

(A) Percentage body weight changes (left) and linear regression analysis (right) of Smad7fl/fl and DC-Smad7−/− mice treated with 3% DSS in drinking water for 7 days (n = 8).
(B) Disease activity index, a composite of body weight loss, blood in stool, and consistency of stool (higher score corresponds to colitis severity) (left) and linear regression analysis (right) of Smad7fl/fl and DC-Smad7−/− mice treated with 3% DSS in drinking water for 7 days (n = 9).
(C) Representative histological sections with H&E (left) and scores (n = 10) (right) of colitic mice based on degree of ulceration at day 7, scored blinded by a pathologist at HRHCF. Scale bars represent ~1 mm (top) and ~100 μm (bottom).
(D) Colon lengths of colitic mice at day 7 (n = 13).
(E) Representative NanoString (immunology panel) heatmap of inflammatory and regulatory genes in distal colon from colitic Smad7fl/fl and DC-Smad7−/− mice. Important upregulated and downregulated genes of interest in DC-Smad7−/− are highlighted in red and green, respectively.
(F) qRT-PCR validation of selected genes, including IL-1β, IL-6, TNF-α, and IL-18 expression in these samples (n = 3).
(G) qRT-PCR of TGF-β, CD103, IL-12, IL-1β, IL-6, IL-23, and TNF-α expression in MLN CD11c+ DCs from colitic mice (n = 5).
(H) Representative FACS histograms (left) and MFIs (right) of PDL2, PDL1, and CD103 in MLN CD11c+ DCs from colitic mice (n = 3). MFI data reflective of CD11c+ population and expressed as FC from Smad7fl/fl condition.
(I) qRT-PCR of Foxp3, IFN-γ, and IL-17a in MLN CD4+ T cells (n = 5).
(J) Representative FACS plots (left) and frequencies (right) of Foxp3+, IFN-γ+, and IL-17a+ populations in MLN (top) and lamina propria (LP) (bottom) CD4+ T cells (n = 4–10).
(K) Percentage of body weight scores (left) and linear regression analyses (right) of Smad7fl/fl and DC-Smad7−/− mice treated during DSS administration, as indicated. Mice were treated with either immunoglobulin (Ig) control, (top) anti-CD25 (500 μg) (center), or anti-PD1 (250 μg) (bottom), given i.p. every other day 4 times, starting with DSS administration at day 0 (n = 3–4). Only control colitis body weight loss data for anti-CD25 are shown. Control data for anti-PD1 are identical (data not shown).
Data representative of ≥3 independent experiments. qRT-PCR data expressed as FC from Smad7fl/fl condition. Means ± SEMs. *p < 0.05, **p < 0.01, ***p < 0.001 by unpaired t test. See also Figure S3.
To further examine the contribution of Tregs and Treg-promoting PD1 signaling in mitigating colitis severity in DC-Smad7−/− mice, colitic Smad7fl/fl and DC-Smad7−/− mice were treated with blocking antibodies to PD1 and CD25. We found that each blocking antibody is able to abrogate colitis resistance observed in control-treated DC-Smad7−/− mice, indicating an indispensable role for Tregs and Treg-promoting PD1 signaling in mitigating colitis in DC-Smad7−/− mice (Figure 3K). Experimental autoimmune encephalomyelitis (EAE), a mouse model for multiple sclerosis characterized by ascending paralysis, is another in vivo model in which DCs play an important role (Yogev et al., 2012). Similar to colitis, we found that DC-Smad7−/− mice develop attenuated EAE and neuroinflammation (Figures S3B and S3C) associated with tolerogenic DC and T cell profiles, including increased Treg frequency (Figures S3D and S3E). Our data suggest that Smad7-deficiency in DCs exerts protective Treg-mediated effects during DSS-induced colitis and other autoimmune conditions.
Smad7 Restricts T Cell Responsiveness to TGF-β and PD1-Mediated Treg Differentiation and Promotes Colitis in a T Cell-Intrinsic Manner
Because we found that the enhanced ability of Smad7−/− DCs to induce PD1 on CD4+ T cells (Figure 2E) is associated with increased TGF-β in Smad7−/− DCs (Figure 2A), we tested the functional role of TGF-β on PD1 induction. The neutralization of TGF-β in DC-CD4+ T cell co-cultures mitigates enhanced PD1 induction on T cells by Smad7−/− DCs (Figure S4A). We next stimulated naive CD4+ T cells in the presence or absence of TGF-β to directly assess the effect of TGF-β on PD1. Consistent with a recent report (Park et al., 2016), we found increased PD1 on CD4+ T cells stimulated with TGF-β (and activated with low-dose anti-CD3/28, which itself can induce PD1) (Figure S4B) (Nakae et al., 2006). Our TFBS analysis, followed by ChIP and luciferase assays, support that TGF-β transcriptionally activates the Pdcd1 (PD1) promoter in T cells in a Smad3-dependent manner (Figures S4C–S4F). This is further confirmed by impaired PD1 induction in response to TGF-β in Smad3−/− T cells (Figure S4G).
We and others have reported that in mouse and human T cells, TGF-β stimulation increases Smad7, which can inhibit TGF-β-induced Smad3 (Fantini et al., 2004; Murugaiyan et al., 2015). Therefore, to investigate whether Smad7 also limits TGF-β responsiveness and PD1 expression on CD4+ T cells, we generated mice deficient in Smad7 in CD4+ T cells (T-Smad7−/−) (Figure S4H). We found that naive CD4+ T cells from T-Smad7−/− mice show increased Smad2/3 phosphorylation (Figure 4A) associated with enhanced PD1 induction (Figure 4B), which corresponds to improved Treg differentiation in response to TGF-β and PDL1/2 stimulation in vitro (Figure 4C). Based on our observation that higher PD1 expression by Smad7−/− CD4+ T cells favors Treg development in vitro, we asked whether the adoptive transfer of Smad7−/− CD4+ T cells would result in reduced colitis severity in a T cell-mediated colitis model. Therefore, we transferred CD45RBhiCD4+ T cells from Smad7fl/fl and T-Smad7−/− mice to Rag-1−/− mice (Figure 4D). We found that Rag-1−/− mice that receive CD4+ T cells from Smad7fl/fl mice begin to lose weight in 5 weeks and develop severe colitis; however, mice that received CD4+ T cells from T-Smad7−/− mice are protected (Figure 4D). We confirmed the development of colitis in mice reconstituted with Smad7fl/fl CD4+ T cells by histological analysis at 7 weeks, which is characterized by marked inflammation (Figure 4E) and increased inflammatory cytokine expression in the colon (Figure 4F), both of which are significantly diminished in mice reconstituted with Smad7−/− CD4+ T cells. We also found an increase in the fraction of Foxp3+ Tregs (Figure 4G) and PD1+ T cells (Figure 4H) in the MLNs and spleens of Smad7−/− CD4+ T cell recipients. This is consistent with our in vitro data showing higher PD1 expression in Smad7−/− T cells, which is associated with an increased ability to differentiate into Tregs in response to TGF-β and PDL2/1 stimulation (Figures 4B and 4C). In addition, we found that T-Smad7−/− mice are less susceptible to DSS-induced colitis (Figures S5A and S5B), during which they also present with greater Treg frequency (Figure S5C). These results suggest that Smad7-deficiency in CD4+ T cells promotes PD1 upregulation and PD1-mediated Treg differentiation, conferring resistance to colonic inflammation.
Figure 4. Smad7 Limits PD1 on CD4+ T Cells and PD1-Mediated Treg Differentiation and Promotes T Cell-Mediated Colitis.

(A) Representative FACS histograms (left) and MFIs (right) of phospho-Smad2/3 in naive CD4+ T cells from Smad7fl/fl and T-Smad7−/− mice stimulated with or without TGF-β (2.5 ng/mL), for 1 h (n = 4).
(B) Representative FACS histograms (left) and MFIs (right) of PD1 in naive CD4+ T cells from these mice stimulated with low-dose plate-bound anti-CD3/CD28 (1 μg/mL) with or without TGF-β (2.5 ng/mL), for 18 h (n = 8).
(C) Representative FACS plots (top), frequencies (bottom left), and cell counts per well (bottom right) of Foxp3+ populations in naive CD4+ T cells from these mice stimulated with or without TGF-β (0.5 ng/mL) and recombinant plate-bound PDL1-Fc or PDL2-Fc (30 μg/mL), for 4 days (n = 5).
(D–H) Colitis was induced by adoptive transfer of 6 × 10⁵ CD4+CD45RBhi T cells i.p. into Rag-1 mice, followed by monitoring for 7 weeks. (D) Percentage body weight changes (left) and linear regression analysis (right) of Rag-1−/− mice injected with CD4+CD45RBhi T cells from Smad7fl/fl or T-Smad7−/− mice (n = 8). (E) Representative histological sections stained with H&E of distal colons (left) and histological scores (n = 8) (right) from recipient Rag-1−/− mice, based on the degree of epithelial damage, as scored blinded by a pathologist at HRHCF. Scale bars represent ~1 mm (top) and ~100 μm (bottom). (F) qRT-PCR of IL-12, IL-1β, IL-6, IL-23, and TNF-α in colitic tissue from recipient mice (n = 8). (G) Representative FACS plots (left) and frequencies (right) of Foxp3+ populations in MLN (top) and splenic (bottom) CD4+ T cells from recipient mice at 7 weeks (n = 5–8). (H) Representative FACS histograms (left) and frequencies (right) of PD1 in MLN (top) and splenic (bottom) CD4+ T cells from recipient mice at 1 week (n = 6).
Data representative of ≥2 independent experiments. qRT-PCR and MFI (reflective of CD4+ population) data expressed as FC from Smad7fl/fl media condition. Statistical comparisons to Smad7fl/fl condition. Means ± SEMs. *p < 0.05, **p < 0.01, and ***p < 0.001 by unpaired t test. See also Figures S4 and S5.
Smad7 Inhibition Ameliorates DSS-Induced Colitis in Mice
Although TGF-β is highly expressed in IBD patients, TGF-β signaling is impaired due to high Smad7 activity (Monteleone et al., 2001). Accordingly, restoring TGF-β signaling with an anti-Smad7 oligonucleotide that specifically targets Smad7 mRNA has been effective in several inflammatory models (Boirivant et al., 2006; Kleiter et al., 2007) and in some CD (Feagan et al., 2018; Marafini et al., 2017; Monteleone et al., 2015) and UC patients in a recent trial (ClinicalTrials.gov: ).
Our data suggest that the deletion of Smad7 in DCs (Figure 3) and T cells (Figure S5) protects mice from a DSS-induced UC model (Chassaing et al., 2014). Therefore, we investigated whether Smad7 inhibition using Smad7-antisense (Smad7-as) could also ameliorate this type of colitis in mice (Figure 5A). The same sequence Smad7-as inhibitor has previously been validated by others in vitro (Monteleone et al., 2001) and in vivo in models of CD and neuroinflammation (Boirivant et al., 2006; Kleiter et al., 2007) and in CD patients (Feagan et al., 2018; Monteleone et al., 2015). Two of these studies have demonstrated Smad7-as to be effectively uptaken by immune cells in the periphery and gut (Boirivant et al., 2006; Kleiter et al., 2007). In agreement with these studies, we found that the administration of Smad7-as during DSS-induced colitis ameliorates disease. Smad7-as-treated mice lose less weight (Figure 5B) and show less colonic inflammation (Figure 5C), which is associated with decreased expression of Smad7 and inflammatory genes in the colon (Figure 5D). Furthermore, MLN DCs from Smad7-as-treated mice express decreased Smad7, indicating that Smad7-as effectively inhibits Smad7 in these cells, along with increased TGF-β (Figure 5E). Consistent with elevated TGF-β, we found enhanced PDL2, PDL1, and CD103 both at mRNA (Figure 5E) and protein levels (Figure 5F). In addition, Smad7-as-treated mice exhibit decreased Smad7 in T cells, demonstrating Smad7-as efficacy in these cells, alongside higher levels of Foxp3 and PD1 and reduced IFN-γ and IL-17a at the mRNA level (Figure 5G). Correspondingly, increased frequencies of Foxp3+ Tregs and reduced frequencies of IFN-γ- and IL-17a-producing CD4+ T cells are observed in Smad7-as-treated mice (Figure 5H). These data suggest that Smad7 inhibition ameliorates a model of UC, which may be mediated via the tolerogenic effects of Smad7 suppression in DCs and CD4+ T cells.
Figure 5. Smad7 Inhibition Ameliorates DSS-Induced Colitis in Mice.

(A) Schematic of DSS colitis induction (3% DSS in water for 7 days, untreated drinking water for 7 days) and Smad7-as treatment i.p. (250 μg per mouse every other day 4 times).
(B) Percentage body weight changes (left) and linear regression analysis (right) of colitic mice treated with Smad7-as or its oligonucleotide control (n = 8).
(C) Representative histopathological sections with H&E (left) and scores (n = 8) (right) based on the degree of ulceration at day 14, scored blinded by a pathologist at HRHCF. Scale bars represent ~1 mm (top) and ~100 μm (bottom).
(D) qRT-PCR of Smad7, IL-1β, IL-6, and TNF-α expression in colitic tissue (n = 10–15).
(E) qRT-PCR of Smad7, TGF-β, PDL2, PDL1, and CD103 expression in MLN CD11c+ DCs from colitic mice (n = 10).
(F) Representative FACS histograms (left) and MFIs (right) of PDL2, PDL1, and CD103 in MLN (top) and splenic (bottom) CD11c+ DCs from colitic mice (n = 5–10). MFI data reflective of CD11c+ population and expressed as FC from control condition.
(G) qRT-PCR of Smad7, Foxp3, IFN-γ, IL-17a, and PD1 expression in CD4+ MLN T cells (n = 5–10).
(H) Representative FACS plots (left) and frequencies (right) of Foxp3+, IFN-γ+, and IL-17a+ populations in CD4+ MLN (top), splenic (center), and LP (bottom) T cells (n = 4–5).
(I–K) DSS colitis was induced (3% DSS in water for 7 days, untreated drinking water for 7 days) and PDL1-fc or PDL2-fc treatment were given i.p. (100 μg per mouse every other day 4 times) as in (A). (I) Percentage body weight changes (left) and linear regression analysis (right) of colitic mice treated with PDL1-Fc, PDL2-Fc, or Ig control (n = 5–7). (J) Representative histopathological sections (left) and scores (right) based on the degree of ulceration, scored blinded by a pathologist at HRHCF (n = 8). Scale bars represent ~1 mm (top) and ~100 μm (bottom). (K) qRT-PCR of Foxp3 expression in colitic tissue (n = 4–5).
Data representative of ≥3 independent experiments. qRT-PCR and MFI data expressed as FC from control condition. Means ± SEMs. *p < 0.05, **p < 0.01, and ***p < 0.001 by unpaired t test.
Because we observed that Smad7 inhibition in DSS-induced colitis is associated with the enhancement of PDL2/1 in DCs and of PD1 in CD4+ T cells, we tested whether agonizing PD1 directly via PDL2-Fc and PDL1-Fc would ameliorate colitis. We found that the preclinical treatment of mice significantly ameliorates colitis and enhances recovery as determined by reduced body weight loss (Figure 5I) and decreased colonic inflammation (Figure 5J). This colitis mitigation in PDL2-Fc- or PDL1-Fc-treated mice is associated with increased colonic Foxp3 expression (Figure 5K). These data further implicate PDL2/1 signaling in suppressing colitis and demonstrate that directly enhancing PDL2/1-PD1 signaling therapeutically through the administration of PDL2/1-Fc can ameliorate a mouse model of UC.
DISCUSSION
Smad7 is one of the proteins that has been heavily implicated in immune dysregulation during IBDs. In fact, elevated colonic Smad7 has been associated with enhanced inflammation in IBD patients (Monteleone et al., 2001, 2005). Several factors could contribute to this increase in Smad7, including IL-1β, TNF-α, IFN-γ, and TGF-β (Monteleone et al., 2001). However, the exact molecular pathways by which Smad7 mediates its pathogenic functions in IBDs, including its cell type-specific functions, have not been determined. Here, we have identified critical cell populations and mechanisms underlying pathogenic Smad7 functions in colitis. Specifically, by using DC- and CD4+ T cell-specific Smad7-knockout mice, we have uncovered that Smad7 mediates intestinal inflammation by limiting PDL2/1-PD1 signaling, a major immunoregulatory axis in Treg differentiation and immune tolerance.
The PD1-PDL1 pathway plays a critical role in peripheral tolerance to protect against autoimmunity (Francisco et al., 2010). There is also considerable evidence that PDL2 inhibits lymphocyte activation by binding to PD1 (Zhang et al., 2006). Decreased PDL1 expression in intestinal APCs has been observed in IBD patients, and blocking PDL1 signaling has been found to promote intestinal inflammation both in mice and humans (Bertha et al., 2017; Reynoso et al., 2009; Robertson et al., 2016; Scandiuzzi et al., 2014; Wang et al., 2017). However, the role of PDL2 and the regulatory mechanisms that control PDL2-PD1 signaling in IBDs remain unclear. Our data demonstrate that Smad7 sustains detrimental immune responses in IBDs by inhibiting the PDL2/1-PD1 pathway via action within DCs and CD4+ T cells.
While CD103− intestinal DCs promote colitogenic immune responses in colitis, CD103+ DCs maintain intestinal homeostasis (Kourepini et al., 2014). Altered CD103+ DC frequencies have been observed in colitis patients and animal models (Kourepini et al., 2014; Matsuno et al., 2017; Wenzel et al., 2014). In fact, specific deletion of CD103+ DCs worsens colitis in mice (Muzaki et al., 2016). However, the molecular pathways that prevent the development of intestinal CD103+ DCs in IBDs remain unclear. Although TGF-βR and Smad7 deficiency are known to alter regulatory DCs (Bain et al., 2017; Lukas et al., 2017), our study has identified Smad7 as a key player in this process that limits the generation of PDL1-, PDL2-, and CD103-expressing regulatory DCs. Specifically, we describe how Smad7 restrains a TGF-β-mediated transcriptional program via Smad3. While our present findings establish that genetic deletion or pharmacological inhibition of Smad7 is of therapeutic value in colitis by enhancing CD103 and PD1 ligands on DCs, it remains to be explored which factors control Smad7 levels and govern this process in CD103− and CD103+ DCs during disease. Emerging studies suggest that several inflammatory cytokines, such as TNF-α and IL-1β, which are highly expressed by CD103− DCs (Coombes et al., 2007; Ruane and Lavelle, 2011), can limit the conversion to CD103+ DCs in the gut (Mak’Anyengo et al., 2018) while inducing Smad7 (Baugé et al., 2008). Therefore, CD103− DCs secreting these inflammatory cytokines may inherently upregulate Smad7 in an autocrine manner and become less responsive to TGF-β, which in turn could result in less PD1 ligand and CD103 expression by these DCs. A better understanding of this process could present alternative avenues for therapeutically manipulating Smad7 signaling in intestinal inflammation.
One of the major mechanisms by which intestinal CD103+ DCs mediate their protective functions in colitis is by inducing Tregs (Jaensson et al., 2008). Several context-dependent pathways have been linked to this specialization for Treg differentiation. CD103+ DCs have been shown to express higher levels of TGF-β and promote Treg differentiation, which is further enhanced by exogenous TGF-β. In addition to increased TGF-β secretion, intestinal CD103+ DCs have been shown to express more RA-metabolizing enzymes. The addition of exogenous TGF-β along with RA further promotes Treg differentiation (Coombes et al., 2007). However, a dispensable role for RA in CD103+ DCs in Treg development also exists (Worthington et al., 2011). We found no difference in RA-metabolizing enzymes in Smad7−/− DCs during colitis, suggesting that Smad7−/− DCs leverage RA-independent pathways in promoting Tregs. Another role for IDO-mediated Treg differentiation specifically in Smad7-deficient CD103+ DCs has been described in EAE (Lukas et al., 2017). IDO is strongly induced by IFN-γ (Jürgens et al., 2009), which permeates the CNS microenvironment during EAE due to a higher load of infiltrating IFN-γ-secreting Th1 cells (Fletcher et al., 2010). We found no difference in IDO in Smad7−/− DCs in colitis, implicating other pathways in promoting Tregs, such as PDL2/1-PD1 signaling, as demonstrated by our in vitro and in vivo profiling and rescue data. We found that CD103+ DCs express higher levels of PDL2 and a moderate increase in PDL1 (possibly reflecting already high baseline PDL1 expression) on their surface compared to CD103− DCs. Moreover, we revealed that preventing PDL2/1-PD1 interaction abrogates Treg induction by CD103+ DCs. Consistent with this, others have found that CD103+ DCs from tumor-draining lymph nodes express more PDL1 and contribute to immunosuppression (Salmon et al., 2016). Although PDL1 has been linked to Treg induction, we have identified a role for PDL2 in Treg differentiation and the potentially greater significance of PDL2 versus PDL1 in this context, based on the stronger association of PDL2 with CD103+ and Smad7−/− DCs.
Although PD1-blocking antibodies have transformed the management and prognosis of cancer patients, PD1 blockade-induced colitis is an increasingly recognized immune-related adverse event that shares many characteristics with IBDs, demonstrating the importance of an intact PDL2/1-PD1 axis in intestinal immune tolerance (Bertha et al., 2017; Wang et al., 2017). However, the molecular mechanisms that control the expression of PD1 during IBDs remain poorly understood. TGF-β and Smad7 deficiency are known to promote Treg development (Chen et al., 2003; Chen and Wahl, 2003; Kleiter et al., 2010). Here, we have identified a T cell-intrinsic mechanism whereby the Smad7-mediated regulation of PD1 underlies this effect on Treg differentiation, a process that is deeply intertwined with Smad7 regulation of PDL2/1 in DCs. Consistent with a recent report (Park et al., 2016), we found that TGF-β transcriptionally promotes PD1 on T cells in a Smad3-dependent manner, which is enhanced in the absence of Smad7. The adoptive transfer of Smad7-deficient CD4+ T cells confers protection against a T cell-mediated colitis model and appears to be mediated by increased PD1-mediated Treg differentiation in vivo. CD4+ Treg induction and colitis attenuation are also observed in DSS colitis in T-Smad7−/− mice. Although colonic CD8+ T cells are less abundant than CD4+ T cells in DSS colitis (Shale et al., 2013), PD1 on CD8+ T cells could be affected by Smad7 deletion (due to double CD4+CD8+ stage during thymic development) and remains to be investigated.
Elevated Smad7 has been associated with sustained inflammation in IBDs and other chronic inflammatory disorders (Kleiter et al., 2007; Monteleone et al., 2001). Antisense Smad7 oligonucleotide that specifically targets SMAD7 mRNA has been effective in patients with CD in multiple independent phase II trials (Feagan et al., 2018; Marafini et al., 2017; Monteleone et al., 2015), as well as in an IBD model (Boirivant et al., 2006). In addition, Smad7 silencing has been shown to resolve inflammation in a model of CNS autoimmunity in mice (Kleiter et al., 2007). Recently, a phase III trial with the Smad7 inhibitor Mongersen in CD was discontinued following an interim futility report despite multiple independent positive phase II results (Feagan et al., 2018; Lowe, 2017; Marafini et al., 2017; Monteleone et al., 2015). Details for this discrepancy remain unclear. The lack of clear markers of target engagement, the oral route of administration of the antisense oligonucleotide, and dose-finding based on extrapolation from preclinical models may have contributed. However, a phase II trial with the same Smad7-as in UC has shown modest success in a single-arm open-label study as measured by clinical response and endoscopic remission (ClinicalTrials.gov: ). Our results demonstrate that the specific deletion of Smad7 in DCs and T cells protects mice from a model of DSS-induced colitis resembling UC (Chassaing et al., 2014). Correspondingly, we found that Smad7-as treatment given intraperitoneally (i.p.) ameliorates DSS colitis severity, suggesting that Smad7 inhibition could be more effective in UC patients if better targeted toward these immune cells. Our promising preclinical colitis data, combined with positive safety data across all Mongersen trials, provide justification for Smad7 inhibition efficacy to be further explored. We also provide evidence complementing other reports that Smad7 inhibition ameliorates EAE (Kleiter et al., 2010; Lukas et al., 2017), which may justify consideration of this therapy in other autoimmune conditions.
In addition, our deeper understanding of Smad7 networks has identified other pathways that could be targeted against intestinal inflammation. Here, we found that Smad7 deficiency in DCs and T cells is associated with increased PDL2/1-PD1 signaling and resistance to colitis in mice. Consistent with a previous report, which only explored PDL1 (Song et al., 2015), we also show the direct functional role of PDL2/1-PD1 signaling in colitis. Enhancing PD1 signaling via administration of Fc-fused PDL1 and PDL2 is effective in reducing DSS-induced colitis severity. These data raise the self-evident prospect that direct PDL2/1 modulation may be beneficial in IBD patients. This could be pursued independent of Smad7 inhibition therapy or in combination with Smad7 inhibition. Based on our data demonstrating that Smad7 antisense increases PD1 expression on T cells, Smad7 inhibition could synergistically enhance the sensitivity to tolerogenic signals from PDL2/1-Fc or similar molecules. Our data also suggest the possibility that Smad7 inhibition therapy may be more effective in patients with defective or decreased PD1 signaling, as we found that Smad7 therapy appears to mitigate the disease severity in preclinical colitis models via the upregulation of this pathway. Such PD1 differences in patients have been shown to modulate PD1-mediated therapeutic responses in cancer (Zou et al., 2016). Underscoring the importance of properly identifying IBD patient populations for Smad7-as therapy, a recent study suggests that expression of the chemokine CCL20 in CD patients predicts the response to Mongersen (Marafini et al., 2017). PD1 and its ligands may also be explored as a biomarker for predicting the efficacy of Smad7 inhibition therapy in UC. Our data also raise the prospect of Smad7 inhibition efficacy in inflammation-driven colorectal cancer, especially considering work showing a pathogenic role for Smad7 in regulating the cell cycle in some intestinal cancer models (Halder et al., 2008; Stolfi et al., 2014). However, the relation between Smad7, PD1 signaling, and colorectal cancer remains unclear, as suggested by mixed results with PD1 inhibitors in colon cancer patients (Kalyan et al., 2018; Topalian et al., 2012) and Smad7 function in colon cancer models (Troncone and Monteleone, 2019). In summary, the present study identifies critical cell populations and mechanisms underlying pathogenic Smad7 function in IBDs and provides insights on the PDL2/1-PD1 axis and potential avenues for the therapeutic management of IBDs.
STAR★METHODS
LEAD CONTACT AND MATERIALS AVAILABILITY
Further information and requests for mouse strains, resources, and reagents should be directed to and will be fulfilled by the Lead Contact, Gopal Murugaiyan, at mgopal@rics.bwh.harvard.edu This study did not generate other new unique reagents.
EXPERIMENTAL MODEL AND SUBJECT DETAILS
Mice
C57BL/6J WT, Smad7flox/flox, CD11ccre, CD4cre, Rag-T^, and Foxp3GFP mice were purchased from Jackson Laboratory. DC-Smad7−/− (CD11c+ dendritic cell Smad7 conditional knockout) mice were created by crossing Smad7flox/flox × CD11ccre mice. T-Smad7−/− (CD4+ T cell Smad7 conditional knockout) mice were created by crossing Smad7flox/flox×CD4cre mice. Smad3−/− mice were obtained from Dr. Maggio-Price (University of Washington, Seattle). All mice were age- (6–8 weeks old at the start of experiments) and sex-matched (both male and female mice were used). Littermate controls were used where appropriate. Mice were maintained in specific pathogen-free animal facilities at the Harvard Institutes of Medicine at Harvard Medical School (Boston, MA) and the Hale Building for Transformative Medicine at Brigham and Women’s Hospital (Boston, MA). Mice were housed with food and water ad libitum. All experiments were in accordance with guidelines from the Institutional Animal Care and Use Committee at Brigham and Women’s Hospital.
METHOD DETAILS
DSS-induced colitis
Mice received 3% (36,000–50,000 M.Wt.) DSS (MP Biomedicals) in drinking water for 7 days. Body weight loss as a clinical sign of colitis was recorded daily. Mice that showed excessive body weight loss (> 25%) or signs of rectal prolapse were euthanized. Final body weight scores at euthanasia were recorded for the remainder of monitoring where appropriate. Disease activity index including weight loss, the presence of blood in stool, and stool consistency, was calculated daily as has been previously described (Kim et al., 2012). Each mouse was scored from 0–4 according to the following criteria. Weight Loss. 0: < 1%; 1: 1%–5%; 2: 5%–10%; 3: 10%–15%; 4: >15%. Bleeding. 0: Normal (hemoccult negative, no visible blood in stool); 1: Hemoccult positive (hemoccult positive, no visible blood in stool); 2: Slightly visible blood in stool (hemoccult positive, visible blood in stool with reddish hue upon smear); 3: Visible blood in stool (hemoccult positive, obvious blood in stool, but no incrustation around anus); 4: Gross bleeding (fresh extensive blood around anus or encrusted on fur). Stool Consistency. 0: Normal (well-formed pellet, solid); 1: Soft (well-formed pellet, soft); 2: Pasty (semi-formed pellet, readily becomes paste upon handling); 3: Loose (poorly formed pellet, readily becomes paste upon handling); 4: Diarrhea (no pellet formation, and/or liquid stools). Guaiac fecal occult blood tests were used to detect blood in stool (ColoScreen, Helena Laboratories). Final scores were determined by summing these three individual scores. Colonic lengths were measured immediately after colons were excised. For histopathological analysis, colons were excised, flushed with PBS, opened longitudinally, arranged in Swiss rolls, and fixed in 10% buffered formalin. They were then embedded in paraffin, sectioned (6–10 μm), and stained with hematoxylin/eosin (H&E) according to standardized protocols. Sections were blindly scored by a pathologist at the Harvard Rodent Histopathology Core Facility (HRHCF) from 0–4 based on degree of ulceration, loss of crypt architecture, and amount of inflammatory infiltrates. Slides were imaged using an Aperio eSlide Scanner (Leica Biosystems).
Smad7-as and PDL1/2-Fc treatment of colitis
We used a 21-base Smad7 antisense oligonucleotide with the sequence 5′-GTC GCC CCT TCT CCC CGC AGC-3′ complementary to the mRNA of Smad7 (purchased from Integrated DNA Technology). The same sequence Smad7-as inhibitor has previously been validated by others in vitro and in vivo in models of Crohn’s disease (CD) (Boirivant et al., 2006) and neuroinflammation (Kleiter et al., 2007), and in CD patients (Monteleone et al., 2001). Mice were treated with Smad7-as or oligonucleotide control inhibitor i.p. (250 μg/mouse/day) in PBS every other day for four days at the beginning of a 7 day 3% DSS colitis induction, as indicated in Figure 5A. For PDL1/2-Fc treatment, mice were treated with PDL1-Fc, PDL2-Fc, or Ig control (R&D systems) i.p. (20 μg/mouse/day) every other day for four days at the beginning of a 7 day 3% DSS colitis induction, as indicated in Figure 5A.
CD4+CD45RBhi T cell transfer colitis
CD4+CD45RBhi T cells were isolated via flow cytometry from donor mice. Recipient Rag1−/− mice were injected i.p. with 5 × 10⁶ T cells and monitored for 7 weeks. Colitis was monitored and scored as detailed above.
EAE
Female mice were injected s.c. into both flanks with 100 μg MOG35–55 peptide (Genemed Synthesis) dissolved in PBS, emulsified in an equal volume of CFA (Difco), supplemented with 5 mg/ml Mycobacterium tuberculosis H37Ra. Mice were also injected twice i.p. with 200 ng pertussis toxin (PT) (List Biological Laboratories) administered on the day of immunization and 48 h later. Clinical assessment of EAE was performed daily after disease induction according to the following criteria: 0, no disease; 1, tail paralysis; 2, hind limb weakness or partial paralysis; 3, complete hind limb paralysis; 4, forelimb and hind limb paralysis; 5, moribund state. Mean clinical scores on separate days were calculated by adding the scores of individual mice and dividing by the total number of mice in each group, including mice that did not develop signs of EAE. For histopathological studies, spinal cords were excised, fixed in 10% formalin in PBS, embedded in paraffin, sectioned (6–10 μm thick), and stained with H&E or Luxol fast blue. Stained sections were evaluated for immune cell infiltration and demyelination by a pathologist at the Harvard Rodent Histopathogy Core Facility (HRHCF).
Generation and isolation of DCs and T cells
DCs were derived from bone marrow (BM) progenitor cells. In brief, femoral and tibial cells were harvested in DC culture medium (IMDM medium, 10% FBS, 100 U/ml penicillin, 100 μg/ml streptomycin, 55 μM β-mercaptoethanol, 20 ng/mL GM-CSF, and 10 ng/mL IL-4) and seeded in 24-well plates at a density of 1 × 10⁶ cells/ml/well. Culture medium was replaced with fresh medium after 3 days. On days 5–6, dislodged cells were used as BM-derived DCs. Splenic and mesenteric lymph node (MLN) DCs were isolated using magnetic CD11c beads according to the manufacturer’s instructions (Miltenyi Biotec) or sorted via flow cytometry. T cells from the lamina propria were isolated from colonic segments as has been previously described (David et al., 2017).
TGF-β ELISA
Ex vivo-isolated DCs were cultured in serum-free media for 60 h. Cell-free supernatants were assayed for TGF-β by ELISA using the mouse TGF-β1 DuoSet ELISA (R & D systems). For autocrine induction of TGF-β, ex vivo-isolated DCs were stimulated with or without TGF-β (0.5 ng/mL) in serum-free media for 12 h, extensively washed, and cultured for another 48 h. Cell-free supernatants were assayed for TGF-β by ELISA.
DC-T cell co-culture
For DC-T cell co-cultures, naive CD4+ T cells were isolated from the spleens of Foxp3GFP mice via negative selection of magnetically labeled cells according to the manufacturer’s instructions (Naive CD4+ T Cell Isolation Kit, Miltenyi Biotec). CD4+ T cells were then co-cultured with CD11c+ DCs isolated from Smad7fl/fl and DC-Smad7−/− mice at a 1:3 DC:T cell ratio in U-bottom 96-well plates. TGF-β (0.5 ng/mL) was added to Treg-polarizing conditions immediately upon setting DC-T cell co-cultures. All cells were cultured in X-VIVO serum-free media.
T cell culture
For Treg differentiation with T cells alone, plates (96-well flat-bottom) were coated for a minimum of 2 hr at 37°C with anti-CD3 and anti-CD28 (2 μg/mL), along with either PDL1-Fc or PDL2-Fc (30–100 μg/mL). Plates were washed with PBS and then T cells were added in the presence or absence of TGF-β (0.5 ng/mL) and cultured for 4 days. All cells were cultured in complete IMDM (IMDM medium, 10% FBS, 100 U/ml penicillin, 100 μg/mL streptomycin, 55 μM β-mercaptoethanol). To analyze PD1, plates (96-well flat-bottom) were coated for a minimum of 2 hr at 37°C with low-dose anti-CD3 and anti-CD28 (0.5 μg/mL). Plates were washed with PBS and then T cells were added in the presence or absence of TGF-β (2.5 ng/mL) and cultured for 18 h.
RNA isolation, cDNA synthesis, and quantitative Real-Time PCR
Total RNA was isolated from cell pellets using the RNeasy Plus Micro Kit (Qiagen) and stored at −80°C. First-strand cDNA synthesis was performed for each RNA sample from 0.5 to 1 μg of total RNA using Taqman reverse transcription reagents. cDNA was amplified via sequence-specific FAM-labeled primers: IL-17a, Mm00439618_m1; TNF-α, Mm00443258_m1; IL-23, Mm01160011_m1; IL-12, Mm99999066_m1; IL-6, Mm99999064_m1; IL-1β, Mm01336189_m1; TGF-β, Mm03024053_m1; CD103/Itgae, Mm00434443_m1; IFN-γ, Mm01168134_m1; Foxp3, Mm00475162_m1; IL-18, Mm00434226_m1 (Applied Biosystems) and real-time PCR mix (Applied Biosystems) on an ABI7500 cycler. GAPDH gene: Gapdh, Mm99999915_g1, was used as an endogenous control to normalize for differences in the amount of total RNA in each sample. All qRT-PCR reactions were performed in duplicate. All values were calculated as fold changes relative to the expression of GAPDH, then presented as fold changes from relevant experimental conditions.
TGF-β signaling in DSS-induced colitis in Smad7fl/fl and DC-Smad7−/− mice was analyzed using the mouse TGF-β BMP Signaling Pathway RT2 Profiler PCR Array (Qiagen). Samples were processed and analyzed according to the manufacturer’s instructions.
NanoString
The nCounter Analysis System (NanoString Technologies) utilizes a digital barcode technology for direct multiplexed measurement of analytes and offers high levels of precision and sensitivity, including profiling hundreds of target transcripts from a single sample (https://www.nanostring.com). One hundred ng of RNA per sample were analyzed using the preassembled nCounter Immunology Panels and the nCounter system according to the manufacturer’s instructions. Data were normalized and analyzed using nSolver software via the geometric mean of included housekeeping genes. Genes were arranged from most to least upregulated, and a representative selection of relevant genes of interest were shown.
Promoter analysis
In silico promoter analysis: Mouse Pdcdl2, Pdcdl1, and Itgae promoters were obtained from promoter databases from the UCSC genome browser or CSHL promoter database. These sequences were searched for Smad3 binding sites using PROMO (a web-based algorithm for the prediction of transcription factor binding sites, Alggen: http://alggen.lsi.upc.es/) (Farrée et al., 2003; Messeguer et al., 2002).
ChIP assays
ChIP (chromatin immunoprecipitation) was performed using the Magna ChIP G Kit per the manufacturer’s instructions (EMD Millipore, Billerica, MA) with some modifications as described previously(Ajay et al., 2014). Approximately 1×10⁶ isolated splenic dendritic cells were treated with 10 ng/mL TGF-β for 12 h. DNA was cross-linked with protein by adding 900 μL freshly diluted 1% formaldehyde/protease inhibitor in PBS. Sonication was performed to obtain DNA fragments ranging from 200 to 1000 bp. Samples were spun at 10,000×g at 4°C for 10 min, and 500 μg protein was used in 500 mL volume for IP with 2 μg SMAD3 or normal rabbit IgG (negative control). Five μg (1%) of protein from each sample was frozen in 80°C as input. Protein G magnetic bead-antibody/chromatin complex were separated by magnetic rack and washed with 500 mL low-salt immune complex wash buffer, high-salt immune complex wash buffer, LiCl immune complex wash buffer, and tris-ethylenediaminetetraacetic acid buffer. One hundred μl of ChIP elution buffer/proteinase K was added in IP, as well as input samples, and incubated at 62°C for 2 h with shaking. Proteinase K was denatured by heating at 95°C for 10 min. For IP samples, protein G magnetic beads were separated by a magnetic separator rack, and supernatant was used for DNA purification. Five μl of purified DNA was used for real-time PCR using promoter-specific primers of Pdcd1, Pdcdl1, Pdcdl2, Itgae, and Gapdh (normalizer). Fold calculations were performed and plotted.
Promoter-specific primers used for ChIP assay
- Mouse Pdcdl1
- Forward 5′-GGG AGT CCT TGA GTA TTT GGT GC
- Reverse 5′-ATG TTT GCT CGG CTT CCT GG
- Mouse Pdcdl2
- Forward 5′-GGG AGT CCT TGA GTA TTT GGT GC
- Reverse 5′-ATG TTT GCT CGG CTT CCT GG
- Mouse Itgae
- Forward 5′-GGG AGT CCT TGA GTA TTT GGT GC
- Reverse 5′-ATG TTT GCT CGG CTT CCT GG
- Mouse Pdcd1
- Forward 5′ agg ccc agg gtc ttt ctg aa
- Reverse 5′ ttc aga aag acc ctg ggc ct
Luciferase assays
a. Firefly Luciferase assay: For Pdcdl1 and Itgae luciferase assays, 70%–80% confluent HEK293 cells were co-transfected with pCMV6 or pCMV6 SMAD3, pRL-GAPDH (gift from Dr. Matthias Brock, Center of Experimental Rheumatology, University Hospital Zurich, Zurich, Switzerland) and pGL3Pdcdl1Luc or pGL3ItgaeLuc plasmid using Lipofectamine 2000 transfection reagent (Thermo Fisher Scientific, Waltham, MA per the manufacturer’s instruction), washed 6 h post-transfection, and incubated for 48 h. For TGF-β treatment cells were transfected with respective luciferase plasmids and incubated for 24 h. Cells were then treated with 10 ng/mL of TGF-β and incubated for additional 48 h. Then cells were lysed by passive lysis buffer, and luminescence was measured using the Dual-Glo Luciferase Assay System (Promega Corporation) on a Veritas Luminometer (Turner Biosystems, Sunnyvale, CA). Pdcdl1 and Itgae Luciferase readings (Firefly luciferase) were normalized to GAPDH Luciferase (Renilla luciferase) readings, and fold change was calculated compared with control-transfected cells.
b. Secrete pair Gaussia Luciferase (GLuc) assay (Genecopoeia, Rockville, MD)
Measurement of GLuc: For Pdcdl2 and Pdcd1 Luciferase activity, we used Secrete Pair Luciferase assay per the manufacturer’s instruction. Briefly, HEK293 cells were co-transfected with pCMV6 or pCMV6 SMAD3 and Pdcl2GLuc plasmids as described above. TGF-β treatment was performed as described above. After 48 h, 200 μL of medium was collected. A100 μL of Buffer GL-S containing GLuc substrate was incubated for 25 min at room temperature and medium was added to the substrate solution, and luminescence was measured.
Measurement of AP: Fifty μL of culture medium from GLuc Assay was heated at 65°C for 10 min, and then placed on ice. AP buffer containing AP substrate was added to 10 μL medium and luminescence was measured. The GLuc measurement was normalized to AP measurements and plotted as fold change to pCMV6-and Pdcdl2-transfected control cells. All of these experiments were done in triplicates and luciferase measurements were done in duplicates.
QUANTIFICATION AND STATISTICAL ANALYSIS
Statistics
Statistical analyses were performed using an unpaired 2-tailed Student’s t test. A p value of less than 0.05 was considered statistically significant. Data are presented as the mean ± SEM. For EAE clinical scores and colitis body weight change scores, groups were compared using linear regression analysis. Please see individual figure captions for more details. Nanostring nSolver software was used for Nanostring data analysis. GraphPad Prism 8 software was used for all other analyses.
DATA AND CODE AVAILABILITY
The raw data supporting the current study are available from the Lead Contact upon request. All software is commercially available.
Supplementary Material
KEY RESOURCES TABLE.
| REAGENT OR RESOURCE | SOURCE | IDENTIFIER |
|---|---|---|
| Antibodies | ||
| Ultra-LEAF™ purified anti-mouse CD3(17A2) | BioLegend | Cat#100238; RRID: AB_1877072 |
| anti-mouse CD3/FITC(17A2) | BioLegend | Cat#100203; RRID: AB_312660 |
| anti-mouse CD4/APC(GK1.5) | BioLegend | Cat#100412; RRID: AB_312697 |
| anti-mouse CD4/PE (GK1.5) | Biolegend | Cat#116005; RRID: AB_313690 |
| Ultra-LEAF™ purified anti-mouse CD28 (37.51) | Biolegend | Cat#102115; RRID: AB_11150408 |
| anti-mouse PD1/PE(29F.1A12) | BioLegend | Cat#135206; RRID: AB_1877231 |
| anti-mouse PDL1/PE (10F.9G2) | BioLegend | Cat#124308; RRID: AB_2073556 |
| anti-mouse PDL2/PE (TY25) | BioLegend | Cat#107206; RRID: AB_2162011 |
| anti-mouse PDL2/APC | BioLegend | Cat#107210; RRID: AB_2566345 |
| anti-mouse I-Ab/PE (AF6–120) | BioLegend | Cat#116408; RRID: AB_313727 |
| anti-mouse CD103/PE(2E7) | BioLegend | Cat#121406; RRID: AB_1133989 |
| anti-mouse CD103/APC(2E7) | BioLegend | Cat#121414; RRID: AB_1227502 |
| anti-mouse Foxp3/Alexa Fluor 647 (150D) | BioLegend | Cat#320013; RRID: AB_439749 |
| anti-mouse IL-17/APC (TC11–18H10.1) | BioLegend | Cat#506916; RRID: AB_536018 |
| anti-mouse IFN-γ/PE (XMG 1.2) | BioLegend | Cat#505808; RRID: AB_315402 |
| Anti-mouse CD45RB/PE (C363–16A) | Cat#103308; RRID: AB_313015 | |
| anti-mouse NK1.1/FITC (PK136) | BioLegend | Cat#108706; RRID: AB_313393 |
| anti-mouse B220/FITC (RA3–6B2) | BioLegend | Cat#103206; RRID: AB_312991 |
| anti-mouse CD11c/APC (N418) | BioLegend | Cat#117310; RRID: AB_313779 |
| anti-mouse CD11c/PE (N418) | BioLegend | Cat#117308; RRID: AB_313777 |
| anti-mouse Phospho-Smad2/3 | Cell-signaling Technology | Cat#8828S; RRID: AB_2631089 |
| Experimental Models: Organisms/Strains | ||
| Mouse: B6.Cg-Smad7tm1.1Ink/J | Jackson Laboratory | Stock#017008 |
| Mouse: Tg(Cd4-cre)1Cwi/BfluJ | Jackson Laboratory | Stock#017336 |
| Mouse: B6.Cg-Tg(Itgax-cre)1–1Reiz/J | Jackson Laboratory | Stock#008068 |
| Mouse: Pdcd1tm1.1Shr/J | Jackson Laboratory | Stock#021157 |
| Mouse: B6.129S7-Rag1tm1Mom/J | Jackson Laboratory | Stock#002216 |
| Mouse: Foxp3GFP | Jackson Laboratory | Stock#006769 |
| Mouse: C57BL/6J | Jackson Laboratory | Stock#000664 |
| Mouse: Smad3−/− | Dr. Maggio-Price University of Washington, Seattle | N/A |
| Experimental Models: Cell Lines | ||
| HEK293 | ATCC | ATCC® CRL-1573 |
| Recombinant Proteins | ||
| Mouse PDL1-Fc Chimera Protein, CF | R&D systems | Cat#1019-B7–100 |
| Mouse PDL2-Fc Chimera Protein, CF | R&D systems | Cat#1022-PL-100 |
| GM-CSF | R&D systems | Cat#415-ML-010 |
| IL-4 | R&D systems | Cat#404-ML-010 |
| TGF-β | R&D systems | Cat#240-B-002 |
| Chemicals and Peptides | ||
| MOG35–55 peptide | Genemed Synthesis Inc | N/A |
| Dextran Sulfate Sodium Salt (Jaensson et al.)-Colitis Grade (36,000–50,000 MW) | MP Biomedicals | Cat#9011–18–1 |
| Complete Freund’s Adjuvant (CFA) | Difco | N/A |
| Pertussis toxin (PT) | List Biological Laboratories | Cat#180 |
| Critical Commercial Assays | ||
| RNeasy Plus Micro Kit | Qiagen | Cat#74034 |
| RNeasy Mini Kit | Qiagen | Cat#74106 |
| TGF-β BMP Signaling Pathway RT2 Profiler PCR Array | Qiagen | Cat#PAMM-035Z |
| nCounter® Immunolgy Panel (Mouse) | Nanostring | Cat#XT-CSO-MIMI-12 |
| Naive CD4+ T cell isolation Kit, mouse | Miltenyi Biotec | Cat#130–104–453 |
| CD11c Microbeads UltraPure, mouse | Miltenyi Biotec | Cat#130–108–338 |
| CD4(L3T4) Microbeads, mouse | Miltenyi Biotec | Cat#130–117–043 |
| Dual-Glo® Luciferase Assay System | Promega Corporation | Cat#E2920 |
| Secrete-Pair Gaussia Luciferase Assay Kit | GeneCopoeia | Cat#LF061 |
| eBioscience Foxp3 Transcription Factor staining kit | Thermo Fisher | Cat#00–5523–00 |
| Magna ChIP™ G- Chromatin Immunoprecipitation kit | EMD Millipore | Cat#17–611 |
| Mouse TGF-beta 1 DuoSet ELISA | R&D systems | Cat#DY1679 |
| Lipofectamine 2000 Transfection Reagent | Thermo Fisher | 11668019 |
| Oligonucleotides | ||
| Pdcd1 Forward, GGG AGT CCT TGA GTA TTT GGT GC | Integrated DNA Technologies | N/A |
| Pdcd1 Reverse, ATG TTT GCT CGG CTT CCT GG | Integrated DNA Technologies | N/A |
| Pdcdl2 Forward, GGG AGT CCT TGA GTA TTT GGT GC | Integrated DNA Technologies | N/A |
| Pdcdl2 Reverse, ATG TTT GCT CGG CTT CCT GG | Integrated DNA Technologies | N/A |
| Itgae Forward, GGG AGT CCT TGA GTA TTT GGT GC | Integrated DNA Technologies | N/A |
| Itgae Reverse, ATG TTT GCT CGG CTT CCT GG | Integrated DNA Technologies | N/A |
| Pdcd1 Forward, AGG CCC AGG GTC TTT CTG AA | Integrated DNA Technologies | N/A |
| Pdcd1 Reverse, TTC AGA AAG ACC CTG GGC CT | Integrated DNA Technologies | N/A |
| Smad7-antisense 5′-GTC GCC CCT TCT CCC CGC AGC-3′ | Integrated DNA Technologies | N/A |
| Software | ||
| PRISM Version 8 | Graphpad | https://www.graphpad.com/scientific-software/prism/ |
| FlowJo Version 10 | Tree Star | https://www.flowjo.com/solutions/flowjo/downloads |
| Adobe Creative Cloud | Adobe | https://www.adobe.com/creativecloud.html |
| NanoString nSolver 4 | NanoString | https://www.nanostring.com/products/analysis-software/nsolver |
| Aperio eSlide Manager | Leica Biosystems | https://www.leicabiosystems.com/digital-pathology/manage/aperio-eslide-manager/ |
Highlights.
Within DCs, Smad7 inhibits PD1 ligands, CD103, and TGF-β, limiting Treg induction
Within CD4+ T cells, Smad7 inhibits PD1, limiting PD1-mediated Treg differentiation
Smad7 deficiency in DCs or T cells mitigates DSS and T cell transfer colitis models
Smad7-antisense inhibitor, or agonizing PD1 via PDL1/2-Fc, ameliorates colitis
ACKNOWLEDGMENTS
We thank Dr. Lillian Maggio-Price (University of Washington, Seattle) for Smad3−/− mice and Dr. Matthias Brock (University Hospital Zurich, Switzerland) for the pCMV6, pCMV6 SMAD3, and pRL-GAPDH constructs. This study was supported by the NIH (R01AI127853 to G.M.) and the National Multiple Sclerosis Society (RG 1507–05164 to G.M.).
Footnotes
DECLARATION OF INTERESTS
The authors declare no competing interests.
SUPPLEMENTAL INFORMATION
Supplemental Information can be found online at https://doi.org/10.1016/j.celrep.2019.07.065.
REFERENCES
- Afrakhte M, Morén A, Jossan S, Itoh S, Sampath K, Westermark B, Heldin CH, Heldin NE, and ten Dijke P (1998). Induction of inhibitory Smad6 and Smad7 mRNA by TGF-beta family members. Biochem. Biophys. Res. Commun 249, 505–511. [DOI] [PubMed] [Google Scholar]
- Ajay AK, Kim TM, Ramirez-Gonzalez V, Park PJ, Frank DA, and Vaidya VS (2014). A bioinformatics approach identifies signal transducer and activator of transcription-3 and checkpoint kinase 1 as upstream regulators of kidney injury molecule-1 after kidney injury. J. Am. Soc. Nephrol 25, 105–118. [DOI] [PMC free article] [PubMed] [Google Scholar]
- Bain CC, Montgomery J, Scott CL, Kel JM, Girard-Madoux MJH, Martens L, Zangerle-Murray TFP, Ober-Blöbaum J, Lindenbergh-Kortleve D, Samsom JN, et al. (2017). TGFβR signalling controls CD103+CD11b+ dendritic cell development in the intestine. Nat. Commun 8, 620. [DOI] [PMC free article] [PubMed] [Google Scholar]
- Baugé C, Attia J, Leclercq S, Pujol JP, Galéra P, and Boumédiene K (2008). Interleukin-1beta up-regulation of Smad7 via NF-kappaB activation in human chondrocytes. Arthritis Rheum. 58, 221–226. [DOI] [PubMed] [Google Scholar]
- Bertha M, Bellaguara E, Kuzel T, and Hanauer S (2017). Checkpoint Inhibitor-Induced Colitis: A New Type of Inflammatory Bowel Disease? ACG Case Rep. J 4, e112. [DOI] [PMC free article] [PubMed] [Google Scholar]
- Boden EK, and Snapper SB (2008). Regulatory T cells in inflammatory bowel disease. Curr. Opin. Gastroenterol. 24, 733–741. [DOI] [PubMed] [Google Scholar]
- Boirivant M, Pallone F, Di Giacinto C, Fina D, Monteleone I, Marinaro M, Caruso R, Colantoni A, Palmieri G, Sanchez M, et al. (2006). Inhibition of Smad7 with a specific antisense oligonucleotide facilitates TGF-beta1-mediated suppression of colitis. Gastroenterology 131, 1786–1798. [DOI] [PubMed] [Google Scholar]
- Bouché M, Canipari R, Melchionna R, Willems D, Senni MI, and Molinaro M (2000). TGF-beta autocrine loop regulates cell growth and myogenic differentiation in human rhabdomyosarcoma cells. FASEB J. 14, 1147–1158. [DOI] [PubMed] [Google Scholar]
- Chassaing B, Aitken JD, Malleshappa M, and Vijay-Kumar M (2014). Dextran sulfate sodium (DSS)-induced colitis in mice. Curr. Protoc. Immunol 104, 25. [DOI] [PMC free article] [PubMed] [Google Scholar]
- Chen W, and Wahl SM (2003). TGF-beta: the missing link in CD4+CD25+ regulatory T cell-mediated immunosuppression. Cytokine Growth Factor Rev. 14, 85–89. [DOI] [PubMed] [Google Scholar]
- Chen W, Jin W, Hardegen N, Lei KJ, Li L, Marinos N, McGrady G, and Wahl SM (2003). Conversion of peripheral CD4+CD25− naive T cells to CD4+CD25+ regulatory T cells by TGF-beta induction of transcription factor Foxp3. J. Exp. Med 198, 1875–1886. [DOI] [PMC free article] [PubMed] [Google Scholar]
- Coombes JL, Siddiqui KR, Arancibia-Cárcamo CV, Hall J, Sun CM, Belkaid Y, and Powrie F (2007). A functionally specialized population of mucosal CD103+ DCs induces Foxp3+ regulatory T cells via a TGF-beta and retinoic acid-dependent mechanism. J. Exp. Med 204, 1757–1764. [DOI] [PMC free article] [PubMed] [Google Scholar]
- Dalal SR, and Chang EB (2014). The microbial basis of inflammatory bowel diseases. J. Clin. Invest 124, 4190–4196. [DOI] [PMC free article] [PubMed] [Google Scholar]
- David BA, Rubino S, Moreira TG, Freitas-Lopes MA, Araujo AM, Paul NE, Rezende RM, and Menezes GB (2017). Isolation and high-dimensional phenotyping of gastrointestinal immune cells. Immunology 151, 56–70. [DOI] [PMC free article] [PubMed] [Google Scholar]
- Eastaff-Leung N, Mabarrack N, Barbour A, Cummins A, and Barry S (2010). Foxp3+ regulatory T cells, Th17 effector cells, and cytokine environment in inflammatory bowel disease. J. Clin. Immunol 30, 80–89. [DOI] [PubMed] [Google Scholar]
- Fantini MC, Becker C, Monteleone G, Pallone F, Galle PR, and Neurath MF (2004). Cutting edge: TGF-beta induces a regulatory phenotype in CD4+CD25− T cells through Foxp3 induction and down-regulation of Smad7. J. Immunol 172, 5149–5153. [DOI] [PubMed] [Google Scholar]
- Farré D, Roset R, Huerta M, Adsuara JE, Roselló L, Albià MM, and Messeguer X (2003). Identification of patterns in biological sequences at the ALGGEN server: PROMO and MALGEN. Nucleic Acids Res. 31, 3651–3653. [DOI] [PMC free article] [PubMed] [Google Scholar]
- Feagan BG, Sands BE, Rossiter G, Li X, Usiskin K, Zhan X, and Colombel JF (2018). Effects of Mongersen (GED-0301) on Endoscopic and Clinical Outcomes in Patients With Active Crohn’s Disease. Gastroenterology 154, 61–64.e6. [DOI] [PubMed] [Google Scholar]
- Fife BT, and Bluestone JA (2008). Control of peripheral T-cell tolerance and autoimmunity via the CTLA-4 and PD-1 pathways. Immunol. Rev 224, 166–182. [DOI] [PubMed] [Google Scholar]
- Fletcher JM, Lalor SJ, Sweeney CM,Tubridy N, and Mills KH (2010). T cells in multiple sclerosis and experimental autoimmune encephalomyelitis. Clin. Exp. Immunol 162, 1–11. [DOI] [PMC free article] [PubMed] [Google Scholar]
- Francisco LM, Salinas VH, Brown KE, Vanguri VK, Freeman GJ, Kuchroo VK, and Sharpe AH (2009). PD-L1 regulates the development, maintenance, and function of induced regulatory T cells. J. Exp. Med 206, 3015–3029. [DOI] [PMC free article] [PubMed] [Google Scholar]
- Francisco LM, Sage PT, and Sharpe AH (2010). The PD-1 pathway in tolerance and autoimmunity. Immunol. Rev 236, 219–242. [DOI] [PMC free article] [PubMed] [Google Scholar]
- Halder SK, Rachakonda G, Deane NG, and Datta PK (2008). Smad7 induces hepatic metastasis in colorectal cancer. Br. J. Cancer 99, 957–965. [DOI] [PMC free article] [PubMed] [Google Scholar]
- Harrison OJ, and Powrie FM (2013). Regulatory T cells and immune tolerance in the intestine. Cold Spring Harb. Perspect. Biol. 5, a018341. [DOI] [PMC free article] [PubMed] [Google Scholar]
- Izcue A, Coombes JL, and Powrie F (2009). Regulatory lymphocytes and intestinal inflammation. Annu. Rev. Immunol 27, 313–338. [DOI] [PubMed] [Google Scholar]
- Jaensson E, Uronen-Hansson H, Pabst O, Eksteen B, Tian J, Coombes JL, Berg PL, Davidsson T, Powrie F, Johansson-Lindbom B, and Agace WW (2008). Small intestinal CD103+ dendritic cells display unique functional properties that are conserved between mice and humans. J. Exp. Med 205, 2139–2149. [DOI] [PMC free article] [PubMed] [Google Scholar]
- Jürgens B, Hainz U, Fuchs D, Felzmann T, and Heitger A (2009). Interferon-gamma-triggered indoleamine 2,3-dioxygenase competence in human monocyte-derived dendritic cells induces regulatory activity in allogeneic T cells. Blood 114, 3235–3243. [DOI] [PubMed] [Google Scholar]
- Kalyan A, Kircher S, Shah H, Mulcahy M, and Benson A (2018). Updates on immunotherapy for colorectal cancer. J. Gastrointest. Oncol 9, 160–169. [DOI] [PMC free article] [PubMed] [Google Scholar]
- Kaser A, Zeissig S, and Blumberg RS (2010). Inflammatory bowel disease. Annu. Rev. Immunol 28, 573–621. [DOI] [PMC free article] [PubMed] [Google Scholar]
- Kashiwagi I, Morita R, Schichita T, Komai K, Saeki K, Matsumoto M, Takeda K, Nomura M, Hayashi A, Kanai T, and Yoshimura A (2015). Smad2 and Smad3 Inversely Regulate TGF-β Autoinduction in Clostridium butyricum-Activated Dendritic Cells. Immunity 43, 65–79. [DOI] [PubMed] [Google Scholar]
- Kim JJ, Shajib MS, Manocha MM, and Khan WI (2012). Investigating intestinal inflammation in DSS-induced model of IBD. J. Vis. Exp (60), 3678. [DOI] [PMC free article] [PubMed] [Google Scholar]
- Kleiter I, Pedré X, Mueller AM, Poeschl P, Couillard-Despres S, Spruss T, Bogdahn U, Giegerich G, and Steinbrecher A (2007). Inhibition of Smad7, a negative regulator of TGF-beta signaling, suppresses autoimmune encephalomyelitis. J. Neuroimmunol 187, 61–73. [DOI] [PubMed] [Google Scholar]
- Kleiter I, Song J, Lukas D, Hasan M, Neumann B, Croxford AL, Pedré X, Hövelmeyer N, Yogev N, Mildner A, et al. (2010). Smad7 in T cells drives T helper 1 responses in multiple sclerosis and experimental autoimmune encephalomyelitis. Brain 133, 1067–1081. [DOI] [PMC free article] [PubMed] [Google Scholar]
- Kourepini E, Aggelakopoulou M, Alissafi T, Paschalidis N, Simoes DC, and Panoutsakopoulou V (2014). Osteopontin expression by CD103-dendritic cells drives intestinal inflammation. Proc. Natl. Acad. Sci. USA 111, E856–E865. [DOI] [PMC free article] [PubMed] [Google Scholar]
- Liu H, Bakthavatsalam R, Meng Z, Li Z, Li W, Perkins JD, and Reyes J (2013). PD-L1 signal on liver dendritic cells is critical for Foxp3(+)CD4(+) CD25(+) Treg and liver tolerance induction in mice. Transplant. Proc. 45, 1853–1855. [DOI] [PubMed] [Google Scholar]
- Lowe D (2017). Mongersen Fails.https://blogs.sciencemag.org/pipeline/archives/2017/10/23/mongersen-fails.
- Lukas D, Yogev N, Kel JM, Regen T, Mufazalov IA, Tang Y, Wanke F, Reizis B, Müller W, Kurschus FC, et al. (2017). TGF-β inhibitor Smad7 regulates dendritic cell-induced autoimmunity. Proc. Natl. Acad. Sci. USA 114, E1480–E1489. [DOI] [PMC free article] [PubMed] [Google Scholar]
- Mak’Anyengo R, Duewell P, Reichl C, Hörth C, Lehr HA, Fischer S, Clavel T, Denk G, Hohenester S, Kobold S, et al. (2018). Nlrp3-dependent IL-1β inhibits CD103+ dendritic cell differentiation in the gut. JCI Insight 3, 96322. [DOI] [PMC free article] [PubMed] [Google Scholar]
- Manicassamy S, and Pulendran B (2011). Dendritic cell control of tolerogenic responses. Immunol. Rev 241, 206–227. [DOI] [PMC free article] [PubMed] [Google Scholar]
- Marafini I, Monteleone I, Dinallo V, Di Fusco D, De Simone V, Laudisi F, Fantini MC, Di Sabatino A, Pallone F, and Monteleone G (2017). CCL20 Is Negatively Regulated by TGF-β1 in Intestinal Epithelial Cells and Reduced in Crohn’s Disease Patients With a Successful Response to Mongersen, a Smad7 Antisense Oligonucleotide. J. Crohn’s Colitis 11, 603–609. [DOI] [PubMed] [Google Scholar]
- Matsuno H, Kayama H, Nishimura J, Sekido Y, Osawa H, Barman S, Ogino T, Takahashi H, Haraguchi N, Hata T, et al. (2017). CD103+ Dendritic Cell Function Is Altered in the Colons of Patients with Ulcerative Colitis. Inflamm. Bowel Dis 23, 1524–1534. [DOI] [PubMed] [Google Scholar]
- Messeguer X, Escudero R, Farré D, Núñez O, Martínez J, and Albà MM (2002). PROMO: detection of known transcription regulatory elements using species-tailored searches. Bioinformatics 18, 333–334. [DOI] [PubMed] [Google Scholar]
- Monteleone G, Kumberova A, Croft NM, McKenzie C, Steer HW, and MacDonald TT (2001). Blocking Smad7 restores TGF-beta1 signaling in chronic inflammatory bowel disease. J. Clin. Invest 108, 601–609. [DOI] [PMC free article] [PubMed] [Google Scholar]
- Monteleone G, Del Vecchio Blanco G, Monteleone I, Fina D, Caruso R, Gioia V, Ballerini S, Federici G, Bernardini S, Pallone F, and MacDonald TT (2005). Post-transcriptional regulation of Smad7 in the gut of patients with inflammatory bowel disease. Gastroenterology 129, 1420–1429. [DOI] [PubMed] [Google Scholar]
- Monteleone G, Neurath MF, Ardizzone S, Di Sabatino A, Fantini MC, Castiglione F, Scribano ML, Armuzzi A, Caprioli F, Sturniolo GC, et al. (2015). Mongersen, an oral SMAD7 antisense oligonucleotide, and Crohn’s disease. N. Engl. J. Med. 372, 1104–1113. [DOI] [PubMed] [Google Scholar]
- Murugaiyan G, da Cunha AP, Ajay AK, Joller N, Garo LP, Kumaradevan S, Yosef N, Vaidya VS, and Weiner HL (2015). MicroRNA-21 promotes Th17 differentiation and mediates experimental autoimmune encephalomyelitis. J. Clin. Invest. 125, 1069–1080. [DOI] [PMC free article] [PubMed] [Google Scholar]
- Muzaki AR, Tetlak P, Sheng J, Loh SC, Setiagani YA, Poidinger M, Zolezzi F, Karjalainen K, and Ruedl C (2016). Intestinal CD103(+) CD11b(−) dendritic cells restrain colitis via IFN-γ-induced anti-inflammatory response in epithelial cells. Mucosal Immunol. 9, 336–351. [DOI] [PMC free article] [PubMed] [Google Scholar]
- Nakae S, Suto H, Iikura M, Kakurai M, Sedgwick JD, Tsai M, and Galli SJ (2006). Mast cells enhance T cell activation: importance of mast cell co-stimulatory molecules and secreted TNF. J. Immunol. 176, 2238–2248. [DOI] [PubMed] [Google Scholar]
- Park BV, Freeman ZT, Ghasemzadeh A, Chattergoon MA, Rutebemberwa A, Steigner J, Winter ME, Huynh TV, Sebald SM, Lee SJ, et al. (2016). TGFβ1-Mediated SMAD3 Enhances PD-1 Expression on Antigen-Specific T Cells in Cancer. Cancer Discov. 6, 1366–1381. [DOI] [PMC free article] [PubMed] [Google Scholar]
- Rescigno M, and Di Sabatino A (2009). Dendritic cells in intestinal homeostasis and disease. J. Clin. Invest 119, 2441–2450. [DOI] [PMC free article] [PubMed] [Google Scholar]
- Reynoso ED, Elpek KG, Francisco L, Bronson R, Bellemare-Pelletier A, Sharpe AH, Freeman GJ, and Turley SJ (2009). Intestinal tolerance is converted to autoimmune enteritis upon PD-1 ligand blockade. J. Immunol 182, 2102–2112. [DOI] [PMC free article] [PubMed] [Google Scholar]
- Robertson J, Haas CT, Pele LC, Monie TP, Charalambos C, Parkes M, Hewitt RE, and Powell JJ (2016). Intestinal APCs of the endogenous nanomineral pathway fail to express PD-L1 in Crohn’s disease. Sci. Rep 6, 26747. [DOI] [PMC free article] [PubMed] [Google Scholar]
- Ruane DT, and Lavelle EC (2011). The role of CD103+ dendritic cells in the intestinal mucosal immune system. Front. Immunol. 2, 25. [DOI] [PMC free article] [PubMed] [Google Scholar]
- Salmon H, Idoyaga J, Rahman A, Leboeuf M, Remark R, Jordan S, Casanova-Acebes M, Khudoynazarova M, Agudo J, Tung N, et al. (2016). Expansion and Activation of CD103(+) Dendritic Cell Progenitors at the Tumor Site Enhances Tumor Responses to Therapeutic PD-L1 and BRAF Inhibition. Immunity 44, 924–938. [DOI] [PMC free article] [PubMed] [Google Scholar]
- Scandiuzzi L, Ghosh K, Hofmeyer KA, Abadi YM, Lázár-Molnár E, Lin EY, Liu Q, Jeon H, Almo SC, Chen L, et al. (2014). Tissue-expressed B7-H1 critically controls intestinal inflammation. Cell Rep. 6, 625–632. [DOI] [PMC free article] [PubMed] [Google Scholar]
- Shale M, Schiering C, and Powrie F (2013). CD4(+) T-cell subsets in intestinal inflammation. Immunol. Rev. 252, 164–182. [DOI] [PMC free article] [PubMed] [Google Scholar]
- Sharpe AH, Wherry EJ, Ahmed R, and Freeman GJ (2007). The function of programmed cell death 1 and its ligands in regulating autoimmunity and infection. Nat. Immunol. 8, 239–245. [DOI] [PubMed] [Google Scholar]
- Shi Y, and Massagué J (2003). Mechanisms of TGF-beta signaling from cell membrane to the nucleus. Cell 113, 685–700. [DOI] [PubMed] [Google Scholar]
- Song MY, Hong CP, Park SJ, Kim JH, Yang BG, Park Y, Kim SW, Kim KS, Lee JY, Lee SW, et al. (2015). Protective effects of Fc-fused PD-L1 on two different animal models of colitis. Gut 64, 260–271. [DOI] [PubMed] [Google Scholar]
- Stolfi C, De Simone V, Colantoni A, Franzè E, Ribichini E, Fantini MC, Caruso R, Monteleone I, Sica GS, Sileri P, et al. (2014). Afunctional role for Smad7 in sustaining colon cancer cell growth and survival. Cell Death Dis. 5, e1073. [DOI] [PMC free article] [PubMed] [Google Scholar]
- Tang Y, Wu X, Lei W, Pang L, Wan C, Shi Z, Zhao L, Nagy TR, Peng X, Hu J, et al. (2009). TGF-beta1-induced migration of bone mesenchymal stem cells couples bone resorption with formation. Nat. Med 15, 757–765. [DOI] [PMC free article] [PubMed] [Google Scholar]
- Tanoue T, Atarashi K, and Honda K (2016). Development and maintenance of intestinal regulatory T cells. Nat. Rev. Immunol 16, 295–309. [DOI] [PubMed] [Google Scholar]
- Topalian SL, Hodi FS, Brahmer JR, Gettinger SN, Smith DC, McDermott DF, Powderly JD, Carvajal RD, Sosman JA, Atkins MB, et al. (2012). Safety, activity, and immune correlates of anti-PD-1 antibody in cancer. N. Engl. J. Med 366, 2443–2454. [DOI] [PMC free article] [PubMed] [Google Scholar]
- Troncone E, and Monteleone G (2019). Smad7 and Colorectal Carcinogenesis: A Double-Edged Sword. Cancers (Basel) 11, E612. [DOI] [PMC free article] [PubMed] [Google Scholar]
- Wang PF, Chen Y, Song SY, Wang TJ, Ji WJ, Li SW, Liu N, and Yan CX (2017). Immune-Related Adverse Events Associated with Anti-PD-1/PD-L1 Treatment for Malignancies: A Meta-Analysis. Front. Pharmacol. 8, 730. [DOI] [PMC free article] [PubMed] [Google Scholar]
- Wenzel UA, Magnusson MK, Rydström A, Jonstrand C, Hengst J, Johansson ME, Velcich A, Öhman L, Strid H, Sjövall H, et al. (2014). Spontaneous colitis in Muc2-deficient mice reflects clinical and cellular features of active ulcerative colitis. PLoS One 9, e100217. [DOI] [PMC free article] [PubMed] [Google Scholar]
- Worthington JJ, Czajkowska BI, Melton AC, and Travis MA (2011). Intestinal dendritic cells specialize to activate transforming growth factor-β and induce Foxp3+ regulatory T cells via integrin αvβ8. Gastroenterology 141, 1802–1812. [DOI] [PMC free article] [PubMed] [Google Scholar]
- Yogev N, Frommer F, Lukas D, Kautz-Neu K, Karram K, Ielo D, von Stebut E, Probst HC, van den Broek M, Riethmacher D, et al. (2012). Dendritic cells ameliorate autoimmunity in the CNS by controlling the homeostasis of PD-1 receptor(+) regulatory T cells. Immunity 37, 264–275. [DOI] [PubMed] [Google Scholar]
- Zhang Y, Chung Y, Bishop C, Daugherty B, Chute H, Holst P, Kurahara C, Lott F, Sun N, Welcher AA, and Dong C (2006). Regulation of T cell activation and tolerance by PDL2. Proc. Natl. Acad. Sci. USA 103, 11695–11700. [DOI] [PMC free article] [PubMed] [Google Scholar]
- Zou W, Wolchok JD, and Chen L (2016). PD-L1 (B7-H1) and PD-1 pathway blockade for cancer therapy: Mechanisms, response biomarkers, and combinations. Sci. Transl. Med 8, 328rv4. [DOI] [PMC free article] [PubMed] [Google Scholar]
Associated Data
This section collects any data citations, data availability statements, or supplementary materials included in this article.
Supplementary Materials
Data Availability Statement
The raw data supporting the current study are available from the Lead Contact upon request. All software is commercially available.