Abstract
Purpose:
Large cell neuroblastoma (LCN) are frequently seen in recurrent, high-risk neuroblastoma but are rare in primary tumors. LCN, characterized by large nuclei with prominent nucleoli, predict a poor prognosis. We hypothesize that LCN can be created with high-dose intra-tumoral chemotherapy and identified by a digital analysis system.
Methods:
Orthotopic mouse xenografts were created using human neuroblastoma and treated with high-dose chemotherapy delivered locally via sustained-release silk platforms, inducing tumor remission. After recurrence, LCN populations were identified on H&E sections manually. Clusters of typical LCN and non-LCN cells were divided equally into training and test sets for digital analysis. Marker-controlled watershed segmentation was used to identify nuclei and characterize their features. Logistic regression was developed to distinguish LCN from non-LCN.
Results:
Image analysis identified 15,000 nuclei and characterized 70 nuclear features. A 19-feature model provided AUC>0.90 and 100% accuracy when >30% nuclei/cluster were predicted as LCN. Overall accuracy was 87%.
Conclusions:
We recreated LCN using high-dose chemotherapy and developed an automated method for defining LCN histologically. Features in the model provide insight into LCN nuclear phenotypic changes that may be related to increased activity. This model could be adapted to identify LCN in human tumors and correlated with clinical outcomes.
Keywords: Neuroblastoma, Large cell neuroblastoma, KELLY, SKNAS, Intra-tumoral chemotherapy, Orthotopic xenograft
1. INTRODUCTION
Neuroblastoma is the most common extracranial solid tumors in children, accounting for 6.3% of malignancies in children under 15 years [1, 2]. It is also the most frequently diagnosed malignancy in infancy, accounting for more than 21% of malignancies in children under one year of age [1]. While the overall five-year survival rate has improved to 74.8% over the last 40 years, high-risk neuroblastoma remains difficult to treat and has a long-term survival of <50% despite aggressive, multimodal treatment strategies [1, 3].
In 2009, the International Neuroblastoma Risk Group (INGR) established a classification system based on clinical criteria and tumor characteristics [4]. To date, high-risk neuroblastoma presents several challenges for treating clinicians and surgeons despite advances in treatment. Even with multi-agent chemotherapy, between 20–30% of tumors do not respond completely to induction therapy [5]. In patients that do initially respond to chemotherapy, Park et al. found that tumors recur in 20–30% of cases [6]. There is wide variability in the surgical approach to these patients, with many surgeons opting for a less extensive resection because of tumor location or locally advanced disease. There is, however, evidence that suggests that progression-free, event-free, and overall survival improve after a complete resection, particularly in the high-risk subset of patients [7].
Within the high-risk MYC family-driven (high MYCN and MYC expression) neuroblastomas, large cell neuroblastoma (LCN) have been identified as a distinct phenotype [8]. LCN are poorly differentiated or undifferentiated cells that exhibit sharply outlined and large “euchromatin-rich” nuclei. The open nuclei with prominent nucleoli closely resemble cancer stem cells histologically, and LCN express higher levels of MYCN and MYC protein than other MYC family-driven neuroblastomas [9]. These features are thought to contribute to the very poor prognosis that is associated with LCN [10, 11].
We previously demonstrated tumor transformation in a subset of MYC family-driven orthotopic neuroblastoma xenografts treated with intra-tumoral chemotherapy [12]. In particular, tumors that were treated to remission (defined as arrest of tumor growth for at least 25 days) and subsequently relapsed were found to have undergone LCN histopathological transformation. In this work, we hypothesized that LCN can be replicated in multiple MYC family-driven orthotopic neuroblastoma xenografts using various high-dose intra-tumoral chemotherapies. We also aimed to develop an objective and reliable method of identifying and quantifying LCN within histologic specimens using a digital analysis system.
2. METHODS AND MATERIALS
2.1. Cell culture
MYCN-amplified and non-MYCN-amplified human neuroblastoma cells were used for this study. KELLY (Sigma-Aldrich, St. Louis, MO) and SKNAS (American Type Culture Collection, Manassas, VA) cells overexpress MYCN and MYC proteins, respectively. All cells were maintained in RPMI 1640 (HyClone, Logan, UT) and supplemented with 5% fetal bovine serum, 1% OPI, L-glutamine (2 mM final) and 250 µL Gentamycin (10 µg/mL final). Cells were grown at 37 °C in a 5% CO2 atmosphere and passaged using 0.5% EDTA in phosphate buffered saline (PBS) when they reached 80% confluence.
2.2. Murine orthotopic neuroblastoma model and ultrasound monitoring
All animal procedures were performed in accordance with the National Institutes of Health’s protocols on Humane Care and Use of Laboratory Animals and approved by Stanford University’s Institutional Animal Care and Use Committee (Protocol No. 32942). Orthotopic xenografts were established in adult female NCr nude mice (Harlan, Indianapolis, IN) as previously described [12]. In brief, seven-week-old mice were anesthetized with xylazine and ketamine and a left flank incision was made just below the ribs. One million (106) neuroblastoma cells in two µL PBS were injected into the left adrenal gland. The incision was closed in two layers. The tumor volumes were subsequently measured with serial ultrasound using a high frequency probe (VisualSonics Vevo 2100, Toronto, Ontario, Canada) and three-dimensional reconstruction software (Vevo Software Version 1.6.0, Toronto, Ontario, Canada) as previously described [13].
2.3. Silk platform fabrication, drug loading, intra-tumoral treatment
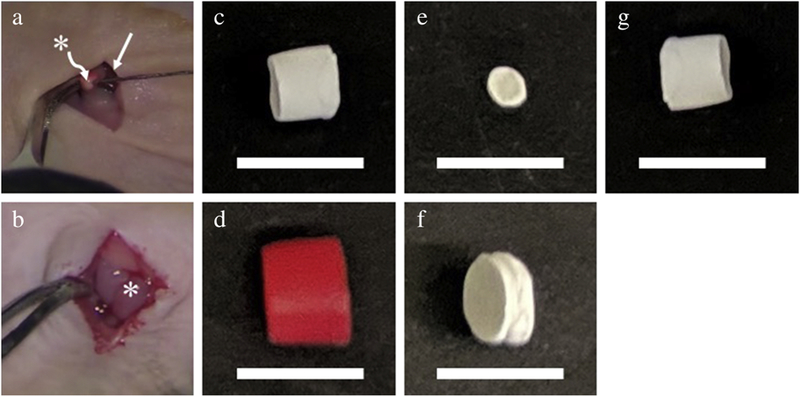
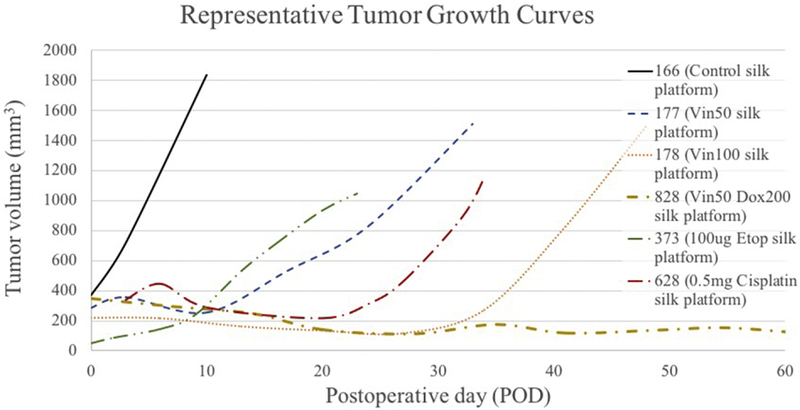
Orthotopic neuroblastoma tumors were treated with an intra-tumoral silk platform that was loaded with either high-dose vincristine, cisplatin or etoposide. Empty, unloaded silk-platforms were also implanted into orthotopic tumors to serve as controls (Figure 1). The method of drug loading, quantifying drug release in vitro and surgical implantation of drug-loaded silk platform have been previously described in our recent publications [12–14]. In brief, after orthotopic tumors reached at least 100 mm3 by ultrasound, mice were briefly anesthetized with xylazine and ketamine. The tumor was exposed through a left flank incision and chemotherapy-loaded silk platforms were implanted into the tumor. Treatment groups included silk platforms loaded with 50 µg vincristine, 100 µg vincristine, a combination of 50 µg vincristine with 200 µg doxorubicin, 0.5 mg cisplatin and 100 µg etoposide (Figure 1). The incision was then closed in layers and tumor growth was followed with twice-weekly ultrasound.
Figure 1.

Injection of human neuroblastoma cells within (a) mouse adrenal gland to generate (b) orthotopic tumor. Tumor is subsequently treated with (c) vincristine-loaded, (d) vincristine-doxorubicin-loaded, (e) etoposide-loaded, (f) cisplatin-loaded, or (g) control silk platform implanted within the tumor. Straight arrow (→) points to the kidney; asterisk (*) indicates adrenal gland and orthotopic neuroblastoma tumor in (a) and (b), respectively. Scale bars represent one (1) cm in (c-g).
2.4. Histology and identification of LCN populations
Once orthotopic neuroblastoma tumor volumes exceeded 1,000 mm3, mice were sacrificed and tumor specimens were fixed in 10% formalin, embedded in paraffin, sectioned and stained with hematoxylin and eosin (H&E). H&E sections from KELLY and SKNAS orthotopic xenografts were digitally imaged using an Aperio Digital Pathology Slide Scanner at 200x magnification (Leica Microsystems, Wetzlar, Germany). Scanned images were analyzed by a single pathologist (N.I.) with expertise in neuroblastoma using the Aperio ImageScoop software to manually identify and outline clusters of LCN and non-LCN populations on H&E sections.
2.5. Digital analysis and regression modeling
Forty-five H&E image tiles were used as the training set and analyzed with Developer XD® (Definiens AG, Munich). Image tiles (1,000 × 1,000 pixels at 40x magnification, four pixels per micron) were equally assigned in a binary fashion as LCN or non-LCN based on the percentage of LCN, using a threshold of >30% nuclei per cluster. Using marker-controlled watershed segmentation, the model was trained to identify individual nuclei and their features within the training tiles. An L1-regularized logistic regression with 10 fold cross validation was then applied to identify selected features that could be used to predict the LCN/non-LCN classification within the test set. The same segmentation, classification and thresholding workflow was then applied to each test tile. Forty-five additional image tiles were used as the test set.
3. RESULTS
3.1. Sustained-release platforms and tumor growth
Drug release profiles previously published demonstrate a sustained-release of chemotherapy in vitro [12–14]. Orthotopic tumors were successfully established using both KELLY and SKNAS cell lines. Tumors treated with high-dose intra-tumoral chemotherapy followed a pattern of remission followed by accelerated growth (Figure 2).
Figure 2.

Representative growth kinetics of orthotopic neuroblastoma tumors treated with either control or chemotherapy-loaded silk platforms. Control tumors demonstrate uninterrupted tumor growth, while chemotherapy-treated tumors demonstrate period of slow or negligible growth (remission) followed by a more rapid growth (recurrence).
3.2. Digital histologic analysis and prediction of LCN
Histology slides from all treatment groups at the time of scarification were manually examined. LCN populations were identified in all treatment groups in both KELLY and SKNAS tumors; no LCN clusters were identified in control-treated tumors. For digital analysis, slides from KELLY cell tumors (n=11) treated with vincristine, cisplatin and etoposide were evaluated by a single pathologist.
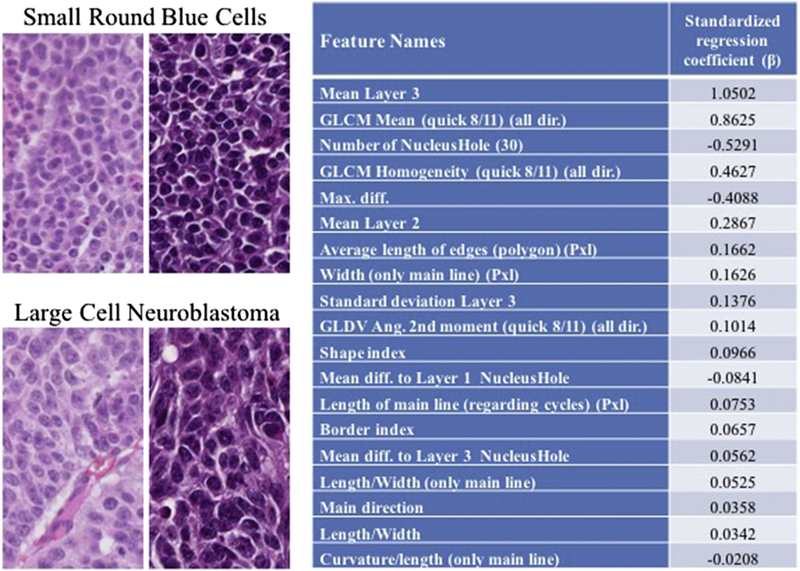
Digital analysis of the 45 training image tiles (22 large cell tiles, 23 non-large cell tiles) identified more than 15,000 nuclei that were segmented (approximately 6,000 LCN and 9,000 non-LCN). Seventy unique nuclear features related to size, shape, color and texture were identified by the software. The regression model identified 19 selected features that were most predictive for differentiating LCN from non-LCN tiles within the training sets. These key features reflecting morphologic changes in LCN, the most significant of which included ‘Mean layer 3’ (mean value of blue pigment within each nucleus), ‘GLCM mean’ (Grey Level Co-occurrence Matrix mean), ‘Number of NucleiHole’ (number of holes within a nucleus) and ‘Length/Width’ (ratio of the maximal and minimal diameters of a nucleus) (Figure 3).
Figure 3.

Representative sections of clusters of small round blue cells typical of neuroblastoma and LCN seen after high-dose intra-tumoral chemotherapy. Features of the 19-variable prediction model and associated regression coefficient (ß). Key features in the model reflect differences in color, texture, size, and nuclear shape. GLDV, Gray Level Difference Vector.
When the selected 19, high impact nuclear feature model was applied to the 45 tile test set, it provided an area under the curve (AUC) of >0.90. The model had a 100% cluster classification accuracy when >30% of the nuclei per tile were predicted as LCN. The overall accuracy within the test set was 87%.
4. DISCUSSION
We established a reliable method for modeling LCN in MYCN-amplified and non-MYCN-amplified orthotopic xenograft using locally implanted high-dose chemotherapy. We found a significant increase in the proportion of LCN in tumors treated with chemotherapy compared to control tumors. We further developed an automated method for objectively identifying LCN using nuclear morphology based on a 19-variable prediction model. The model accurately identifies clusters of LCN within neuroblastoma xenografts based on nuclear phenotypic changes, including larger nuclei, more dispersed chromatin, and more prominent nucleoli.
This method allows for objective identification of LCN across multiple MYC family-driven neuroblastoma lines without relying on pathologists and could be adopted for use in clinical practice. There is a growing body of evidence that associates LCN with a poor prognosis, so consistent identification of LCN may help identify a subset of high-risk patients that need a different treatment or surveillance strategy [10, 11]. Standardizing the recognition and identification of LCN in human tumor samples will help to improve the quality of reporting and aid the prognostic value of LCN determination.
The presence of LCN in recurrent and metastatic disease after chemotherapy—and not beforehand—raises questions of attribution [8]. We demonstrated in this work that high-dose chemotherapy induces this transformation within orthotopic xenografts, though more study of the possible mechanisms for this transformation is needed. It is possible that the development of LCN is an adaptive response to chemotherapy, akin to a bacterial pathogen developing antibiotic resistance after prolonged exposure. Alternatively, the presence of LCN in recurrent or metastatic disease could be related to the stem-like qualities of LCN, and the increased proportion of LCN seen in treated tumors is due to selected destruction of non-LCN cells. As discussed previously, LCN possess numerous features that resemble cancer stem cells [9]. Finally, it is unclear if LCN contribute to recurrence and metastasis, or if LCN is merely associated with more aggressive disease. The morphologic changes seen in LCN may be indicative of increased activity
This study has several limitations. Currently, LCN are identified by morphologic appearance alone. Though LCN share several markers with induced cancer stem cells, there is no known unique marker or molecular profile of LCN in this study or any previous work [9]. The automated system for identifying LCN in this study has a limited ability to differentiate individual nuclei (87% overall accuracy); however, the more critical assessment is the proportion of LCN within a specimen. This system has 100% accuracy when identifying LCN proportions above the set threshold of 30%. In the future, to quantify the presence of LCN more precisely we plan to utilize more advanced image analysis software and deep machine learning to better differentiate individual nuclei. This system, however, significantly improves our ability to replicate and study LCN in an orthotopic model and may be used to test treatments against this aggressive disease. Future work will also focus on translating the digital analysis system to human neuroblastoma tumors and correlating the proportion of LCN within a tumor to patient outcomes.
5. CONCLUSIONS
LCN are found in a subset of high-risk neuroblastoma and likely contribute to aggressive disease, metastasis, and poor outcomes. This study developed a reliable way to model LCN in an orthotopic murine model that is suitable for drug testing. We also established an automated process to identify and quantify LCN based on histologic changes within the nuclei. This work could improve our ability to classify LCN and measure its effects in high-risk patients.
6. ACKNOWLEDGEMENTS
This study was supported by the National Institutes of Health (R01NS094218, B.C., D.L.K.).
Abbreviations:
- LCN
large cell neuroblastoma
- AUC
area under the curve
- INGR
International Neuroblastoma Risk Group
- PBS
phosphate buffered saline
- H&E
hematoxylin and eosin
Footnotes
Publisher's Disclaimer: This is a PDF file of an unedited manuscript that has been accepted for publication. As a service to our customers we are providing this early version of the manuscript. The manuscript will undergo copyediting, typesetting, and review of the resulting proof before it is published in its final citable form. Please note that during the production process errors may be discovered which could affect the content, and all legal disclaimers that apply to the journal pertain.
Authors declare no conflict of interest.
7. REFERENCES
- [1].Noone A, Howlader N, Krapcho M, Miller D, Brest A, Yu M, et al. SEER Cancer Statistics Review, 1975–2015, https://seer.cancer.gov/csr/1975_2015/; 2018. [accessed January 4, 2019.
- [2].Maris JM, Hogarty MD, Bagatell R, Cohn SL. Neuroblastoma. Lancet 2007;369(9579):2106–20. [DOI] [PubMed] [Google Scholar]
- [3].Park JR, Bagatell R, London WB, Maris JM, Cohn SL, Mattay KM, et al. Children’s Oncology Group’s 2013 blueprint for research: neuroblastoma. Pediatric blood & cancer 2013;60(6):985–93. [DOI] [PubMed] [Google Scholar]
- [4].Cohn SL, Pearson AD, London WB, Monclair T, Ambros PF, Brodeur GM, et al. The International Neuroblastoma Risk Group (INRG) classification system: an INRG task force report. Journal of clinical oncology 2009;27(2):289. [DOI] [PMC free article] [PubMed] [Google Scholar]
- [5].Shafford EA, Rogers D, Pritchard J. Advanced neuroblastoma: improved response rate using a multiagent regimen (OPEC) including sequential cisplatin and VM-26. Journal of Clinical Oncology 1984;2(7):742–7. [DOI] [PubMed] [Google Scholar]
- [6].Park JR, Eggert A, Caron H. Neuroblastoma: biology, prognosis, and treatment. Pediatric clinics of North America 2008;55(1):97–120. [DOI] [PubMed] [Google Scholar]
- [7].Fischer J, Pohl A, Volland R, Hero B, Dübbers M, Cernaianu G, et al. Complete surgical resection improves outcome in INRG high-risk patients with localized neuroblastoma older than 18 months. BMC cancer 2017;17(1):520. [DOI] [PMC free article] [PubMed] [Google Scholar]
- [8].Tornóczky T, Kálmán E, Kajtár PG, Nyári T, Pearson AD, Tweddle DA, et al. Large cell neuroblastoma: a distinct phenotype of neuroblastoma with aggressive clinical behavior. Cancer 2004;100(2):390–7. [DOI] [PubMed] [Google Scholar]
- [9].Ikegaki N, Shimada H, Fox AM, Regan PL, Jacobs JR, Hicks SL, et al. Transient treatment with epigenetic modifiers yields stable neuroblastoma stem cells resembling aggressive large-cell neuroblastomas. Proceedings of the National Academy of Sciences 2013:201118262. [DOI] [PMC free article] [PubMed] [Google Scholar]
- [10].Wang LL, Suganuma R, Ikegaki N, Tang X, Naranjo A, McGrady P, et al. Neuroblastoma of undifferentiated subtype, prognostic significance of prominent nucleolar formation, and MYC/MYCN protein expression: a report from the Children’s Oncology Group. Cancer 2013;119(20):3718–26. [DOI] [PMC free article] [PubMed] [Google Scholar]
- [11].Tornóczky T, Semjén D, Shimada H, Ambros IM. Pathology of peripheral neuroblastic tumors: significance of prominent nucleoli in undifferentiated/poorly differentiated neuroblastoma. Pathology & Oncology Research 2007;13(4):269–75. [DOI] [PubMed] [Google Scholar]
- [12].Coburn J, Harris J, Zakharov AD, Poirier J, Ikegaki N, Kajdacsy-Balla A, et al. Implantable chemotherapy-loaded silk protein materials for neuroblastoma treatment. Int J Cancer 2017;140(3):726–35. [DOI] [PubMed] [Google Scholar]
- [13].Zeki J, Taylor JS, Yavuz B, Coburn J, Ikegaki N, Kaplan DL, et al. Disseminated injection of vincristine-loaded silk gel improves the suppression of neuroblastoma tumor growth. Surg 2018;164(4):909–15. [DOI] [PMC free article] [PubMed] [Google Scholar]
- [14].Chiu B, Coburn J, Pilichowska M, Holcroft C, Seib F, Charest A, et al. Surgery combined with controlled-release doxorubicin silk films as a treatment strategy in an orthotopic neuroblastoma mouse model. British journal of cancer 2014;111(4):708. [DOI] [PMC free article] [PubMed] [Google Scholar]


