Abstract
Background
The RNA-seq FPKM data of 331 colorectal adenocarcinoma samples in The Cancer Genome Atlas database with matching clinical data were analyzed in order to reveal the prognostic value of m6A RNA methylation regulators in colon adenocarcinoma.
Material/Methods
The expression of 13 m6A RNA methylated regulators in samples were analyzed. The samples were classified into Cluster I and II by consistent clustering. The gene distribution was analyzed by principal component analysis. Further functional analysis of selected m6A RNA genes was performed and potential risk characteristics was developed using Lasso Cox regression algorithm. Using minimum criteria, the risk coefficients of YTHDF1 and HNRNPC were detected for Cluster II. Patients were divided into high-risk and low-risk subgroups based on the risk characteristics. The clinical data were analyzed by univariate and multivariate Cox regression analysis.
Results
Expression of the detected m6A RNA methylated regulators except YTHDC2 in tumors were significantly different from their adjacent mucosa. Among them, only ALKBH5 and METTL4 were downregulated in tumors. The gene distribution between the 2 subgroups were different. The expression of m6A RNA methylation regulators including YTHDF1, HNRNPC, YTHDC2, YTHDC1, ZC3H13, and RBM15 were different between the 2 groups (P<0.05). The prognostic characteristics between the high-risk and low-risk groups were significant different (P<0.05), which had a good predictive significance of prognosis area under the curve (AUC)=0.62). Risk scores were less than 0.05, suggesting risk score was an independent prognostic factor for colon adenocarcinoma.
Conclusions
m6A RNA methylation regulators YTHDF1 and HNRNPC can be used as prognostic factors of colon cancer, which has potential value for colon cancer treatment.
MeSH Keywords: Colorectal Neoplasms, Hereditary Nonpolyposis; Methyltransferases; RNA Processing, Post-Transcriptional
Background
Colorectal cancer is a malignant tumor that occurs in the colon or rectum, with high incidence and mortality worldwide [1,2]. The most common pathological type of colon cancer is colon adenocarcinoma. Colon adenocarcinoma is a kind of malignant epithelial tumor with adenoid differentiation of intestinal mucosa. The occurrence of the lesion is related to genetic and dietary factors [3]. Adenocarcinoma is often accompanied by lymphatic metastasis, and the prognosis is generally poor and related to the invasion and dissemination of the lesion [4].
Genomic epigenetic modifications, such as histone modification, RNA modification and DNA methylation, play a critical role in tumorigenesis and development. The RNA modification 6-methyladenine (m6A) was first reported in 1974 [5]; it is the most common kind of mRNA methylation modification. m6A is widely associated with RNA modifications, including mRNAs, tRNAs, snRNAs, as well as long-chain non-coding RNAs [6]. The m6A mRNA methylation modification is the major RNA modifications.
It has been shown that m6A mRNA methylation modification is reversible and is dynamically regulated by methyltransferases that include METTL3/14, WTAP, and KIAA1429, which catalyze the adenylate mRNA m6A modification [7]. The complex formed promotes the m6A methylated group to be written into RNA, and the earliest writing genes are METTL3, METTL14, and WATP; the complex they form together cause the m6A methylated group to be written into RNA [8,9]. Subsequently, it has been reported that more new “writers” genes such as METTL16, KIAA1429, and RBM15 [7,10]. Demethylation enzymes include FTO and ALKHB5 [11], which are used to demethylation the bases that have been modified by m6A. The main function of reading protein is to recognize the base that is modified by m6A, so as to activate the downstream regulatory pathways such as RNA degradation, miRNA processing, and so on [9]. Reading protein will bind to the m6A site of RNA, and then produce a variety of biological functions. The first reading gene was the coding gene of YTH domain family protein, including YTHDFs and YTHDCs subtypes [12,13]. The “Readers” genes in YTHDCs subtypes are YTHDC1 and YTHDC2 [14]. On the other hand, the reading genes of YTHDFs subtypes were YTHDF1, YTHDF2, and YTHDF3 [12], respectively. In addition to the YTH domain family protein genes, several reading genes were found, eIF3, hnRNPC, and hnRNPA2/B1 genes [13]. In recent years, more and more evidence has shown that the level of m6A modification is related to the self-renewal of tumor stem cells, and the growth, proliferation, anti-chemotherapy, and radiotherapy sensitivity of cancer cells [15,16]. The link between m6A RNA and human cancer types has been confirmed in a variety of cancers, including cervical cancer, prostate cancer, breast cancer, pancreatic cancer, liver cancer, and acute myeloid leukemia [17–19].
So far, although METTL3 has been reported to act as an oncogene to maintain the SOX2 (SRY [sex determining region Y]-box 2), expression in colorectal cancer cells via an m6A-IGF2BP2-dependent mechanism [20], the expression pattern of m6A RNA and its clinical value in colorectal cancer remains unclear. YTHDF1 is overexpressed in colorectal cancer and plays a vital oncogenic role in colorectal cancer [21].
In this study, we downloaded the RNA sequencing data from the cancer genome map of The Cancer Genome Atlas (TCGA) data set. The expression of 13 widely reported m6A RNA regulators in colon adenocarcinoma and its correlation with clinicopathological features was systematically analyzed. Then, analysis by means of bioinformatics and statistical analysis were performed in order to explore the potential application value of m6A modified regulatory factor in colon adenocarcinoma.
Material and Methods
Datasets
We systematically searched the RNA-seq transcriptome data of colon adenocarcinoma in TCGA database (http://cancergenome.nih.gov/) and downloaded the matching clinical information data. Patients without survival information were excluded from further assessment. RNA-seq data collection its fragments per kilobase million (FPKM) style data [22].
Tumor classification
The consistent clustering algorithm was used to evaluate the stability of the clustering and determine the clustering number of samples. The principle of classification was as follows: 1) the growth rate of cumulative distribution function (CDF) value was slow; 2) there were no small clusters in the clustering data; and 3) the correlation was high in the group. The program was executed using the ConsensusClusterPlus R package [23].
Principal component analysis (PCA)
Principal component analysis (PCA) was performed by the PCA provided by Limma package [24], and the results were visualized by ggplot2 package [25].
Analysis of risk characteristics and prognosis
In order to evaluate the prognostic significance of m6A RNA methylation regulators, potential risk characteristics was developed by using Lasso Cox regression algorithm. The genes in Cluster II subgroup associated significantly with survival were identified. Further functional analysis of those genes was performed, and their coefficients were determined through the minimum standard. The best penalty parameter λ related to the minimum 10 times cross verification in the training set were selected to obtain the final risk score. The program is executed using glmnet package [26] and survival package [27]. Consistent with RNA methylation regulatory factor expression, patients were divided into 2 subgroups. Using the median risk score obtained from Lasso regression (from risk characteristics) as the demarcation value, the high-risk and low-risk groups were classified and compared the overall survival. The receiver operating characteristic (ROC) curve [28] was used to test the predictive efficiency of the survival model. Risk score was determined by univariate and multivariate Cox regression analysis. The prognostic value of risk score was determined. Molecular pathological features in those subgroups were investigated based on the risk score.
Statistical analysis
The expression of m6A RNA methylated regulatory factors in tumor tissues and paracancerous tissues in TCGA samples was compared by one-way ANOVA. The clinical characteristics and m6A RNA methylation regulation of different groups were compared by chi-square test. Kaplan-Meier method was used for bilateral logarithmic rank test in overall survival analysis. All tests were 2-sided, and P-values <0.05 were considered statistically significant. All the statistical analyses in this study are implemented by Rv3.5.3 (https://www.r-project.org/).
Results
Identification of m6A RNA methylated regulators in colon adenocarcinoma
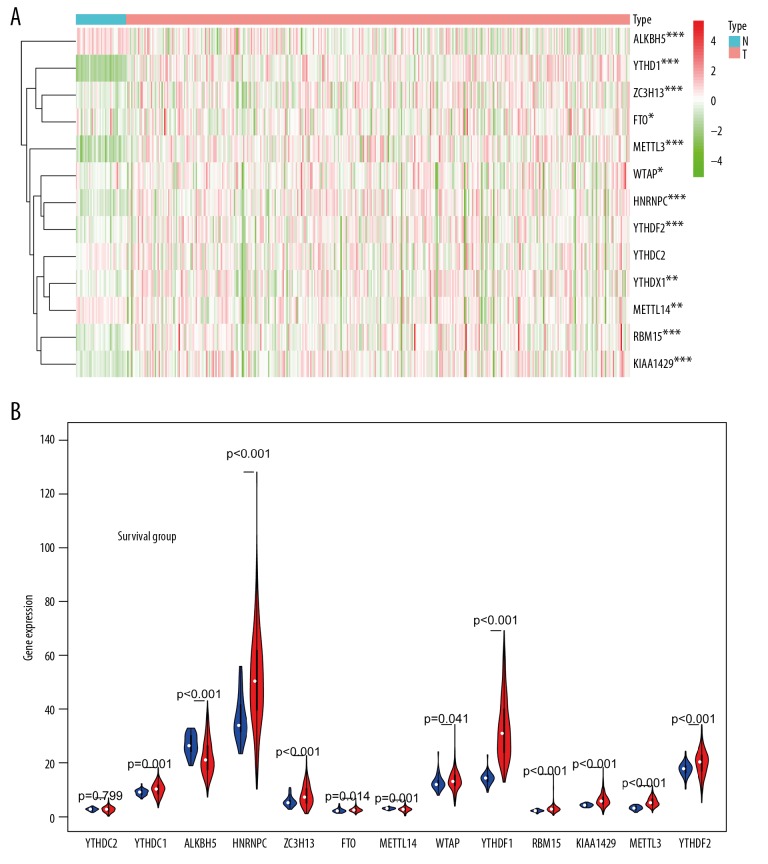
The expression of 13 m6A RNA methylation regulatory factors in TCGA database was shown in Figure 1A and 1B. Except for YTHDC2, the expression of the other 12 factors was significant different between the tumor group and the adjacent mucosa group. Expression of ALKBH5 (P<0.001) and METTL4 (P<0.01) in tumor tissues were downregulated significantly compared with the adjacent mucosa. The expression of YTHDF1 (P<0.001), ZC3H13 (P<0.001), FTO (P<0.001), METL3 (P<0.001), WTAP (P<0.05), HNRNPC (P<0.001), YTHDF2 (P<0.001), YTHDC1 (P<0.001), RBM15 (P<0.001), and KIAA1429 (P<0.001) in tumor tissues were upregulated significantly compared with the adjacent mucosa.
Figure 1.
Expression of m6A RNA methylation regulators in colon adenocarcinoma. (A) Heatmap of the expression of 13 m6A RNA methylated regulatory factors in different colon adenocarcinoma. The depth of red represents the level of high expression, and the depth of green represents the level of low expression * P<0.05, <0.01, <0.001, <0.0001. (B) The violin diagram showed the median expression of 13 m6A RNA methylated regulatory factors in colon adenocarcinoma, and position of white spots on the way represented the median value of expression. * P<0.05, <0.01, <0.001, <0.0001.
Clustering of patients and the survival rate of clusters
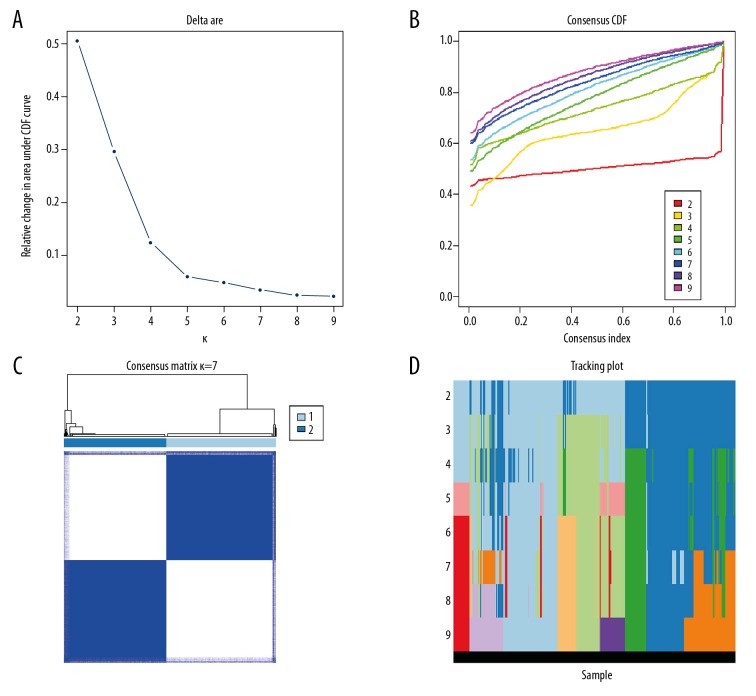
The consistent clustering analysis of the patients was carried out basing the expression of m6A RNA methylation regulators in TCGA. Finally, it was decided to cluster the patients into 2 Subgroups (Figure 2A–2D).
Figure 2.
Consistent cluster analysis of colon adenocarcinoma. (A) The consistency clustering cumulative distribution function (CDF) when k is between 2 and 10. (B) The relative change of the area under the CDF curve from 2 to 10 of k. (C) At k=2, the correlation between groups. (D) The distribution of the sample when k is between 2 and 10.
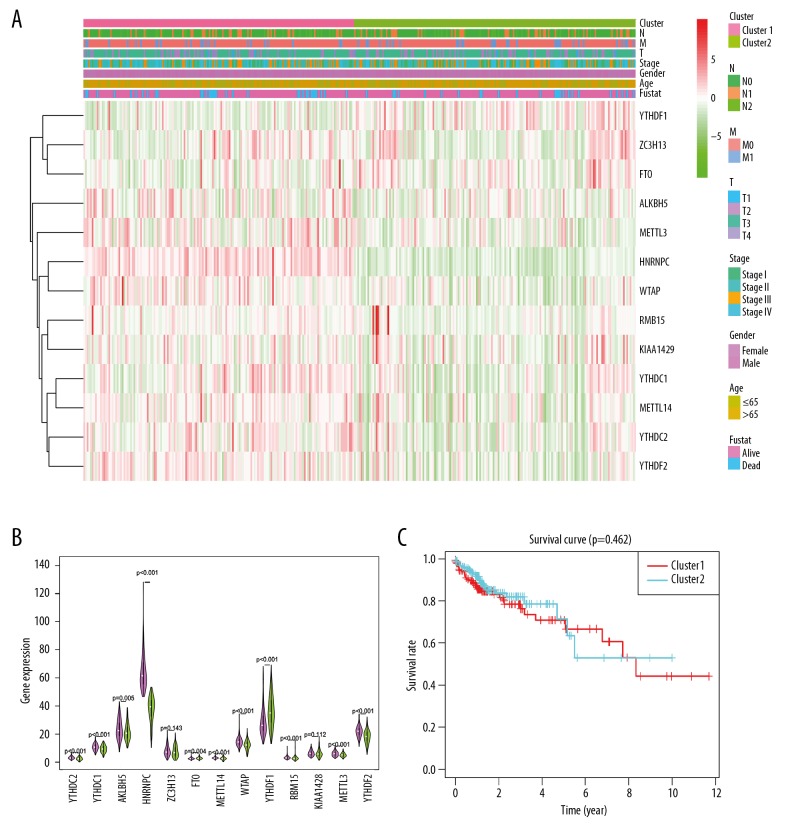
The PCA showed that RNA expression in subgroups were specific, but on the whole, there were many overlapping areas between the 2 groups, suggesting that the 2 groups had something in common (Figure 3). The clinicopathological features had no significant difference (Table 1, Figure 4A). By comparing the expression of m6A RNA factors in Cluster I and II subgroups (Figure 4A, 4B), the difference of ZC3H13 and KIAA1429 expression between the 2 subgroups was no significant difference, but the difference in expression of other m6A RNA factors were statistically significant. Compared with Cluster II, the expression of m6A RNAs except YTHDF1 were downregulation in Cluster I subgroup. The overall survival rate of the 2 groups was analyzed by Kaplan-Meier survival curve and shown in Figure 4C. Overall survival between the 2 groups had no significant difference (Figure 4C).
Figure 3.
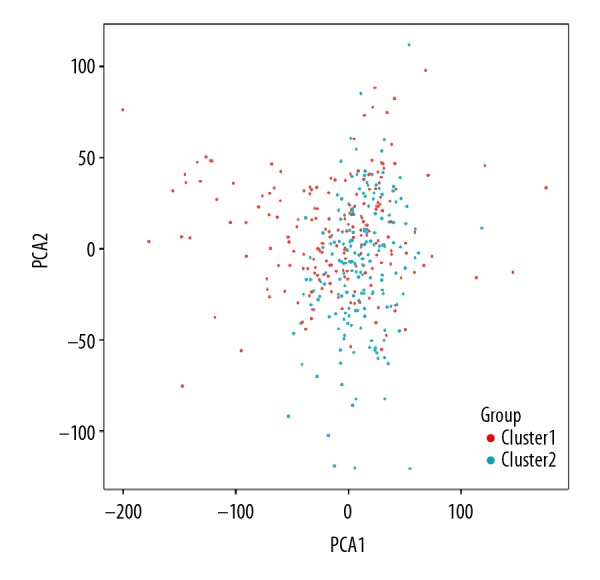
Principal component analysis of 2 clusters of total RNA expression profile after consistency analysis of colon adenocarcinoma in TCGA dataset. The Cluster I subgroup is marked in red and Cluster II subgroup in cyan. The scattered points show the distribution of RNA expression in the 2 subgroups.
Table 1.
Comparison of clinical characteristics of samples divided into 2 groups by consistency cluster analysis.
| Subgroup | Total | Age | Gender | Stage | T | M | N | ||||||
|---|---|---|---|---|---|---|---|---|---|---|---|---|---|
| Cluster I | 162 | ≤65 | 64 | Female | 72 | I | 24 | T1 | 3 | M0 | 139 | N0 | 102 |
| >65 | 98 | Male | 90 | II | 75 | T2 | 25 | M1 | 23 | N1 | 34 | ||
| III | 40 | T3 | 112 | M2 | – | N2 | 26 | ||||||
| IV | 23 | T4 | 22 | M3 | – | N3 | – | ||||||
| Cluster II | 169 | ≤65 | 69 | Female | 82 | I | 34 | T1 | 4 | M0 | 139 | N0 | 97 |
| >65 | 100 | Male | 87 | II | 59 | T2 | 33 | M1 | 30 | N1 | 41 | ||
| III | 46 | T3 | 118 | M2 | – | N2 | 31 | ||||||
| IV | 30 | T4 | 14 | M3 | – | N3 | – | ||||||
Figure 4.
Comparison of clinical characteristics and expression of m6A RNA methylated regulators between 2 subgroups of samples divided into 2 groups by consistent cluster analysis. (A) m6A RNA methylation regulators consistently express the thermographic and clinicopathological features of the 2 defined clusters (RM1/2). (B) The violin diagram shows the comparison of the median values of 13 m6A RNA methylated regulatory factors in 2 clusters of colorectal adenocarcinomas, and the location of the white spot represents the median value of expression. * P<0.05, <0.01, <0.001, <0.0001. (C) Comparison of overall survival (OS) curve Kaplan-Meier OS rate in patients with and colon cancer.
Predictive value of 2 selected m6A RNA methylation regulators in prognosis
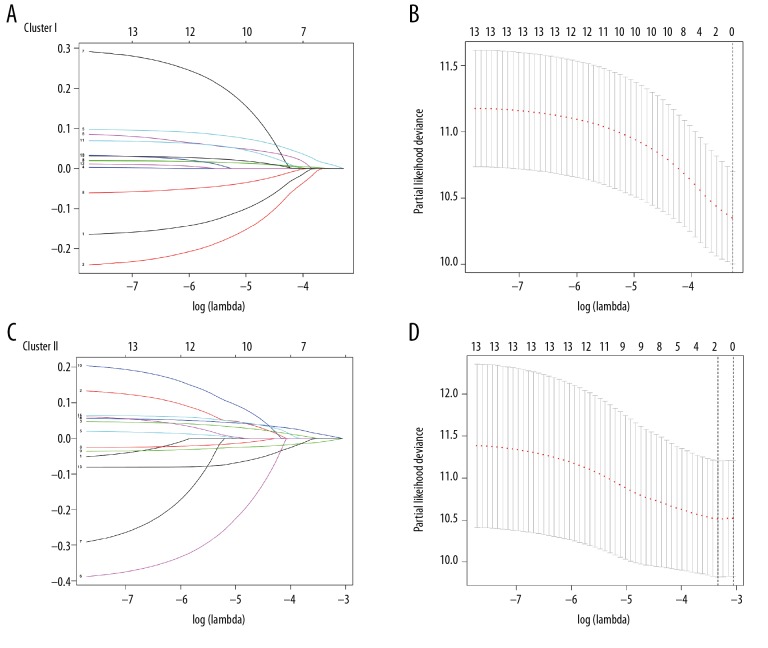
We constructed risk models for 2 groups of patients with colon cancer, which included m6A RNA, as shown in Figure 5A and 5B. Results showed that Cluster I subgroup did not included m6A RNA. In Cluster II subgroup, as shown in Figure 5C and 5D, the 2 m6A RNAs YTHDF1 and HNRNPC are included in the risk model, with risk signal values were −0.0075 and 0.0085, respectively.
Figure 5.
Risk signals of 13 m6A RNA methylation regulators in 2 groups of colon adenocarcinoma samples. (A, C) The longitudinal coordinate is the value of correlation coefficient, the lower transverse coordinate is logLamda (penalty coefficient), and the upper transverse coordinate is the number of non-zero coefficients in the model. The lines of different colors represent the trajectory of the correlation coefficient of different factors in the model with the increase of LogLamda. (B, D) The upper transverse coordinate represents the format of the factor, the lower transverse coordinate represents the logLamda (penalty coefficient), and the longitudinal coordinate represents the error of cross verification. The point with the smallest cross verification error corresponds to the number of factors included in the Lasso regression model.
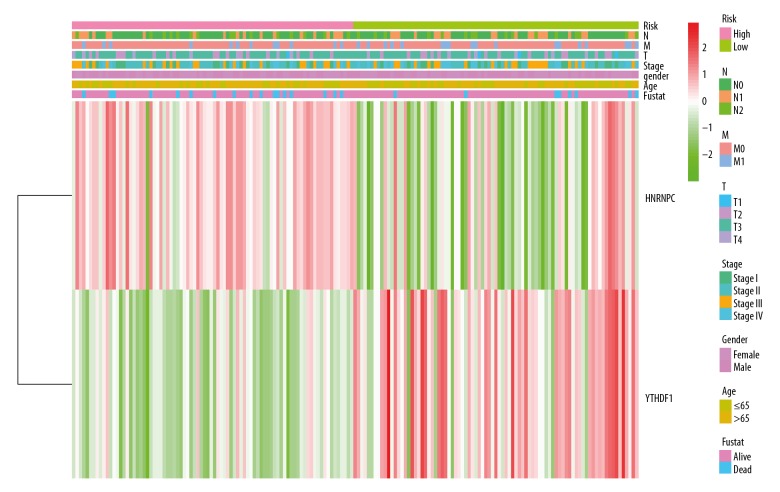
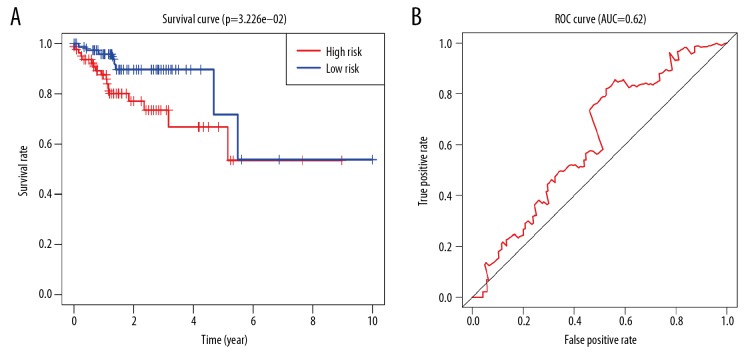
Based on the risk characteristics, Cluster II subgroups was divided into high-risk group and low-risk risk group. The clinical characteristics and the expression of YTHDF1 and HNRNPC were compared between the 2 groups (Table 2, Figure 6). The clinical characteristics had no significant difference. However, there was relative lower expression of YTHDF1 (P<0.001) and relative higher expression of HNRNPC (P<0.001) in the high-risk group, suggesting the risk was associated with the gene expression. Kaplan-Meier survival curve analysis was carried out between high-risk group and low-risk group based on different risk signals. There was a significant difference in overall survival between the 2 subgroups (P<0.032, Figure 7A). The predictive efficiency of the constructed survival curve was further analyzed, as shown in Figure 7B. The area under the curve (AUC)=0.62, in the ROC curve indicates that the prediction efficiency of the curve was good.
Table 2.
Comparison of clinical characteristics between the 2 groups based on risk characteristics.
| Subgroup | Total | Age | Gender | Stage | T | M | N | ||||||
|---|---|---|---|---|---|---|---|---|---|---|---|---|---|
| High | 84 | ≤65 | 29 | Female | 38 | I | 18 | T1 | 1 | M0 | 72 | N0 | 49 |
| >65 | 55 | Male | 46 | II | 30 | T2 | 17 | M1 | 12 | N1 | 20 | ||
| III | 24 | T3 | 59 | M2 | – | N2 | 15 | ||||||
| IV | 12 | T4 | 7 | M3 | – | N3 | – | ||||||
| Low | 85 | ≤65 | 40 | Female | 44 | I | 16 | T1 | 3 | M0 | 67 | N0 | 48 |
| >65 | 45 | Male | 41 | II | 29 | T2 | 16 | M1 | 18 | N1 | 21 | ||
| III | 22 | T3 | 59 | M2 | – | N2 | 16 | ||||||
| IV | 18 | T4 | 7 | M3 | – | N3 | – | ||||||
Figure 6.
Comparison of clinicopathological characteristics and expression of HNRNPC and YTHDF1 in 2 groups after grouping based on risk characteristics. The heatmap shows the clinical characteristics of high-risk group and low-risk group. Different colors represent different clinical features and the expression of 2 m6A RNA methylation regulatory factors.
Figure 7.
Prognostic value of 2 m6A-RNA methylation regulators in Cluster II subgroup. (A) Based on risk characteristics, Cluster II subgroup is divided into high-risk group and low-risk group. Kaplan-Meier overall survival (OS) rate curve, longitudinal coordinate shows survival rate, transverse coordinate shows time survival time. (B) Shows the receiver operating characteristic (ROC) curve, which shows the predictive efficiency of the survival rate of the survival model based on risk feature grouping.
The relative risk (HR) values of different clinical features in high-risk group and low-risk group in Cluster II were further analyzed. As shown in Figure 8A and 8B the results of univariate analysis showed that the TNM (tumor, nodes, metastasis) stages of the high-risk group was higher than that of low-risk group, and the HR value was more than 1. Based on the risk value, the clinical data were analyzed by univariate and multivariate Cox regression analysis. The results of univariate and multivariate regression showed that the P values of risk score were all less than 0.05, indicating that the risk score obtained by our model can be used as an independent prognostic factor for overall survival in colon adenocarcinoma.
Figure 8.
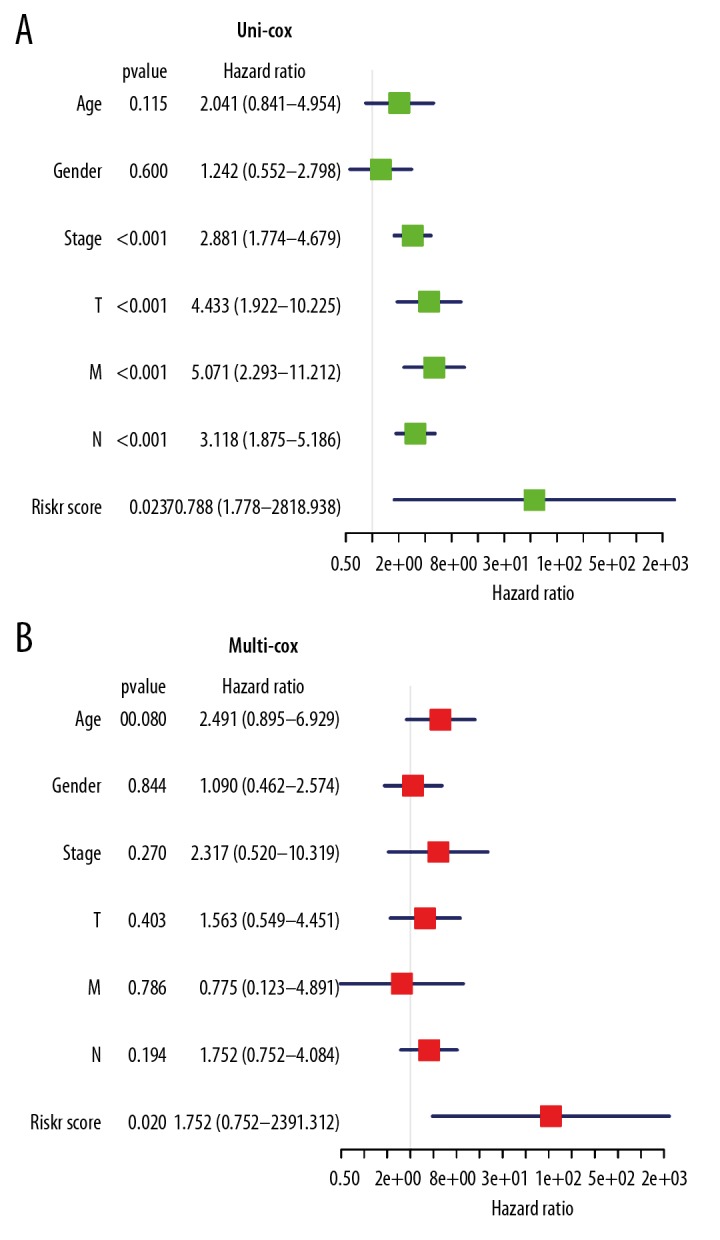
The relationship between clinicopathological features and overall survival of patients. (A, B) The relative risk (HR) values of clinical features in high-risk group by univariate regression analysis and multivariate regression analysis. The vertical line on the way is invalid. The horizontal lines in the color module represent the confidence interval of each factor.
Discussion
Evidences that m6A RNA modification were related to tumor proliferation, differentiation, tumorigenesis [29], proliferation [30], invasion [29]and metastasis [31]. The m6A modification acts as carcinogenic or anticancer genes in malignant tumors. Based on the large sample data of 331 cases of colon adenocarcinoma in TCGA database, we showed that the expression of m6A RNA methylated regulators in colon adenocarcinoma was significantly changed in tumor tissues, suggesting that m6A RNA modification plays an important role in colorectal adenocarcinoma. It should be noted that ALKBH5 and METTL4 were downregulated in tumor tissues, and the expression of ALKBH5 decreased most significantly. It is suggested that ALKBH5 is hypomethylated. ALKBH5, the Fe2+ and α-ketoglutaric acid-dependent non-heme oxygenase, is the second demethylase discovered [32]. ALKBH5 is a member of AIkB family, but unlike other AIkBs, ALKBH5 only has the ability to demethylation m6A on single strand RNA/DNA [32]. It has been reported that ALKBH5 reduces the level of m6A and enhances its stability in breast cancer, resulting in an increase in the level of m6A and protein in breast cancer stem cell (BCSCs) [33]. ALKBH5 is highly expressed in glial stem cell-like cells (glioma stem cells, GSCs) and promotes the proliferation of GSCs [34]. Low expression of ALKBH5 promotes the demethylation of lncRNAKCNK15-AS1 m6A, resulted in a decrease in invasion and metastasis in pancreatic cancer cell lines [35]. Invasion is thought to be closely associated with angiogenesis in cancer [36]. Our study found that the expression of ALKBH5 in colon adenocarcinoma was lower than that in adjacent mucosa, suggesting that the role of ALKBH5 in colon cancer needs to be further studied.
In order to further study the effect of m6A RNA methylation regulatory factor on the clinicopathological characteristics and prognosis of colon adenocarcinoma, we analyzed the matched clinical data of the samples downloaded from TCGA. We divided all the downloaded samples into 2 subgroups by consistent clustering. It was found that the expression of m6A RNA between the 2 subgroups was significant different, especially in HNRNPC and YTHDF1. The expression of HNRNPC in Cluster I subgroup was lower than that of Cluster II subgroup, while YTHDF1 was higher than Cluster II subgroup. We observed that most of m6A RNA was low expression in Cluster II subgroup. The overall survival between the 2 subgroups had no significant difference, which may be related to the consistent clustering grouping. Although there were significant differences in gene distribution between the 2 groups, there were more overlapping regions. As a result, the difference in apparent characteristics between the 2 groups were not obvious. Basing on the difference in the expression of m6A RNA regulators in Cluster I and II subgroups, we found that the differential expression of YTHDF1 and HNRNPC were associated with the survival of patients with colon adenocarcinoma. By Lasso regression cross-validation, we found that the differential expression of HNRNPC and YTHDF1 in Cluster II subgroup was a risk factor. The specific manifestations were relative higher expression of HNRNPC and relative lower expression of YTHDF1 in high-risk group compared with low-risk group. It was found that there was significant difference in overall survival, and the prediction efficiency is 0.62, indicating that the prediction effect on prognosis is good. Based on the risk value, the clinical data were analyzed by univariate and multivariate Cox regression analysis. The results of univariate and multivariate regression showed that the P values of risk score were all less than 0.05, indicating that the risk score obtained by our model can be used as an independent prognostic factor for colon adenocarcinoma. The difference was not significant in clinicopathological features (P>0.05), suggesting that relative lower expression of YTHDF1 and relative higher expression of HNRNPC were associated with high-risk and poor overall survival. Thus, HNRNPC and YTHDF1 were independent prognostic factors for colon adenocarcinoma patients. YTHDF1 could reflect malignant degree, which has prognosis value in hepatocellular carcinoma [37]. In the study of colon cancer, there are similar reports that YTHDF1 are involved in the tumor process of colon cancer [20,21]. YT521-B homology (YT521-Bhomology, YTH) YTH domain recognizes and reads m6A methylated information in a methylation-dependent manner [38]. Nishizawa et al. [39] found that YTHDF1 gene was highly expressed in patients with colorectal cancer. Through the stratification study of clinicopathological data, it was reported that YTHDF1 gene expression was associated with tumor diameter (P<0.009), lymph node metastasis (P<0.044), distant metastasis (P<0.036) and clinical stage (P<0.0226). However, the specific regulatory mechanism has not been studied [39]. In our study, after consistent clustering, we eliminated the interference of confounding factors and found that the expression of YTHDF1 was not affected by clinical stage but affected by T, N, and M (tumor, nodes, and metastasis). YTHDF1 was a risk factor by univariate regression analysis. HNRNPA2/B1 proteins might involve in the precursor miRNA transcription precession in the HNRNP family [40], while HNRNPC proteins affect the local secondary structures of mRNA and lncRNA. HNRNP has not been extensively studied. However, the overexpression of HNRNPL is critical for the recruitment of the DNA repair factors in oxaliplatin-induced DNA double-strand breaks [41] and HNRNPC plays a key role in establishing the APA (alternative cleavage and polyadenylation) profile of metastatic colon cancer cells [42]. The dynamic regulation of m6A methylation level on RNA and the potential biological regulatory functions need to be further studied. The 2 m6A genes found in this study are all reading genes, and their further functions need to be further studied.
Conclusions
This study found that HNRNPC and YTHDF1 were expressed specifically in subtypes of colon cancer, and HNRNPC andYTHDF1 could be used as independent prognostic factors for special colon cancer, which was not affected by clinical characteristics. Although the differences between the subgroups in clinical characteristics, as well as the specific roles of HNRNPC and YTHDF1 needs to future investigate, our findings have potential value for devolving the prognostic stratification and treatment strategies of colon cancer.
Footnotes
Source of support: Departmental sources
References
- 1.Bray F, Ferlay J, Soerjomataram I, et al. Global cancer statistics 2018: GLOBOCAN estimates of incidence and mortality worldwide for 36 cancers in 185 countries. Cancer J Clin. 2018;68(6):394–424. doi: 10.3322/caac.21492. [DOI] [PubMed] [Google Scholar]
- 2.Ferlay J, Colombet M, Soerjomataram I, et al. Estimating the global cancer incidence and mortality in 2018: GLOBOCAN sources and methods. Int J Cancer. 2019;144(8):1941–53. doi: 10.1002/ijc.31937. [DOI] [PubMed] [Google Scholar]
- 3.Gao M, Zhang X, Li D, et al. Expression analysis and clinical significance of eIF4E, VEGF-C, E-cadherin and MMP-2 in colorectal adenocarcinoma. Oncotarget. 2016;7(51):85502–14. doi: 10.18632/oncotarget.13453. [DOI] [PMC free article] [PubMed] [Google Scholar]
- 4.Dai Y, Jiang J, Wang Y, et al. The correlation and clinical implication of VEGF-C expression in microvascular density and lymph node metastasis of gastric carcinoma. Am J Transl Res. 2016;8(12):5741–47. [PMC free article] [PubMed] [Google Scholar]
- 5.Wei C-M, Gershowitz A, Moss B. Methylated nucleotides block 5′ terminus of HeLa cell messenger RNA. Cell. 1975;4(4):379–86. doi: 10.1016/0092-8674(75)90158-0. [DOI] [PubMed] [Google Scholar]
- 6.Dominissini D, Moshitch-Moshkovitz S, Schwartz S, et al. Topology of the human and mouse m 6 A RNA methylomes revealed by m 6 A-seq. Nature. 2012;485(7397):201–6. doi: 10.1038/nature11112. [DOI] [PubMed] [Google Scholar]
- 7.Pendleton KE, Chen B, Liu K, et al. The U6 snRNA m6A methyltransferase METTL16 regulates SAM synthetase intron retention. Cell. 2017;169(5):824–35.e814. doi: 10.1016/j.cell.2017.05.003. [DOI] [PMC free article] [PubMed] [Google Scholar]
- 8.Bokar J, Shambaugh M, Polayes D, et al. Purification and cDNA cloning of the AdoMet-binding subunit of the human mRNA (N6-adenosine)-methyltransferase. RNA. 1997;3(11):1233–47. [PMC free article] [PubMed] [Google Scholar]
- 9.Ping X-L, Sun B-F, Wang L, et al. Mammalian WTAP is a regulatory subunit of the RNA N6-methyladenosine methyltransferase. Cell Res. 2014;24(2):177–89. doi: 10.1038/cr.2014.3. [DOI] [PMC free article] [PubMed] [Google Scholar]
- 10.Schwartz S, Mumbach MR, Jovanovic M, et al. Perturbation of m6A writers reveals two distinct classes of mRNA methylation at internal and 5′ sites. Cell Rep. 2014;8(1):284–96. doi: 10.1016/j.celrep.2014.05.048. [DOI] [PMC free article] [PubMed] [Google Scholar]
- 11.Huang Y, Yan J, Li Q, et al. Meclofenamic acid selectively inhibits FTO demethylation of m6A over ALKBH5. Nucleic Acids Res. 2014;43(1):373–84. doi: 10.1093/nar/gku1276. [DOI] [PMC free article] [PubMed] [Google Scholar]
- 12.Wang X, Lu Z, Gomez A, et al. N 6-methyladenosine-dependent regulation of messenger RNA stability. Nature. 2014;505(7481):117–20. doi: 10.1038/nature12730. [DOI] [PMC free article] [PubMed] [Google Scholar]
- 13.Alarcón CR, Goodarzi H, Lee H, et al. HNRNPA2B1 is a mediator of m6A-dependent nuclear RNA processing events. Cell. 2015;162(6):1299–308. doi: 10.1016/j.cell.2015.08.011. [DOI] [PMC free article] [PubMed] [Google Scholar]
- 14.Meyer KD, Jaffrey SR. Rethinking m6A readers, writers, and erasers. Annual Rev Cell Dev Biol. 2017;33:319–42. doi: 10.1146/annurev-cellbio-100616-060758. [DOI] [PMC free article] [PubMed] [Google Scholar]
- 15.Dai D, Wang H, Zhu L, et al. N6-methyladenosine links RNA metabolism to cancer progression. Cell Death Dis. 2018;9(2):124. doi: 10.1038/s41419-017-0129-x. [DOI] [PMC free article] [PubMed] [Google Scholar]
- 16.Cui Q, Shi H, Ye P, et al. m6A RNA methylation regulates the self-renewal and tumorigenesis of glioblastoma stem cells. Cell Rep. 2017;18(11):2622–34. doi: 10.1016/j.celrep.2017.02.059. [DOI] [PMC free article] [PubMed] [Google Scholar]
- 17.Zhou S, Bai ZL, Xia D, et al. FTO regulates the chemo-radiotherapy resistance of cervical squamous cell carcinoma (CSCC) by targeting β-catenin through mRNA demethylation. Mol Carcinog. 2018;57(5):590–97. doi: 10.1002/mc.22782. [DOI] [PubMed] [Google Scholar]
- 18.Taketo K, Konno M, Asai A, et al. The epitranscriptome m6A writer METTL3 promotes chemo-and radioresistance in pancreatic cancer cells. Int J Oncol. 2018;52(2):621–29. doi: 10.3892/ijo.2017.4219. [DOI] [PubMed] [Google Scholar]
- 19.Cheng X, Li M, Rao X, et al. Kiaa1429 regulates the migration and invasion of hepatocellular carcinoma by altering m6A modification of ID2 mRNA. Onco Targets Ther. 2019;12:3421–28. doi: 10.2147/OTT.S180954. [DOI] [PMC free article] [PubMed] [Google Scholar]
- 20.Li T, Hu P-S, Zuo Z, et al. METTL3 facilitates tumor progression via an m 6 A-IGF2BP2-dependent mechanism in colorectal carcinoma. Mol Cancer. 2019;18(1):112. doi: 10.1186/s12943-019-1038-7. [DOI] [PMC free article] [PubMed] [Google Scholar]
- 21.Bai Y, Zhang Y, Yang C, et al. YTHDF1 Regulates tumorigenicity and cancer stem cell-like activity in human colorectal carcinoma. Front Oncol. 2019;9:332. doi: 10.3389/fonc.2019.00332. [DOI] [PMC free article] [PubMed] [Google Scholar]
- 22.Mortazavi A, Williams BA, McCue K, et al. Mapping and quantifying mammalian transcriptomes by RNA-Seq. Nat Methods. 2008;5(7):621–28. doi: 10.1038/nmeth.1226. [DOI] [PubMed] [Google Scholar]
- 23.Wilkerson MD, Hayes DN. ConsensusClusterPlus: A class discovery tool with confidence assessments and item tracking. Bioinformatics. 2010;26(12):1572–73. doi: 10.1093/bioinformatics/btq170. [DOI] [PMC free article] [PubMed] [Google Scholar]
- 24.Ritchie ME, Phipson B, Wu D, et al. limma powers differential expression analyses for RNA-sequencing and microarray studies. Nucleic Acids Res. 2015;43(7):e47. doi: 10.1093/nar/gkv007. [DOI] [PMC free article] [PubMed] [Google Scholar]
- 25.Wickham H, Chang W. ggplot2: an implementation of the grammar of graphics. R package version 07. http://CRANR-project.org/package=ggplot2.
- 26.Simon N, Friedman J, Hastie T, Tibshirani R. Regularization paths for Cox’s proportional hazards model via coordinate descent. J Stat Softw. 2011;39(5):1–13. doi: 10.18637/jss.v039.i05. [DOI] [PMC free article] [PubMed] [Google Scholar]
- 27.Therneau T. A package for survival analysis in S. version 2.38. 2015. https://CRAN.R-project.org/package=survival.
- 28.Hanley JA, McNeil BJ. The meaning and use of the area under a receiver operating characteristic (ROC) curve. Radiology. 1982;143(1):29–36. doi: 10.1148/radiology.143.1.7063747. [DOI] [PubMed] [Google Scholar]
- 29.Lin S, Choe J, Du P, et al. The m6A methyltransferase METTL3 promotes translation in human cancer cells. Mol Cell. 2016;62(3):335–45. doi: 10.1016/j.molcel.2016.03.021. [DOI] [PMC free article] [PubMed] [Google Scholar]
- 30.Liu J, Eckert MA, Harada BT, et al. m6A mRNA methylation regulates AKT activity to promote the proliferation and tumorigenicity of endometrial cancer. Nat Cell Biol. 2018;20(9):1074–83. doi: 10.1038/s41556-018-0174-4. [DOI] [PMC free article] [PubMed] [Google Scholar]
- 31.Ma Jz, Yang F, Zhou Cc, et al. METTL14 suppresses the metastatic potential of hepatocellular carcinoma by modulating N6-methyladenosine-dependent primary MicroRNA processing. Hepatology. 2017;65(2):529–43. doi: 10.1002/hep.28885. [DOI] [PubMed] [Google Scholar]
- 32.Jia C-Z, Zhang J-J, Gu W-Z. RNA-methylpred: a high-accuracy predictor to identify N6-methyladenosine in RNA. Anal Biochem. 2016;510:72–75. doi: 10.1016/j.ab.2016.06.012. [DOI] [PubMed] [Google Scholar]
- 33.Zhang C, Zhi WI, Lu H, et al. Hypoxia-inducible factors regulate pluripotency factor expression by ZNF217-and ALKBH5-mediated modulation of RNA methylation in breast cancer cells. Oncotarget. 2016;7(40):64527–42. doi: 10.18632/oncotarget.11743. [DOI] [PMC free article] [PubMed] [Google Scholar]
- 34.Chai R-C, Wu F, Wang Q-X, et al. m6A RNA methylation regulators contribute to malignant progression and have clinical prognostic impact in gliomas. Aging (Albany NY) 2019;11(4):1204–25. doi: 10.18632/aging.101829. [DOI] [PMC free article] [PubMed] [Google Scholar]
- 35.Xuan J-J, Sun W-J, Lin P-H, et al. RMBase v2. 0: Deciphering the map of RNA modifications from epitranscriptome sequencing data. Nucleic Acids Res. 2017;46(D1):D327–34. doi: 10.1093/nar/gkx934. [DOI] [PMC free article] [PubMed] [Google Scholar]
- 36.Zeng Y, Yao X, Liu X, et al. Anti-angiogenesis triggers exosomes release from endothelial cells to promote tumor vasculogenesis. J Extracell Vesicles. 2019;8(1):1629865. doi: 10.1080/20013078.2019.1629865. [DOI] [PMC free article] [PubMed] [Google Scholar]
- 37.Zhou Y, Yin Z, Hou B, et al. Expression profiles and prognostic significance of RNA N6-methyladenosine-related genes in patients with hepatocellular carcinoma: Evidence from independent datasets. Cancer Manag Res. 2019;11:3921–31. doi: 10.2147/CMAR.S191565. [DOI] [PMC free article] [PubMed] [Google Scholar]
- 38.Xu C, Wang X, Liu K, et al. Structural basis for selective binding of m6A RNA by the YTHDC1 YTH domain. Nat Chem Biol. 2014;10(11):927–29. doi: 10.1038/nchembio.1654. [DOI] [PubMed] [Google Scholar]
- 39.Nishizawa Y, Konno M, Asai A, et al. Oncogene c-Myc promotes epitranscriptome m6A reader YTHDF1 expression in colorectal cancer. Oncotarget. 2018;9(7):7476–86. doi: 10.18632/oncotarget.23554. [DOI] [PMC free article] [PubMed] [Google Scholar]
- 40.Geuens T, Bouhy D, Timmerman V. The hnRNP family: Insights into their role in health and disease. Hum Genet. 2016;135(8):851–67. doi: 10.1007/s00439-016-1683-5. [DOI] [PMC free article] [PubMed] [Google Scholar]
- 41.Hu W, Lei L, Xie X, et al. Heterogeneous nuclear ribonucleoprotein L facilitates recruitment of 53BP1 and BRCA1 at the DNA break sites induced by oxaliplatin in colorectal cancer. Cell Death Dis. 2019;10(8):550. doi: 10.1038/s41419-019-1784-x. [DOI] [PMC free article] [PubMed] [Google Scholar]
- 42.Liu X, Liu L, Dong Z, et al. Expression patterns and prognostic value of m6A-related genes in colorectal cancer. Am J Transl Res. 2019;11(7):3972–91. [PMC free article] [PubMed] [Google Scholar]


