Abstract
Purpose:
The state-of-the-art method to quantify sodium concentrations in vivo consists in a fully relaxed 3D spin-density (SD) weighted acquisition. Nevertheless, most sodium MRI clinical studies use short-TR SD acquisitions to reduce acquisition durations. We present a clinically viable implementation of the Variable Flip Angle (VFA) method for robust and clinically viable quantification of total sodium concentration (TSC) and longitudinal relaxation rates in vivo in human brain at 3 T.
Methods:
Two non-Cartesian steady-state spoiled ultrashort echo time (UTE) scans, performed at optimized flip angles, repetition time and pulse length determined under specific absorption rate constraints, are used to simultaneously compute T1 and total sodium concentration (TSC) maps using the VFA method. Images are reconstructed using the non-uniform Fast Fourier Transform algorithm and TSC maps are corrected for possible inhomogeneity of coil transmission and reception profiles. Fractioned acquisitions are used to correct for potential patient motion. TSC quantifications obtained using the VFA method are validated at first in comparison with a fully-relaxed SD acquisition in a calibration phantom. The robustness of similar VFA acquisitions are compared to the short-TR SD approach in vivo on seven healthy volunteers.
Results:
The VFA method resulted in consistent TSC and T1 estimates across our cohort of healthy subjects, with mean TSC of 38.1 ± 5.0 mmol/L and T1 of 39.2 ± 4.4 ms. These results are in agreement with previously reported values in literature TSC estimations and with the predictions of a 2-compartment model. However, the short-TR SD acquisition systematically underestimated the sodium concentration with a mean TSC of 31 ± 4.5 mmol/L.
Conclusion:
The VFA method can be applied successfully to image sodium at 3 T in about 20 min and provides robust and intrinsically T1-corrected TSC maps.
Keywords: 23Na MRI, Variable Flip Angle, T1 mapping, Tissue sodium concentration
1. Introduction
Sodium (23Na) is the second most abundant magnetic resonance (MR) sensitive nucleus in soft tissues after hydrogen (1H). Sodium ions are found in intra- and extracellular compartments at concentrations of about 10–20 and 140–150 mmol/L, respectively. This concentration gradient, which is maintained by the energy dependent Na+/K+- ATPase (the sodium-potassium pump), has a major importance in the physiology of cells [1,2] as many transmembrane ionic transport processes of healthy cells are dependent on it [3]. For this reason, sodium magnetic resonance imaging (MRI) has been shown to provide valuable information about cellular viability in pathologies of the central nervous system such as stroke [4,5], Alzheimer’s disease [6], Multiple Sclerosis (MS) [7–12], Huntington’s disease [13] and tumors [14]. Heart, kidneys, and the musculoskeletal apparatus have been also successfully investigated by sodium MRI [15–17].
One goal of sodium MRI is the assessment of the local tissue sodium concentration (TSC) in the brain, which represents the weighted average of local intracellular and extracellular sodium concentrations. The regional distribution of TSC can be used to establish a link between disease status, monitor the progression of brain diseases, and the out-come of therapeutic interventions. For example, Zaaraoui et al. [9] have demonstrated that a difference in TSC values could be used to discriminate between early RRMS (Relapsing Remitting Multiple Sclerosis) and advanced RRMS. Also, reduced sodium changes have been proposed as a predictive biomarker for penumbra viability in combination with diffusion and perfusion MRI for patients with ischemic stroke [18].
However, sodium MRI remains quite challenging due to its low MR sensitivity (9.25% compared to 1H), its low concentration in vivo (about 30 to 50 mmol/L in brain parenchyma), and to the fact that its spin quantum number is 3/2. The latter means that sodium ions exhibit a nuclear quadrupolar moment that interacts with local electric field gradients, which, in biological tissues, give rise to fast bi-exponential relaxations of both the transverse and longitudinal MR magnetizations [19].
In the human brain, the transverse sodium signal decay has a fast-relaxing component in the range of 0.8–5 ms (T2f) and a slow-relaxing component in the range of 15–30 ms (T2s); the longitudinal relaxation (T1), in theory bi-exponential too [20], has been only reported using mono-exponential models with relaxation times in the range of 15–40 ms [21]. In liquid environments, such as the cerebrospinal fluid (CSF), the quadrupolar interaction averages to zero due to motional narrowing since ω0τc ≪ 1 (where ω0 is the Larmor frequency and τc the correlation time), and a mono-exponential signal relaxation in the range of 50–60 ms is found for both transverse and longitudinal relaxation times [19].
To minimize signal losses due to the short transverse relaxation times in sodium MRI, ultra-short echo time sequences (UTE) are commonly used in combination with non-Cartesian k-space trajectories [19], such as 3D radial [22], twisted projection imaging (TPI) [23], stacks of spirals, 3D cones [24], and FLORET [25]. These sequences provide high signal-to-noise ratio (SNR) and increased image resolution, while keeping total acquisitions times (TA) within 20 min [26].
Independently from the sequence used, the state-of-the-art approach for TSC mapping consists in a 3D spin-density (SD) weighted acquisition. To minimize longitudinal and transversal relaxation effects, 23Na signal is acquired shortly after a non-selective 90° flip angle radio-frequency (RF) pulse with a relatively long repetition time (TRЄ [3,5] times T1), along a trajectory that originates at the center of k-space.
Images obtained from such acquisitions are then corrected for coil transmission field (B1+), coil reception sensitivity (B1−), and, some-times, for global saturation effects [27]. Finally, images are transformed into TSC maps by means of a signal calibration curve obtained from one, two or more reference phantoms of known sodium concentrations and known relaxation times, placed in same the field-of-view (FOV). Alternatively, those phantoms can be scanned separately with the same sequence parameters and same coil loading (phantom replacement method).
The SD approach, however, suffers from sub-optimal SNR efficiency [28]. Therefore, shorter TRs (100–120 ms) are generally adopted [6–10] so as to improve SNR and achieve scanning times compatible with clinical research (TA ≤ 20 min). Nevertheless, shorter TR introduce saturation effects which could ideally be corrected using a T1 map at the same resolution [29]. By default, sodium images are usually corrected using a global T1 relaxation time, leading to quantification error of about 10% in liquid environments [29].
In conventional 1H MRI, the Variable Flip Angle (VFA) method has been proposed to address this problem of uncorrected T1-weighting. In this method, multiple spoiled steady-state scans (n ≥ 2) performed at different flip angles are used to compute simultaneously T1 and spin density maps in short acquisition times and with a high degree of accuracy [30–34].
The goal of this work was, therefore, to implement the VFA method as a clinically viable alternative for the in vivo quantification of total sodium concentration TSC in the human brain on an ~3 Tesla MR whole-body scanner. For this purpose, we used two ultra-short echo time sodium images acquired with a FLORET sequence in the spoiled steady-state at two optimal flip angles. Optimization of the flip angles, which were calculated to maximize SNR under specific absorption rate (SAR) constraints was achieved by quantum-mechanical simulation [28]. Sodium quantification results from a home-made phantom and from seven healthy volunteers obtained with the VFA method were compared to the SD method.
2. Materials and methods
2.1. Theory
The VFA method relies on two or more steady-state spoiled gradient recalled echo (SPGR) acquisitions at two or more flip angles. The regional signal intensity of a sodium SPGR acquisition is given by the Ernst equation:
| (1) |
where K is a constant depending on the system, M0 = ρB1− is the equilibrium magnetization, B1− the reception profile, the flip angle, B1+ the excitation field, TR the repetition time, TE the echo time, T1 the longitudinal relaxation time, T2f* and T2s* the fast and slow transverse relaxation constants for 23Na in biological tissues, respectively. If an ultra-short TE is used (TE ≤ 0.5 ms):
| (2) |
For instance, if one considers a TE of 0.1 ms, T2f* of 2 ms and T2s* of 25 ms, this term is of about 0.97.
If one assumes (for now) that B1+ = B1− = 1, Eq. (1) can be re-written according to the VFA method for T1 mapping [33] in the form:
| (3) |
with:
| (4a) |
| (4b) |
from which M0 and T1 can be extracted from the relationships:
| (5a) |
| (5b) |
Through a linearization of Eq. (1), Sabati et al. [33] showed that Eq. (5a) can be calculated independently of T1 if at least two acquisitions (S1 and S2) with variable flip angles α1 and α2 are considered:
| (6) |
| (7) |
The influence of imperfect B1+ and B1− fields on the M0 and T1 maps can be corrected according to [35,36]:
| (8) |
with the B1− map estimated from the experimental B1+ profile according to the reciprocity principle [37].
2.2. Optimal VFA angles under specific absorption rate (SAR) constrains
In the standard VFA method, the optimal combination of flip angles 1 and 2 (providing signals S1 and S2) that maximizes the SNR of the M0 maps for a given pair (TR, T1) can be found by minimizing the error function associated to the M0 map and based on measured signal Si in each image according to [33]:
| (9) |
Where the partial derivatives of M0 are given by:
| (10) |
With A, B and C are defined by Eq. (7) and where E* accounts for the T2* decay as defined in Eq. (2).
Using this equation, the a priori optimal flip angles for apparent transverse and longitudinal relaxation times at 3 T (T2f = 4 ms, T2s = 30 ms and T1 = 35 ms) are α1 = 27° and α2 = 116°. However, as shown by Stobbe et al. [28] in steady-state sodium imaging the maximum applicable SAR in normal mode scans poses a limitation on the selection of the optimal combination of TR, flip angle and pulse length (τRF).
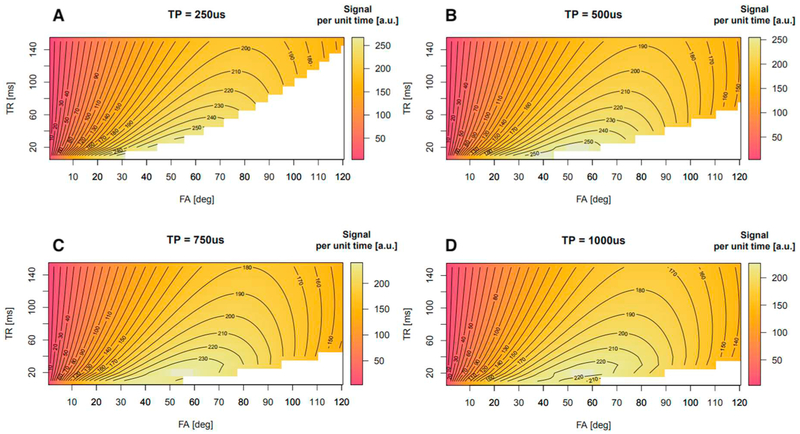
To find the maximum achievable flip angle for a given (TR, τRF) pair in brain tissues (T2f* = 1.7 ms, T2s* = 22.7 ms and T1 = 35 ms [19], we simulated the signal per unit time achievable under SAR constraints. A reference scan done on one subject at 99% of the maximum allowed SAR resulted in a reference triplet: TR = ~90 ms, α = 90°, and τRF = 0.5 ms that was used in the simulations. Fig. 1 shows the results of simulations for four different RF pulse lengths, τRF = {0.25, 0.5, 0.75, 1.0} ms. For each τRF we varied TR and flip angles and simulated the signal per unit time. White areas in the plots corresponded to SAR values equal to or exceeding 3 W/kg. These plots show two main aspects: first, longer pulse durations enable the use of larger flip angles; second, maximization of the acquired signal per unit of time can be achieved through short TRs.
Fig. 1.
Simulations of the acquired signal per unit of time for a T1w sodium acquisition according to TR and flip angle created by a square pulse under SAR constrains. Panels A to D illustrate that increasing the pulse duration for a given TR allows one to reach higher flip angles. The maximum value is reached with a 500 μs pulse length with a TR of 20 ms, which corresponds to Ernst Angle of brain tissues when considering a T1 of 35 ms.
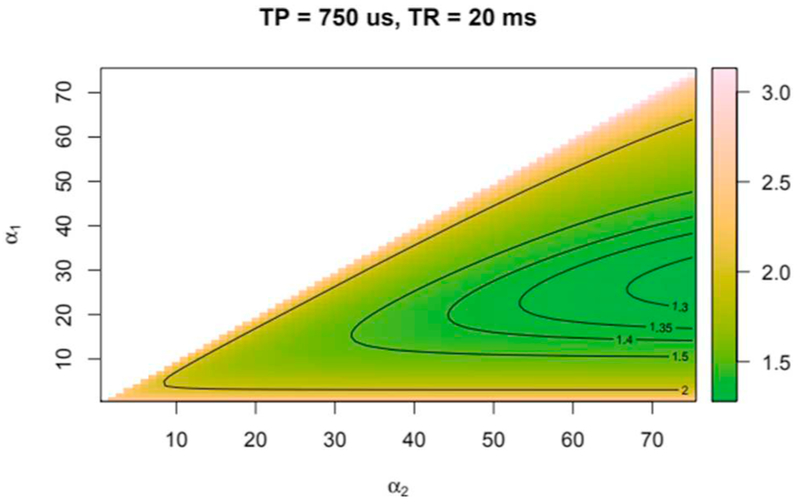
To minimize dead times after each readout (about 15 ms) and to have enough time to use spoiler gradients we chose a TR of 20 ms for our measurements. At this TR, Fig. 1 shows that the highest signal per unit time is reached with a pulse length of 500 μs and flip angle matching the Ernst angle. However, to stay in the SAR safety margin for a large range of subjects, we chose to use a 750 μs rectangular pulse. Furthermore, simulations predicted that with a TR of 20 ms and under SAR constraints it was not possible to reach a flip angle of 116° as stated in theory. Therefore, we used flip angles of 25° and 55°. The latter corresponded to the Ernst angle. Fig. 2 shows that these angles are still in the working range of the VFA method [33] and only a slightly increase of the noise component in the computed M0 image was expected.
Fig. 2.
Error function in M0 map as a function of the pair of flip angles chosen as described by Eq. (9).
2.3. MR acquisitions
All MRI scans were performed on a 3 Tesla whole-body scanner (PRISMA, Siemens Healthineers, Erlangen, Germany). Sodium scans were acquired using a dual-resonance 1H/23Na quadrature birdcage coil (Rapid Biomed GmbH, Rimpar, Germany) and a radiofrequency and gradient-spoiled 3D FLORET sequence [25]. Sampling was composed of 3 orthogonal hubs at α0 = 45° with 100 interleaves each. The readout duration was 15,610 μs. Spoiler gradients of 1 ms length dephased residual transverse magnetization similarly to a FLASH sequence. Shimming of the static magnetic field was performed on the 1H channel using a 3D double-echo steady state sequence (3D-DESS). Calibration of the sodium reference voltage was performed manually at the beginning of each session using a series of non-localized pulse-acquire spectra and looking for the voltage that maximized the 23Na resonance peak.
The B1+ field was measured with the FLORET sequence using a double angle method (DAM) approach [38] with a α1/α2 = 60°/120°, TR/TE = 80/0.475 ms and a spatial resolution of 6 mm isotropic. The acquisition time was 2 min per scan. The B1+map was used to correct our computed T1 and M0 maps as detailed by Eq. (8).
Each experimental session comprised a SD acquisition with TR = 120 ms [7–10], TE = 0.475 ms and α = 90° and a VFA acquisition with TR = 20 ms, TE = 0.475 ms, and α1/α2 = 25°/55°. For both acquisitions, the echo-time (TE) corresponded to the time between the center of the excitation pulse and the beginning of the non-Cartesian k-space sampling. For our measurement, we chose a 750 μs long rectangular pulse in order to respect SAR constrains as described in the Section 2.2. The FOV of 256 × 256 × 256 mm3 was sampled at a nominal 4 × 4 × 4 mm3 resolution. Crusher gradients of length = 1 ms in x, y, and z directions was played out right at the end of readout at 80% of the maximum gradient amplitude.
To improve image SNR, signal averaging was required. This was realized for both SD and VFA acquisitions by performing a series of short scans, each 3-minute long. In this way a retrospective motion correction was also possible. A single VFA acquisition, therefore, consisted in 3 short scans at each flip angle, resulting in a total acquisition time of 18 min which is in the range of traditional 23Na acquisitions. For fair comparison 6 short scans were performed for the SD acquisition. The total number of RF excitations for the VFA was 54,000, while the total number of excitations produced for each SD scans was 9000.
2.4. Image processing
Image reconstruction of both SD and VFA datasets was performed in the exact same way: raw k-space datasets from each scanning block were downloaded from the MR scanner and independently reconstructed off-line into separate complex images using a non-uniform fast Fourier transform algorithm (NUFFT) [39] implemented in MA-TLAB (The Mathworks, Natick, USA). No filtering was applied to the resulting images. The magnitude image resulting from the first block was set as reference and a rigid-body motion correction algorithm was run on each following image. The resulting transformations matrices were then applied on the real and imaginary parts of each image, independently. A homodyne phase correction [40] was then applied to each complex image before being averaged in complex space. Finally, the magnitude of the averaged complex image was extracted. A non-local mean (NLM) filter was then applied to denoise images [41]. All image processing was performed in R [42] using ANTsR [43]. After reconstruction, B1+ maps were resized through linear interpolation to 4 mm isotropic and smoothed using convolution with a 10 × 10 × 10 mm Hanning kernel [33]. Uncorrected T1 and M0-weighted images were obtained from the two images at 25° and 55° according to Eqs. (5a), (5b) and (6). Finally, the SD image and both uncorrected T1 and M0 images were corrected for transmission and reception RF fields. Sodium Images were finally registered on the anatomical 1H MPRAGE.
2.5. Extraction of TSC maps
SD and VFA M0 images were converted into TSC maps using a 2-points linear intensity calibration. This was performed using 2 reference tubes (volume = 50 mL, inner diameter 27 mm) filled with 2% [w/w] agarose gel at 51 mmol/L and 102 mmol/L. For measurements on phantom these were inside the phantom (see next section), while during volunteer measurements the tubes were placed on both sides of the head of the volunteer.
2.6. Phantom measurements
A home-built cylindrical phantom was used to compare TSC maps obtained from the SD and VFA methods. Fig. 3A shows its schematics. The phantom had an inner diameter of 20 cm, a length of 30 cm and was filled with 80 mmol/L saline solution. Four test tubes (volume = 50 mL, inner diameter 27 mm) filled with 2% and 6% [w/w] agarose gels each at two saline solutions of concentrations (51 and 102 mmol/L were placed in the central region of the phantom. To produce gels, the saline solutions and the agarose powder were poured in the tubes. The mixtures were then gently heated above 65.5 °C in a water bath and successively cooled down to room temperature. The phantom also includes an array of smaller tubes (volume = 20 mL, inner diameter 15 mm) placed at its perimeter which were filled with saline solutions with concentrations in the range 25–150 mmol/L.
Fig. 3.
The home-built phantom used for testing. From left to right: schematics (not scaled), structure revealed by a standard 3D FLASH acquisition, two steady-state sodium MR acquisition at the chosen flip angles of 25° and 55°, respectively and the B1+ field. The phantom has an inner diameter of 20 cm and 30 cm length and was filled with saline solution at 80 mmol/L. The phantom also included 4 Falcon 50 mL tubes with 27 mm diameter and filled with agarose gels at 2% and 6% [w/w] each at sodium concentrations of 51 and 102 mmol/L. Ten smaller tubes with 15 mm diameter with saline at concentrations ranging from 10 to 150 mmol/L, were equidistantly distributed along the internal perimeter of the cylinder.
In addition to the measurement protocol described above, a set of SD acquisitions with TRs of 100, 120, 150, 200, and 300 ms and α = 90° was performed to characterize the effects of longitudinal magnetization saturation on TSC maps. These data were compared to the VFA scan with TR = 20 ms and α1/α2 = 25°/55°. All in vitro measurements were performed at a controlled room temperature of 20 ± 2 °C.
2.7. In vivo measurements
Seven healthy volunteers (4 males and 3 females; mean age of 32 ± 11; age-range 21–59 years old), took part to the study, which was approved by the local IRB. All participants provided written informed consent prior to scans. The two aforementioned calibration tubes were placed in the coil and imaged with the patient as external references of concentration. Sodium images were acquired first and then volunteers were briefly taken out of the scanner and the double-tuned sodium-proton coil was exchanged with a 64-channel head-neck 1H coil. Thereafter volunteers were repositioned and high-resolution anatomical T1 images of the head were acquired using an MPRAGE sequence: TR = 2300 ms, TI = 900 ms, TE = 2.3 ms, FA = 7°, TA = 7 min, at 0.8 mm isotropic resolution). These were segmented using ANTs [43] to obtain masks of the grey matter (GM), white matter (WM) and cerebrospinal fluid (CSF), which were registered to the sodium image space for image analysis [43]. To reduce contamination coming from the strong CSF signal, parenchyma mask were eroded by a 4 mm radius.
3. Results
3.1. In vitro results
Fig. 3A shows the schematics of the home-built phantom. The central axial slice of a 3D image obtained with a 1H 3D-FLASH sequence is shown in Fig. 3B. Fig. 3C–D shows the complex-averaged and de-noised images resulting from the steady-state sodium scans at flip angles of 25° and 55°, respectively. The central slice of the B1+ field produced by the coil is shown in panel E.
Fig. 4 shows TSC maps obtained with the SD method at increasing TRs, and the TSC and T1 maps obtained from the VFA method. No concentration differences were observed in the agarose gels for the whole range of TRs. TSC maps obtained with the SD and VFA methods at TR equal or above 200 ms exhibit comparable contrasts. On the other hand, a lower concentration in the liquid compartment is found for TR shorter than 200 ms. Average T1 relaxation times obtained with the VFA method returned a value of 52.5 ± 2.5 ms for the central liquid compartment, 39.5 ± 2.5 ms for the 2% agarose tubes and 29.8 ± 2.4 ms for the 6% agarose tubes. These values were in good agreement with additional measurements of T1 made using an image-based inversion recovery technique (data not shown) that yielded average T1 values of 54.5 ms, 37.3 ms and 24.0 ms for liquid, 2% and 6% agarose tubes, respectively.
Fig. 4.
Sodium concentration maps acquired using spin density weighting with varying TR values in the range 100–300 ms and compared to the concentration map produced by the VFA method. This method also returns a T1 map of the object. It is possible to notice that the maps obtained with the spin density acquisition performed with the longest TR and from the VFA method have the same contrast, while at shorter TRs, due to saturation the liquid component the images have stronger contrast. The computed T1 map matches well the structure and the relaxation properties of the phantom.
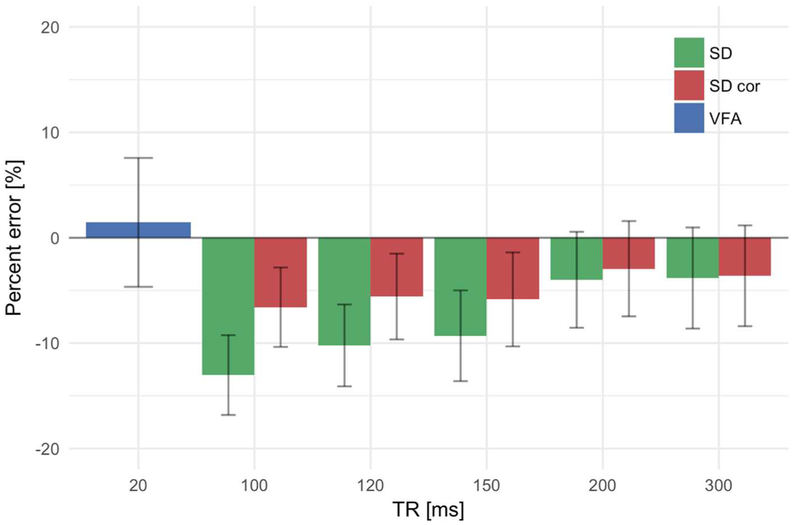
Fig. 5 shows the quantification error (obtained by standard error propagation theory [7] in the TSC quantification in a ROI placed in the center of the phantom and containing only saline for the VFA and the SD methods. To show the effects of saturation, the plot also shows the error associated to SD TSC maps corrected as in [28] using the T1 map obtained from the VFA data. This plot shows that the VFA and the fully relaxed SD (TR ≥ 200 ms) methods resulted in comparable concentration values. For uncorrected SD acquisitions with shorter TR, quantification errors reach 10% as previously reported [29]. A T1 correction using the VFA T1 map manage to reduce these errors to about 5% for the shorter TRs.
Fig. 5.
Percent errors in the quantification of TSC in the central compartment of the phantom filled with saline. Concentration measurements were repeated at increasing TRs. The effect of saturation is clearly noticeable for the SD method and stronger at short TRs. Saturation corrections of SD the acquisitions using the VFA T1 map show an improvement and a reduction of the percent error below the 5% mark. TSC measurements obtained with VFA are intrinsically T1 corrected and are in agreement with values obtained from a SD acquisition with no saturation effects (TR = 300 ms).
3.2. In vivo results
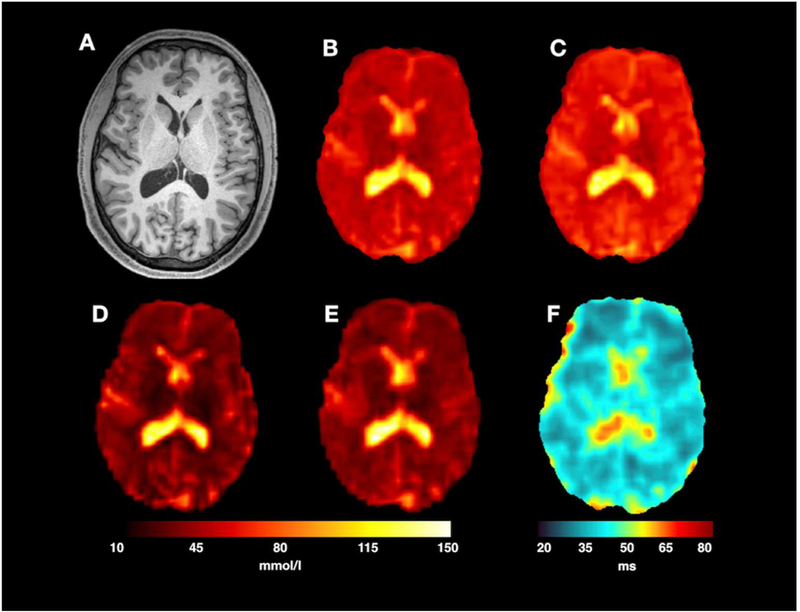
Fig. 6 shows the results obtained on one representative subject. The anatomical image shown in Fig. 6A was used as reference and all sodium images and maps were co-registered to it. VFA scans with flip angles α1/α2 of 25°/55° are shown in Fig. 6B and C, respectively. TSC maps obtained from the SD and VFA methods are shown in Fig. 6D and E, respectively. Fig. 6F shows the sodium T1 map obtained from the VFA method. Both TSC maps obtained from the SD and the VFA methods show the same contrast. SD maps have a slightly better image resolution. This is particularly noticeable in proximity of sulci were the CSF signal is spilling over to neighboring voxels slightly more in VFA images than in SD images. Moreover, sodium T1 maps clearly show the separation between brain parenchyma and CSF.
Fig. 6.
Images from a single subject scanning session. A standard MPRAGE image (A) was used to acquire the brain anatomy. Two T1-weighted 23$Na SPGR acquisitions with FA 25° (B) and 55° (C) (TA of 9 min each) formed the basis for the VFA acquisition. For SNR comparison, images (B) and (C) are shown with the same intensity scaling. TSC map resulting from the SD and the VFA methods are shown in (D) and (E), respectively. For a fair comparison, the acquisition time, TA, for the SD method was set to 18 min. The T1 map resulting from the VFA method is shown in (F). Calibration tubes were masked for results display.
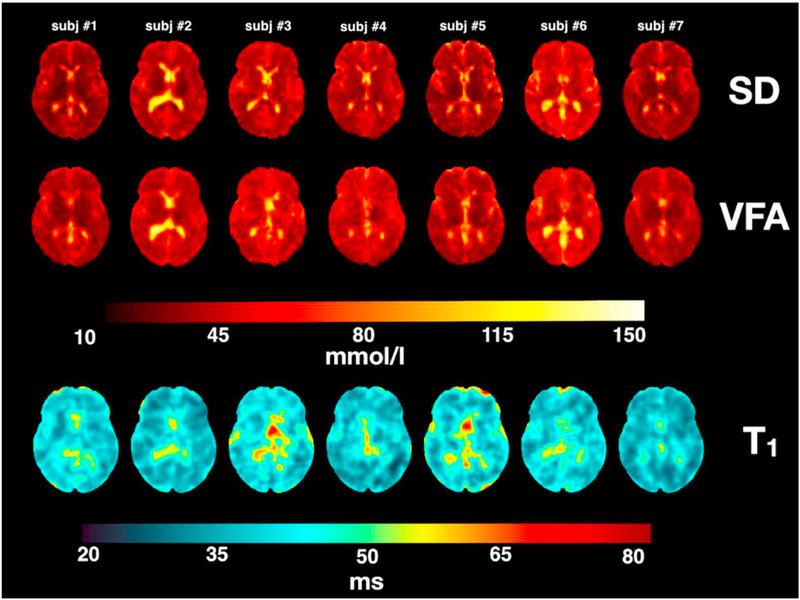
Fig. 7 shows all TSC maps (SD and VFA) and all T1 maps of all measured subjects. As noted above for the single subject, both SD and VFA methods delivered TSC maps that show the same type of contrast across all subject.
Fig. 7.
SD and VFA-derived TSC maps along their corresponding T1 maps from all 7 subjects. Calibration tubes were masked to display results.
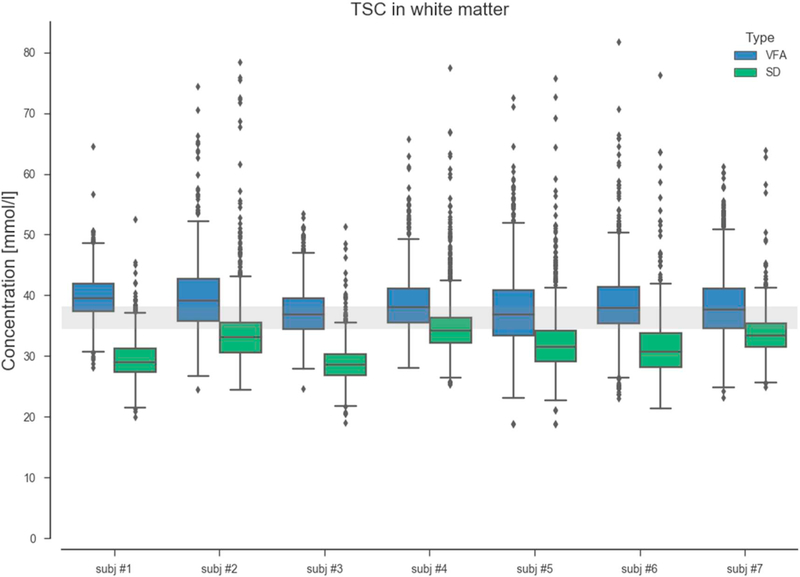
A closer inspection to the TSC maps obtained by both methods is shown in Fig. 8. This figure shows the distribution of TSC values extracted from WM masks from each scanned subject. On average, the TSC values obtained from the VFA method show a good agreement and are aligned to the theoretical 2-compartment model TSC [44]. On the other hand the TSC calculated from the SD method show a deviation from the expected values. The group TSC averages were respectively 38.4 and 31.8 mmol/L) for the VFA and SD methods. A two-way t-test confirmed the statistical significance of the difference at a level of p < 0.001.
Fig. 8.
Boxplots TSC in white matter. Median TSC values resulting from VFA method are in agreement with the 2-compartment model (TSC = 36–40 mmol/L). The relatively short TR of the standard SD measurements resulted in slight saturation of the extracellular compartment that lead to an underestimation of the TSC levels in the white matter.
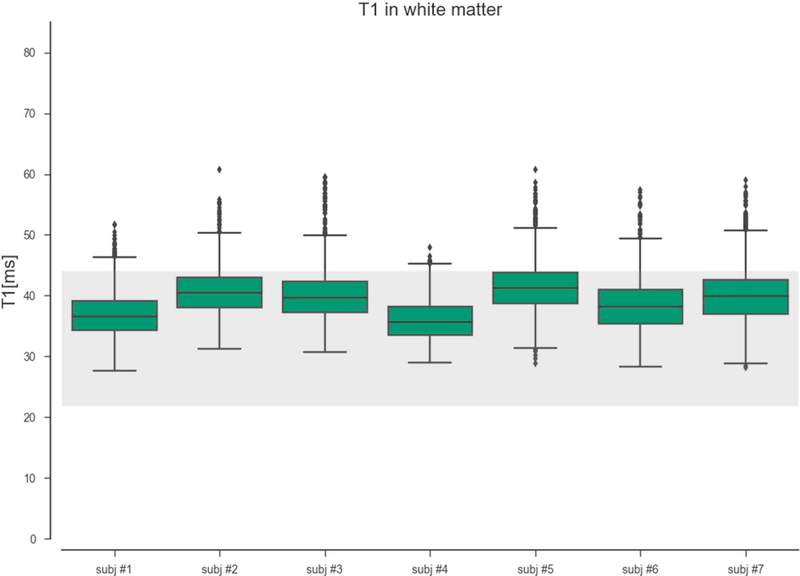
Fig. 9 shows the distribution of VFA-derived T1 estimates in the WM of each subject. Values obtained are relatively stable across all scanned subjects with some regional variabilities.
Fig. 9.
T1 values in the white matter are stable and in the range of the expected T1 values of brain tissues (T1Є [25,40]) ms [18].
4. Discussion
In this work, we have implemented and evaluated the VFA approach for the estimation of cerebral distributions of tissue sodium concentrations and longitudinal relaxation times in a clinical setting. Our VFA protocol was compared to the state-of-the-art SD approach.
First of all, phantom experiments demonstrated that the VFA approach yields a robust estimation of sodium concentration. Furthermore, this method has the additional benefit of producing T1 maps, and two steady-state sodium images of high SNR, all in the same acquisition time. The embedded T1 correction within the VFA method substantially reduces saturation effects, especially in liquid media. In comparison, TSC values obtained from short-TR SD acquisitions appeared to be under-estimated by up to 10% due to uncorrected T1-weighting. As a consequence, we believe that this enhanced quantification accuracy and robustness of our VFA 23Na MRI protocol could be of the utmost importance in the context of clinical investigations of brain pathologies.
Second, our in vivo tissue sodium concentrations measured with both VFA and SD methods yielded consistent results well within the range of sodium concentrations reported recently in the literature whether at 3 T [8–10,19,45,46] or at higher magnetic fields (7 T and 9.4 T) [29,47,48]. Furthermore, measured T1 values were in good agreement with previously reported values [19] and represent an interesting, complementary and novel information for pathological studies.
Saturation correction is an important aspect when acquiring in vivo images where sodium is present in different biological environments. Indeed, typical in vivo SD acquisitions use a TR of 120 ms which enables almost full relaxation of bound or fast-relaxing sodium (T1f), but only a partial relaxation of free or slow-relaxing sodium (T1s). As such, the sodium concentration in pathologies for which an increase of sodium relaxation times could occur due to cell swelling or cell death, might have been underestimated by using a short TR scan.
Uncorrected saturation effect in the SD approach could hamper the detection of changes in TSC. Using the VFA method, the computation of a T1 map and the corresponding T1-corrected TSC map should properly account for those local changes in tissues properties with limited drawbacks.
The choice of our acquisition flip angles was motivated by optimizing sampling duration compared to SD acquisition. SAR constrains made us consider other angles than the theoretical best VFA angles. Increasing TR and or pulse duration would therefore be a solution to reach higher flip angles. While the first solution is clearly degrading the signal sampling optimization, the second also tends to increase signal decay during pulse which is not desirable.
The need of implementing advanced partial volumes correction methods for non-proton MRI is still of great importance. However, this aspect was beyond the scope of this work. Clearly, increasing acquisition times and spatial resolution would have allowed to reduce partial volume effects. However our imaging protocol would have lost some of its relevance for clinical research, which was an objective of this work. Image resolution of the VFA-derived TSC map is slightly worse than the SD-derived one. Given that acquisitions were performed using the exact same k-space trajectory and TE, this effect cannot be attributed to the sequence point-spread-function. Rather, this effect should be attributed to the different number of registrations and interpolations that were applied to the original images before calculating the TSC maps. A relatively simple way to reduce partial volume effects comes from the use of the proton anatomical images that can be used to separate signal contributions from liquid and tissues [49].
With a total acquisition time of 18 min at 3 T, the VFA approach fits well within the constraints of most clinical research settings. Moreover, the use of short scanning blocks was appreciated by our subjects and will be an advantage for studies including patients. Furthermore, rigid-body motion estimation and correction will be advantageous at higher resolution or for long patient scans if subject motion is expected.
Increasing the spatial resolution would help in limiting noise propagation and partial volume effect. However this would come at the expense of image SNR or acquisition time. Therefore, the use of MR scanners at high and ultra-high magnetic fields may allow for increased signal intensities that can be used to further accelerate acquisitions, improve spatial resolutions or the robustness of our T1 estimation by acquiring additional images with different flip angles. Already, an application of this method to 31P MRI at 7 T provided promising results [34] despite the modest concentrations of phosphorylated metabolites phosphocreatine and adenosine triphosphate in the brain. However, one must consider that 23Na MRI acquisitions at 7 T or higher would require B1 and B0 inhomogeneities to be accounted for in our reconstruction and quantification pipeline. For this study at 3 T, we considered that B0 inhomogeneities were negligible. Finally, the combination of the VFA approach with a multi-echo sequence [50] may provide more information for the discrimination of intra and extracellular sodium concentrations in tissues.
5. Conclusion
In conclusion, we demonstrate the feasibility of using a Variable Flip Angle method to compute total sodium concentration maps comparable to state-of-the-art spin-density weighted acquisition in term of sensitivity with the benefit of an additional T1 map and a concentration map intrinsically corrected for T1-weighting.
Acknowledgment
Authors would like to acknowledge J. Bernard (CEA) and S. Hamm (UKA) for building the phantoms used for tests.
Alexandre Vignaud is consultant for Siemens Healthcare but on different topics.
Other authors have no conflict of interests to disclose.
Grant support
The positions of Kathrin Reetz, Sandro Romanzetti, and the measurements were funded by the German Federal Ministry of Education and Research (BMBF01GQ1402).
Funding was provided by France Life Imaging (FLI) for Arthur Coste to go to Aachen for experimentations.
Funding support from the National Institutes of Health (NIH) grants R21CA213169, R03AR065763, R01EB026456 and R01NS097494 were provided to Guillaume Madelin.
Footnotes
Parts of that work were submitted as abstracts for the 25th ISMRM meeting.
References
- [1].Rose AM, Valdes R. Understanding the sodium pump and its relevance to disease. Clin Chem 1994;40:1674–85. [PubMed] [Google Scholar]
- [2].Murphy E, Eisner DA. Regulation of intracellular and mitochondrial sodium in health and disease. Circ Res 2009;104(3):292–303. [DOI] [PMC free article] [PubMed] [Google Scholar]
- [3].Syková E The extracellular space in the CNS: its regulation, volume and geometry in normal and pathological neuronal function. Neuroscientist 1997;3(1):28–41. [Google Scholar]
- [4].Hussain M, Stobbe R, Bhagat Y, Emery D, Butcher K, Manawadu D, et al. Sodium imaging intensity increases with time after human ischemic stroke. Ann Neurol 2009:55–62. [DOI] [PubMed] [Google Scholar]
- [5].Tsang A, Stobbe R, Asdaghi N, Hussain M, Bhagat Y, Beaulieu C, et al. Relationship between sodium intensity and perfusion deficits in acute ischemic stroke. J Magn Reson Imaging 2011;33(1):41–7. [DOI] [PubMed] [Google Scholar]
- [6].Mellon E, Pilkinton D, Clark C, Elliot M, Witschey WI, Borthakur A, et al. Sodium MR imaging detection of mild Alzheimer disease: preliminary study. Am J Neuroradiol 2009:978–84. [DOI] [PMC free article] [PubMed] [Google Scholar]
- [7].Inglese M, Madelin G, Oesingmann N, Babb J, Wu W, Stoeckel B, et al. Brain tissue sodium concentration in multiple sclerosis: a sodium imaging study at 3 Tesla. Brain 2010;133(3):847–57. [DOI] [PMC free article] [PubMed] [Google Scholar]
- [8].Paling D, Solanky B, Riemer F, Tozer D, Wheeler-Kingshott C, Kapoor R, et al. Sodium accumulation is associated with disability and a progressive course in multiple sclerosis. Brain 2013:2305–17. [DOI] [PubMed] [Google Scholar]
- [9].Zaaraoui W, Konstandin S, Audoin B, Nagel AM, Rico A, Malikova I, et al. Distribution of brain sodium accumulation correlates with disability in multiple sclerosis: a cross-sectional 23Na MR imaging study. Radiology 2012. September;264(3):859–67. [DOI] [PubMed] [Google Scholar]
- [10].Maarouf A, Audoin B, Konstandin S, Rico A, Soulier E, Reuter F, et al. Topography of brain sodium accumulation in progressive multiple sclerosis. Magn Reson Mater Phys 2014:53–62. [DOI] [PubMed] [Google Scholar]
- [11].Eisele P, Konstandin S, Griebe M, Szabo K, Wolf ME, Alonso A, et al. Heterogeneity of acute multiple sclerosis lesions on sodium (23Na) MRI. Mult Scler 2015;22(8):1040–7. [DOI] [PubMed] [Google Scholar]
- [12].Maarouf A, Audoin B, Pariollaud F, Gherib S, Rico A, Soulier E, et al. Increased total sodium concentration in gray matter better explains cognition than atrophy in MS. Neurology 2017;88(3):289–95. [DOI] [PubMed] [Google Scholar]
- [13].Reetz K, Romanzetti S, Dogan I, Saß C, Werner C, Schiefer J, et al. Increased brain tissue sodium concentration in Huntington’s disease — a sodium study at 4 T. Neuroimage 2012;2012:517–24. [DOI] [PubMed] [Google Scholar]
- [14].Babsky AM, Hekmatyar SK, Zang H, Solomon JL, Bansal N. Application of Na MRI to monitor chemotherapeutic response in RIF-1 tumors. Neoplasia 2005;7(7):658–66. [DOI] [PMC free article] [PubMed] [Google Scholar]
- [15].Sandstede J, Pabst T, Beer M, Lipke C, Baurle K, Butter F, et al. Assessment of myocardial infarction in humans with 23Na MR imaging: comparison with cine MR imaging and delayed contrast enhancement. Radiology 2001;221:222–8. [DOI] [PubMed] [Google Scholar]
- [16].Maril N, Rosen Y, Reynolds G, Ivanishev A, Ngo L, Lenkisky R. Sodium MRI of the human kidney at 3 Tesla. Magn Reson Med 2006;56(6):1229–34. [DOI] [PubMed] [Google Scholar]
- [17].Wang L, Wu Y, Chang G, Oesingmann N, Schweitzer M, Jerschow A, et al. Rapid isotropic 3D-sodium MRI of the knee joint in-vivo at 7 T. J Magn Reson Imaging 2009;30(3):606–14. [DOI] [PMC free article] [PubMed] [Google Scholar]
- [18].Wetterling F, Gallagher L, Mullin J, Holmes WM, McCabe C, Macrae IM, et al. Sodium-23 magnetic resonance imaging has potential for improving penumbra detection but not for estimating stroke onset time. J Cereb Blood Flow Metab 2015. January;35(1):103–10. [DOI] [PMC free article] [PubMed] [Google Scholar]
- [19].Madelin G, Regatte R. Biomedical applications of sodium MRI in vivo. J Magn Reson 2013;38(3):511–29. [DOI] [PMC free article] [PubMed] [Google Scholar]
- [20].Van Der Maarel JRC. Relaxation of spin 3/2 in a non zero average electric field gradient. Chem Phys Lett 1989;155(3):288–96. [Google Scholar]
- [21].Jaccard G, Wimperis S, Bodenhausen G. Multiple quantum NMR spectroscopy of S = 3/2 spins in isotropic phase: a new probe for multiexponential relaxation. J Chem Phys 1986;85(11):6282–93. [Google Scholar]
- [22].Nagel AM, Laun FB, Weber MA, Matthies C, Semmler W, Schad LR. Sodium MRI using a density-adapted 3D radial acquisition technique. Magn Reson Med 2009;62:1565–73. [DOI] [PubMed] [Google Scholar]
- [23].Boada FE, Gillen JS, Shen GX, Chang SY, Thulborn KR. Fast three dimensional sodium imaging. Magn Reson Med 1997;37:706–15. [DOI] [PubMed] [Google Scholar]
- [24].Gurney PT, Hargreaves B, Nishimura D. Design and analysis of a practical 3D CONES trajectory. Magn Reson Med 2006;55:575–82. [DOI] [PubMed] [Google Scholar]
- [25].Pipe J, Zwart N, Aboussouan E, Robison R, Devaraj A, Johnson K. A new design and rationale for 3D orthogonally oversampled k-space trajectories. Magn Reson Med 2011:1303–11. [DOI] [PubMed] [Google Scholar]
- [26].Romanzetti S, Mirkes CC, Fiege DP, Celik A, Felder J, Shah NJ. Mapping tissue sodium concentration in the human brain: a comparison of MR sequences at 9.4 Tesla. Neuroimage 2014. August 1;96:44–53. 10.1016/j.neuroimage.2014.03.079. [Epub 2014 Apr 8]. [DOI] [PubMed] [Google Scholar]
- [27].Lommen J, Konstandin S, Krämer P, Shad L. Enhancing the quantification of tissue sodium. NMR Biomed 2016;29(2):129–36. [DOI] [PubMed] [Google Scholar]
- [28].Stobbe R, Beaulieu C. Sodium imaging optimization under specific absorption rate constraint. Magn Reson Med 2008;59(2):345–55. [DOI] [PubMed] [Google Scholar]
- [29].Mirkes CC, Hoffmann J, Shajan G, Pohmann R, Scheffler K. High-resolution quantitative sodium imaging at 9.4 Tesla. Magn Reson Med 2015;73(1):342–51. [DOI] [PubMed] [Google Scholar]
- [30].Deoni SC, Rutt BK, Peters TM. Rapid combined T1 and T2 mapping using gradient recalled acquisition in the steady state. Magn Reson Imaging 2003;49(3):515–26. [DOI] [PubMed] [Google Scholar]
- [31].Cheng H, Wright G. Rapid high-resolution T1 mapping by variable flip angles: accurate and precise measurements in the presence of radiofrequency field inhomogeneity. Magn Reson Med 2006:566–74. [DOI] [PubMed] [Google Scholar]
- [32].Preibisch C, Deichmann R. T1 mapping using spoiled FLASH-EPI hybrid sequences and varying flip angles. Magn Reson Imaging 2009;62(1):240–6. [DOI] [PubMed] [Google Scholar]
- [33].Sabati M, Maudsley AA. Fast and high-resolution quantitative mapping of tissue water content with full brain coverage for clinically-driven studies. Magn Reson Imaging 2013;31(10):1752–9. [DOI] [PMC free article] [PubMed] [Google Scholar]
- [34].Coste A, Vignaud A, Ciuciu P, Boumezbeur F, Amadon A, Mauconduit F, et al. 31P MR imaging and concentration measurements. Proceedings of the 24th annual meeting of ISMRM, Singapore, Singapore 2016. [Google Scholar]
- [35].Wang HZ, Riederer SJ, Lee JN. Optimizing the precision in T1 relaxation estimation using limited flip angles. Magn Reson Med 1987. November;5(5):399–416. [DOI] [PubMed] [Google Scholar]
- [36].Helms G, Dathe H, Dechent P. Quantitative FLASH MRI at 3 T using a rational approximation of the Ernst equation. Magn Reson Med 2008. March;59(3):667–72. [DOI] [PubMed] [Google Scholar]
- [37].Hoult DI. The principle of reciprocity in signal strength calculations—a mathematical guide. Concepts Magn Reson 2000;12(4):173–87. [Google Scholar]
- [38].Stollberger R, Wach P. Imaging of the active B field in vivo. Magn Reson Med 1996:246–51. [DOI] [PubMed] [Google Scholar]
- [39].Fessler J, Sutton B. Nonuniform fast Fourier transform using min-max interpolation. IEEE Trans Signal Process 2003:560–74. [Google Scholar]
- [40].Noll DC, Nishimura DG. Homodyne detection in magnetic resonance imaging. IEEE Trans Med Imaging 1991:154–63. [DOI] [PubMed] [Google Scholar]
- [41].Buades A, Coll B, Morel JM. A non-local algorithm for image denoising. Computer vision and pattern recognition. 2005. p. 44. [Google Scholar]
- [42].R Core Team. R: A language and environment for statistical computing. Vienna, Austria: R Foundation for Statistical Computing; 2016. https://www.R-project.org/. [Google Scholar]
- [43].Avants B, Tustison N, Song G. Advanced normalization tools (ANTS). 2011.
- [44].Thulborn K, Lui E, Guntin J, Jamil S, Sun Z, Claiborne T, et al. Quantitative sodium MRI of the human brain at 9.4 T provides assessment of tissue sodium concentration and cell volume fraction during normal aging. NMR Biomed 2016;29:137–43. [DOI] [PMC free article] [PubMed] [Google Scholar]
- [45].Madelin G, Kline R, Walvick R, Regatte R. A method for estimating intracellular sodium concentration and extracellular volume fraction in brain in vivo using sodium magnetic resonance imaging. Sci Rep 2014;4:4763. [DOI] [PMC free article] [PubMed] [Google Scholar]
- [46].Atkinson IA, Lu A, Thulborn KR. Clinically constrained optimization of flexTPI acquisition parameters for the tissue sodium concentration bioscale. Magn Reson Med 2011;66:1089–99. [DOI] [PMC free article] [PubMed] [Google Scholar]
- [47].Qian Y, Zhao T, Zheng H, Weimer J, Boada FE. High-resolution sodium imaging of human brain at 7 T. Magn Reson Med 2012;68:227–33. [DOI] [PMC free article] [PubMed] [Google Scholar]
- [48].Gilles A, Nagel AM, Madelin G. Multipulse sodium magnetic resonance imaging for multicompartment quantification: proof-of-concept. Sci Rep 2017;7:17435. [DOI] [PMC free article] [PubMed] [Google Scholar]
- [49].Niesporek S, Hoffmann S, Berger M, Benkhedah N, Kujawa A, Bachert P, et al. Partial volume correction for in vivo 23Na-MRI data of the human brain. Neuroimage 2015;112:353–63. [DOI] [PubMed] [Google Scholar]
- [50].Qian Y, Panigrahy A, Laymon C, Lee V, Drappatz J, Lieberman F, et al. Short-T2 imaging for quantifying concentration of sodium (23Na) of bi-exponential T2 relaxation. Magn Reson Med 2015;74(1):162–74. [DOI] [PMC free article] [PubMed] [Google Scholar]


