Abstract
Purpose:
Evaluate the possibility to reduce specific energy absorption rate (SAR)-induced maximum temperature and thermal dose by rearranging the order and spacing of sequences without increasing duration of the MRI examination.
Methods:
Using numerical simulations based on an actual SAR-intensive MRI examination, optimizations to reduce either maximum temperature or thermal dose were performed. For each permutation of groups of sequences having the same patient table position, temperature and thermal dose were computed very rapidly using recently published methods. Disposition of sequences was further adjusted by optimizing the spacing between each sequence without exceeding the original exam duration.
Results:
The maximum simulated temperature in the original exam was 42.38°C, and the maximum thermal dose was 3.23 cumulative effective minutes at 43°C (CEM43). After optimization to reduce maximum temperature, it was 41.77°C, and after optimization to minimize the thermal dose, it was 1.42 CEM43.
Conclusion:
It is possible to reduce maximum temperature and thermal dose in the exam by changing the arrangement and spacing of the sequences without increasing the duration of the exam (by increasing TR or adding delays) or compromising image quality (by reducing flip angles).
Keywords: MRI, optimization, order, simulation, temperature
1 |. INTRODUCTION
Radiofrequency (RF) magnetic (B1) fields are used in MRI to excite the nuclei, such that they produce a detectable signal. Interaction of the concomitant RF electric field with conductive tissues of the patient generates heating, which might be a source of discomfort in the patient and even potentially cause tissue damage. To reduce risk, the International Electrotechnical Commission (IEC) has provided guidelines to limit a variety of values of specific energy absorption rate (SAR) and both core and local body temperature values reached during an MRI exam.1
Although SAR is currently the parameter most often used to assess safety in MRI, there is growing interest in use of temperature, because it is more directly related to risk. For example, methods were recently proposed to assess safety of MRI sequences based on temperature, where selective pulse design with temperature constraints was performed.2,3 In addition, because risk of damage to tissue depends only on the temperature time course more than simply the maximum temperature, an empirically derived measure of thermal dose known in the tissue ablation community has recently been used to evaluate risk for continuous exposure to set levels of RF energy in MRI.4 Temperature is affected by many parameters, such as global and local SAR, tissue electrical properties, physiological responses, and RF exposure duration.5 Typical methods used to reduce SAR involve either lengthening the exam time (by increasing the delay between sequences or increasing TR values) or compromising image quality by reducing the flip angle. However, the order of the sequences and the time gaps between sequences can affect temperature, and the same sequences in an MRI scan put in a different order can cause different temperature distributions through time. For example, temperature increases more rapidly in sequences with highest SAR, and can decrease in subsequent sequences with lower SAR or when no SAR is applied, such as in time gaps between each sequence. In this work, we use simulations to explore the possibility of reducing the maximum temperature and maximum thermal dose reached during an MRI exam by changing the order of the sequences in the scan and optimizing the duration of the gaps between each sequence, without increasing the duration of the exam.
2 |. METHODS
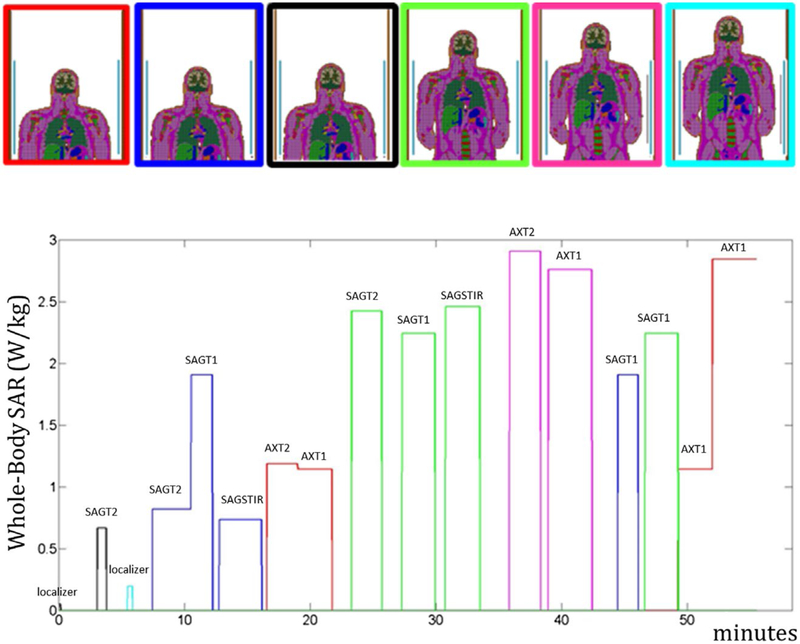
The optimization was developed and demonstrated based on the sequences of an actual comprehensive MRI spine exam with high-SAR sequences and with the patient table moved to 6 different positions (Figure 1). At different times during the exam, the 6-minute average exceeds the IEC Normal Mode limit of 2 W/kg, but not the IEC First Level Controlled limit of 4 W/kg. For each position of the patient, the electromagnetic fields generated with a birdcage coil operating at 128 MHz were simulated with the commercial software, xFDTD (Remcom, Inc., State College, PA), and using the body model “NLMMale” with a meshgrid resolution 5 × 5 × 5 mm, corresponding to 891,507 voxels.
FIGURE 1.
Simulated position of the body in the coil (6 different patient table positions) and whole-body SAR levels recorded during the MRI exam. The position of the body during the exam is identified by matching the color of the border in the upper image with the line color in the whole-body SAR plot. The purpose of each sequence is briefly indicated above it
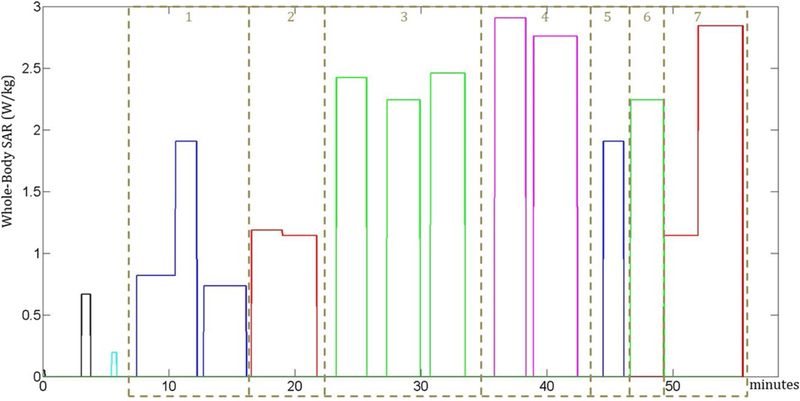
Except the first 3 sequences (low-SAR localizers), which must be performed at the beginning of the exam, the remaining sequences were assigned to 7 groups (Figure 2), where each group is composed of successive sequences performed in the same position of the patient table so that additional table movements are not introduced. The 7 groups were ordered according to all the possible permutations, and for each combination, both the temperature and thermal dose were computed. For the 2 combinations that minimize the maximum temperature and highest thermal dose value, the time gaps between sequences were optimized so that the maximum temperatures and thermal dose were minimized without exceeding the original duration of the exam.
FIGURE 2.
The whole-body SAR levels in the MRI scan are divided into 7 groups, where each group is composed of consecutive sequences performed in the same position of the body. The order of the groups is optimized. The first 3 sequences of the scan were not assigned to any group because they represent low-SAR localizers and they must be performed at the beginning of the scan
For each permutation, the local temperature throughout the subject is calculated through time by solving a commonly used bioheat equation with an added allowance for core body temperature (Tbl) to vary as a function of heating through time. The bioheat equation used can be written6 as Equation 1:
| (1) |
where T represents the temperature, ρ the material density, c the heat capacity, Q the heat produced by metabolic rate, W the local blood perfusion rate, k the heat conduction, and where subscript bl which indicates values for blood. A number of physiological responses are included in the simulation. First, blood temperature Tbl is allowed to change according to a published model for core body temperature in MRI,5 where it is dependent on many factors through time, including whole-body SAR, whole-body metabolic heat generation, heat lost to conduction to patient table, perspiration, respiration, convection, and radiation. Allowing core body temperature to be affected by whole-body SAR both increases the realism of the local temperature calculations and allows for meaningful comparison to regulatory limits on core body temperature. In addition, local perfusion W varied with local temperature according to the relation7 as shown by Equation 2:
| (2) |
where W0 is the basal perfusion value and SB is a parameter set to 0.8°C−1
For all permutations of the order of sequences in the exam, temperature simulations were performed with an extension of a method presented previously,8 where temperature is computed by summing the thermal responses T0n of each single group. In this work, responses are shifted to the time position of each of the 7 groups (tn) and summed to provide the temperature TL throughout all the exam (Equation 3).
| (3) |
The nonlinear effects are taken into account with a digital spatial filter9 as also described previously8 to compute the final temperature T. Even though the duration of the MRI exam was less than 1 hour, temperatures were computed for 2 hours to include elevated temperatures during the cooling period after the exam in the thermal dose computation. Thermal dose was computed as the sum of the cumulative equivalent minutes at 43°C (CEM43),10 as shown by Equation 4:
| (4) |
for the total duration of the temperature computation, where m denotes the minutes, Tm the temperature at the mth time interval, and R is a parameter equal to 0.5 for Tm >43°C and 0.25 for Tm <43°C.
Once the optimal order of groups was obtained, optimization of time gaps was performed with the Matlab function fminunc, where each time delay between sequences is an independent variable, and with the condition to not exceed the original duration of the exam.
To evaluate a case where table position did not vary, we also repeated the optimization procedure by optimizing the order and spacing of the sequences performed in an exam with 1 single table position. Specifically, we performed similar optimizations considering only the sequences corresponding to the first position indicated in Figure 1 (blue line).
3 |. RESULTS
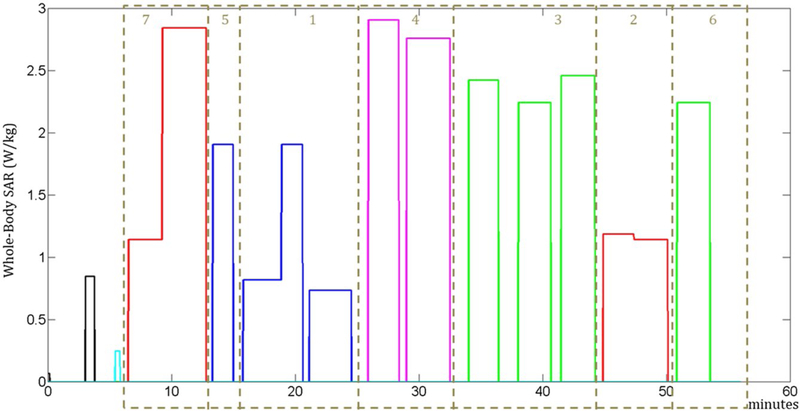
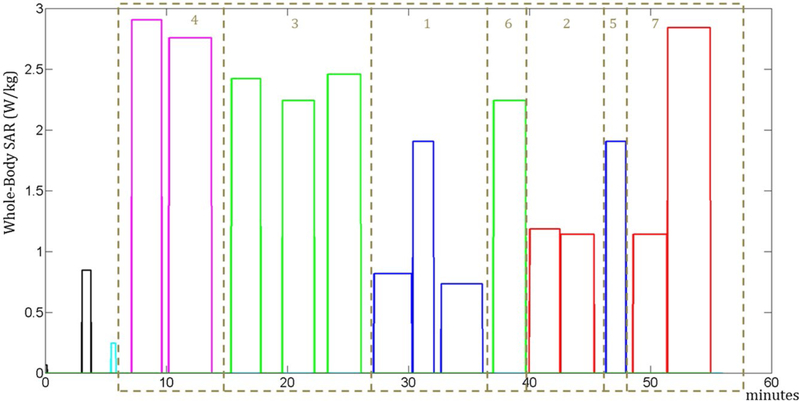
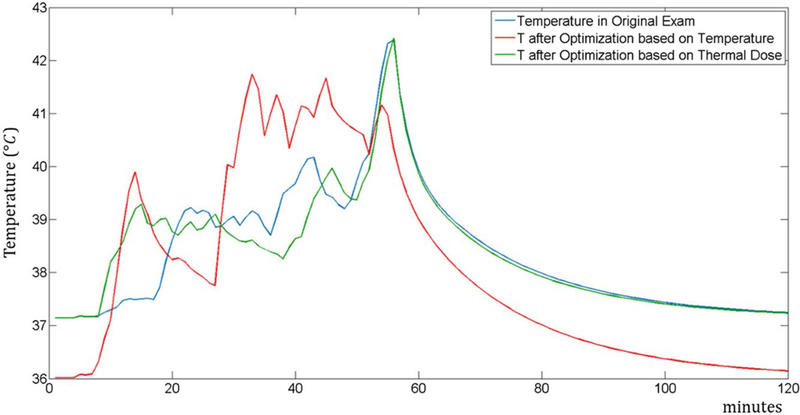
The arrangements of the groups that minimize the temperature and thermal dose are reported in Figures 3 and 4, respectively. Figure 5 shows the temperature at the location where the maximum temperature occurs for all 3 sequence orders. The maximum temperature occurs in the trapezius muscle for the original sequence order and that optimized to minimize thermal dose, but in a peripheral region of the triceps for the sequence order optimized to minimize the maximum temperature. This results in a lower baseline temperature for that case.
FIGURE 3.
Sequence whole-body SAR levels in the arrangement of the groups to minimize maximum temperature
FIGURE 4.
Sequence whole-body SAR levels in the arrangement of the groups to minimize maximum thermal dose
FIGURE 5.
Plot of temperature time course at the location of maximum temperature for 3 different orders of sequences in an MRI exam: the original spine MRI exam (blue), optimization based on minimization of temperature (red), and optimization based on minimization of thermal dose (green)
Without any optimization, the maximum temperature obtained in the exam was 42.38°C and the thermal dose was 3.23 CEM43.
When the order of the sequences was optimized to minimize the temperature, after the optimization the maximum temperature was 41.77°C and the thermal dose was 1.93 CEM43, and after the subsequent optimization of the time gaps between the sequences, the maximum temperature was 41.75°C and the thermal dose was 1.95 CEM43. For additional validation of our methods of accelerating temperature calculations, we computed the maximum temperature of this case with the slower full finite difference method and found a maximum temperature of 41.96°C, within the error estimated previously.8
When the order of the sequences was optimized to minimize the thermal dose, after the optimization the maximum temperature was equal to 42.33°C and the thermal dose was 1.45 CEM43, and after the subsequent optimization of the time gaps between the sequences, the maximum temperature was equal to 42.42°C and the thermal dose equal to 1.42 CEM43.
4 |. DISCUSSION
Results show that maximum temperature and thermal dose can be reduced by reordering the sequences in an exam and adjusting the time between them without lengthening the exam or reducing SAR (such as by reducing flip angle to suboptimal values) of any of the sequences.
In our simulations for a comprehensive spine exam, both before and after optimization, the maximum local temperature throughout the exam exceeded the maximum recommended temperature under IEC recommended limits, whereas the values of thermal dose are expected to be safe according to the threshold values reported previously.3
It can be observed that a significant reduction in temperature (by approximately 0.5°C) and thermal dose (by approximately 1.78 CEM43) is obtainable with the permutation of the blocks, whereas the optimization of the time gaps between sequences has a smaller overall effect.
While some of the advantage of reordering sequences here can be attributed to the fact that different table positions result in different SAR distributions (which might also occur with a single table position in systems capable of parallel transmission), some advantages can also be observed in exams where only a single SAR distribution is applied. For example, in a case where the exam includes only the 4 sequences in the first table position (blue line in Figure 1), without any optimization the maximum temperature was 40.12°C and the thermal dose was 0.12 CEM43. When the sequences were optimized to minimize the temperature, after the optimization of the order the maximum temperature was 39.73°C. In case the sequences were optimized to minimize the thermal dose, after the optimization of the order the thermal dose was 0.11 CEM43. While these changes are quantitatively smaller than those for the full exam, this is in part attributed to the fact that those 4 sequences have relatively low SAR and much shorter overall duration.
Permutation of the groups based on minimizing the maximum SAR averaged over a 6-minute interval1 was not possible because some groups with high-SAR sequences were longer than 6 minutes. Optimization of the gaps between sequences did not provide significant SAR reduction.
There is a range of methods to model physiological response to temperature in use today.7,11,12 The model we chose for increase in perfusion with temperature7 is more conservative than some others because it allows for a lower maximum increase in local perfusion, but any of the models could be implemented with our overall method.
5 |. CONCLUSION
In this work, we have shown that it is possible to reduce the temperature and thermal dose throughout an MRI exam without increasing the duration of the exam, and without changing parameters such as flip angle, which may affect the quality of the image. In addition to methods only based on SAR reduction, it is possible to develop new alternative solutions to improve safety in MRI by considering additional parameters that affect temperature.
Funding information
NIH through grants P41 EB017183
REFERENCES
- 1.International Electrotechnical Commission. “International standard, medical equipment—part 2: particular requirements for the safety of magnetic resonance equipment for medical diagnosis”, 3rd revision Geneva, Switzerland: International Electrotechnical Commission; 2010. [Google Scholar]
- 2.Deniz CM, Carluccio G, Collins CM. Parallel transmission RF pulse design with strict temperature constraints. NMR Biomed. 2017;30:e3694. [DOI] [PMC free article] [PubMed] [Google Scholar]
- 3.Yarmolenko PS, Jung Moon E, Landon C, et al. Thresholds for thermal damage to normal tissues: an update. Int J Hypertherm. 2011;27:320–343. [DOI] [PMC free article] [PubMed] [Google Scholar]
- 4.Boulant N, Wu X, Adriany G, Schmitter S, Uğurbil K, Moortele PF. Direct control of the temperature rise in parallel transmission by means of temperature virtual observation points: simulations at 10.5 Tesla. Magn Reson Med. 2016;75:249–256. [DOI] [PMC free article] [PubMed] [Google Scholar]
- 5.Adair ER, Berglund LG. On the thermoregulatory consequences of NMR imaging. Magn Reson Imaging. 1986;4:321–333. [DOI] [PubMed] [Google Scholar]
- 6.Pennes HH. Analysis of tissue and arterial blood temperature in the resting human forearm. 1948. J Appl Physiol (1985). 1998;85:5–34. [DOI] [PubMed] [Google Scholar]
- 7.Wang Z, Collins CM. Consideration of physiological response in numerical models of temperature during MRI of the human head. J Magn Reson Imaging. 2008;28:1303–1308. [DOI] [PMC free article] [PubMed] [Google Scholar]
- 8.Carluccio G, Bruno M, Collins CM. Predicting long-term temperature increase for time-dependent SAR levels with a single short-term temperature response. Magn Reson Med. 2016;75:2195–2203. [DOI] [PMC free article] [PubMed] [Google Scholar]
- 9.Carluccio G, Erricolo D, Oh S, Collins CM. An approach to rapid calculation of temperature change in tissue using spatial filters to approximate effects of thermal conduction. IEEE Trans Biomed Eng. 2013;60:1735–1741. [DOI] [PMC free article] [PubMed] [Google Scholar]
- 10.Van Rhoon GC, Samaras T, Yarmolenko PS, Dewhirst MW, Neufeld E, Kuster N. CEM43° C thermal dose thresholds: a potential guide for magnetic resonance radiofrequency exposure levels? Eur Radiol. 2013;23:2215–2227. [DOI] [PMC free article] [PubMed] [Google Scholar]
- 11.Lang J, Erdmann B, Seebass M. Impact of nonlinear heat transfer on temperature control in regional hyperthermia. IEEE Trans Biomed Eng. 1999;46:1129–1138. [DOI] [PubMed] [Google Scholar]
- 12.Laakso I, Hirata A. Dominant factors affecting temperature rise in simulations of human thermoregulation during RF exposure. Phys Med Biol. 2011;56:7449–7471. [DOI] [PubMed] [Google Scholar]


