

Abstract
Objective
To investigate the psychometric properties of the Friedreich Ataxia Rating Scale neurologic examination (FARSn) and its subscores, as well as the influence of the modifications resulting in the now widely used modified FARS (mFARS) examination.
Methods
Based on cross-sectional FARS data from the FA–Clinical Outcome Measures cohort, we conducted correlation-based psychometric analyses to investigate the interplay of items and subscores within the FARSn/mFARS constructs.
Results
The results provide support for both the FARSn and the mFARS constructs, as well as individually for their upper limb and lower limb coordination components. The omission of the peripheral nervous system subscore (D) and 2 items of the bulbar subscore (A) in the mFARS strengthens the overall construct compared with the complete FARS.
Conclusions
A correlation-based psychometric analysis of the neurologic FARSn score justifies the overall validity of the scale. In addition, omission of items of limited functional significance as created in the mFARS improves the features of the measures. Such information is crucial to the ongoing application of the mFARS in natural history studies and clinical trials. Additional analyses of longitudinal changes will be necessary to fully ascertain its utility, especially in nonambulant patients.
Inherited ataxias vary in clinical presentation, yet most do share cerebellar pathology leading to loss of balance and limb coordination, cardinal features that need to be measured to evaluate the efficacy of an intervention. Friedreich ataxia (FRDA) exemplifies this challenge of a complex neuropathology, including degeneration of the spinal cord, peripheral sensory nerves, and the dentate nucleus of the cerebellum,1 which demands a broad but sensitive measure to capture the effect of neuroanatomical dysfunction on clinical progression of affected patients.
A first widely accepted such instrument was the International Cooperative Ataxia Rating Scale (ICARS),2 but its use in clinical studies in FRDA3–7 has diminished8,9 in favor of advanced developments. One, the Scale for the Assessment and Rating of Ataxia (SARA)10,11 focuses on a compact structure and quick administration. Concurrently, the Friedreich Ataxia Rating Scale (FARS) combines timed measures of performance, functional disability staging (FDS), and a patient-reported outcome (activities of daily living [ADL]) with a paramount neurologic examination, the FARS neurologic examination (FARSn). Both SARA and FARS are now generally accepted and used in 2 large natural history studies in Europe12–15 and the United States.16,17
The relationships of the FARSn with other rating scales,11 patient-reported outcomes,18–20 disease duration and FDS,21 age at onset, and repeat length16,18,21–24 are well established. We summarize the revisions of the FARSn examination after its introduction18 and, based on classical test theory25 (CTT), provide a psychometric analysis of the construct at its subscores, the lack of which has been acknowledged.11,26,27
Methods
Standard protocol approvals, registrations, and patient consents
Informed consent was obtained from all participants before starting evaluations. The study was approved by the institutional review board at all participating sites.
Study design and participants
We used data from all participants recruited via the Collaborative Clinical Research Network in Friedreich Ataxia28 into the Friedreich Ataxia–Clinical Outcome Measures Study (FA-COMS).17 Results from this ongoing and actively recruiting registry study have been published widely.16,22,24 Briefly, the FA-COMS has minimal inclusion/exclusion criteria (age 4–80 years and clinical and genetic confirmation of FRDA), and the follow-up time now (as of 2019) is up to 15 years. Participant characteristics cover the full spectrum of FRDA with regard to age at disease onset, disease duration, and disease severity. There are 12 participating sites (number of participants): Children's Hospital of Philadelphia (417), University of California Los Angeles (191), Murdoch Children's Research Institute (179, Melbourne, Australia), Emory University (73), University of South Florida (36), University of Iowa (26), University of Florida (20), University of Chicago (20), Sick Kids Hospital (19, Toronto, Canada), University of Minnesota (17), Ohio State University (10), and University of Rochester (4).
Friedreich Ataxia Rating Scale
With the exception of the FARSn, the components of the FARS examination, ADL, timed measures, and FDS were not changed since its original publication.18 E.g., FARS disability staging (FDS) is derived from an ordinal score from 1 to 6 (no, minimal, mild, moderate, severe, and total disability), independent from FARS ratings. It is graded in units of 0.5 linked by descriptors to ambulation status and overall function (5 being permanent wheelchair user).18
The revision of the FARSn examination was initially driven by item reduction based on interrater reproducibility, and insertion of 2 items related to stance without visual aid.21 The resulting version (total of 125 points, figure 1) consists of 5 subscales directed to bulbar function (FARS A, maximum of 11 points), upper limb coordination (FARS B, 36), lower limb coordination (FARS C, 16), peripheral nervous system (FARS D, 26), and upright stability (FARS E, 36). This version is used in the FA-COMS17 since 2003 and has been used as an end point in clinical studies.29–31
Figure 1. Measurement model of the neurologic examination of the FARSn and the modified FARS (mFARS).

Maximum score/subscale/item scores are shown in brackets. Items in subscales B, C, and D are conducted separately on lateral sides; ** items A1 and A2 are excluded in the mFARS examination. FARS = Friedreich Ataxia Rating Scale; mFARS = modified FARS.
More recently, the need to focus solely on functional abilities led to a reduction in items, specifically in the peripheral nervous system and bulbar components.16 This resulted in the new, modified FARS (mFARS) score (mFARS, 93), which is used in currently ongoing and recently finished clinical trials.30–33 It is important that all items of the mFARS are included in the full FARSn examination; only the bulbar subscore (mA) was modified (now excluding items A1, facial atrophy and A2, and tongue atrophy), and the peripheral nervous system (D) subscore is now omitted. The remaining subscales, upper limb coordination (B), lower limb coordination (C), and upright stability (E), are identical in both the mFARS and the FARSn (see figure 1 for description and scoring for overall scales and individual subscales).
Scope and statistical analysis
The goal of this work was to evaluate the function of the measure in terms of CTT, i.e., identify valid subscores and components, in advance of a longitudinal evaluation. Therefore, we used exclusively cross-sectional (baseline) data, which ensure the most diverse coverage of all disease phases. To investigate the FARSn measurement model and establish that items measure the same (or a similar) underlying constructs,34 corrected item-total correlations (the correlation of an item with its own subscale, when excluding that item) were calculated, as well as subscale intercorrelations. In addition, we investigated the range of observed subscale and total scores, skewness of their distributions, and floor and ceiling effects. To identify clusters of intercorrelating items and examine underlying concepts measured by specific items, as well as to obtain information on their clinical interpretation,34 we performed exploratory principal component analysis (PCA) using varimax rotation. If applicable, Cronbach α was calculated for sub- and total scales as a measure of internal consistency and stability against random error.
All statistical calculations were performed in R35 using the tidyverse environment36 and the psych package37 for psychometric analyses.
Data availability
Primary data for the present study (and all other previous studies of this cohort) are available at The Critical Path Institute as part of the Friedreich Ataxia Integrated Clinical Database (cpath.org/programs/dcc/projects/friedreichs-ataxia). Case report forms and protocols are available through FARA (curefa.org). It is expected that such data will remain available indefinitely.
Results
Baseline demographic results of the FA-COMS cohort
At the time of data cut for this study (April 2019), 1,011 participants enrolled into the FA-COMS had at least 1 visit with a complete FARSn examination (no missing data), FDS, and age at disease onset available. The majority of these individuals were in the early-onset group,12,38 i.e., first symptoms of FRDA occurred before age 15 years (N = 695, 68.7%), representing the genetically most severely affected individuals as evident by the greater GAA1 (mean 718.01; SD 209.29) and GAA2 (mean 941.51, SD 186.53) repeat sizes in this group (table 1). At their first presentation, within this group, 319 individuals (45.9%) were still in an early disease phase as evident by FDS 1–2. Stages 3–4 in the early-onset group were represented by 145 (20.9%) participants, a subgroup that is in particular high risk of losing ambulation within the next 2–4 years39 and are currently a group of high interest regarding focused clinical trials.39 Of the remaining participants, 209 (20.7%) had intermediate onset (15–24 years), and 107 (10.6%) had late onset (≥25 years). In the 2 later-onset groups, fewer patients were in an early disease phase (stage 1–2, 38.3% and 29.9%), but there also were fewer patients in later, nonambulatory stages (stage 5–6, 24.9% and 22.4%, respectively). Overall, 1 third of participants (33.2% in the early-onset group, 30.4% of all participants) were already nonambulatory at their first visit. In line with previous reports, about 5.4% of the patients were carrying a point mutation. Because these patients show increased risk of atypical disease progression,40,41 they are typically excluded from clinical studies. However, the potential effect on the results was deemed minimal, and we included these patients in all analyses.
Table 1.
Demographic characteristics of the cohort; percentages are based on the disease onset group

Psychometric properties of the FARS
Scaling characteristics of both full scores and all respective subscales are summarized in table 2, and the full corrected item-subscale correlations for FARSn subscores in table 3 (a full correlation table for mFARS is provided as table e- 1, links.lww.com/NXG/A189). Mean corrected item-total correlations for subscales mA, B, C, D, and E, which are forming the mFARS, were 0.58 or above, whereas the A and the D subscale from FARSn showed mean values of 0.40 and 0.42, already indicating that the step from FARSn to the mFARS leads to more stable constructs. An additional benefit from the exclusion of A1 and A2 is the reduction of ceiling effects in the modified bulbar subscore (mA), leading to a less skewed distribution.
Table 2.
Scaling characteristics of sub- and total scores in the FARS neurologic examination, plus total FARSn and the mFARSa

Table 3.
Item-subscale correlations of the full FARSna

Cronbach α values were satisfactory for the upper limb (A, 0.87) and lower limb (B, 0.91), as well as for the upright stability scale (E, 0.87). The modified bulbar subscale (mA) in the mFARS showed an α of 0.65, which is improved from the initial 4-item bulbar subscale (A) in FARSn, but still has to be considered a low value, clearly missing the suggested criterion of 0.9.42,43 For the initial FARSn subscores A and D, Cronbach α (0.53 and 0.56, respectively) shows that the modifications resulted in improved probabilities in mFARS. For the complete examinations, both the FARSn and the mFARS showed a Cronbach α of 0.92. Constructs covered by subscales of a total score should be related (intercorrelated), but also different to cover different aspects of a disease. A range of 0.30–0.70 has been suggested,9 and this condition was met for all subscores in both overall scales.
All subscales, as well as the complete scores, correlated with disease duration and FDS and, to a lesser extent, with age. Detailed item-own subscale and item-other subscale correlations (table 3) further corroborate construct validities of the subscores and full scales. All items in the mFARS subscales correlated with coefficients of >0.3 with their subscores, indicating that these items measure a common construct and collect a similar amount of information.9,34 In addition, only 1 item (E1, sitting posture) of the FARSn/mFARS examinations did not correlate higher with its own subscale than with other subscales. This item correlated to a similar extent with all 3 subscales (table 3) in mFARS, and also with the peripheral nervous system subscale D in FARSn. As a criterion for a margin between correlations between its own subscale and others, 2 SDs have been suggested,9,34 which was fulfilled by all items but E1 (sitting posture) and E2B (stance, feet apart, with eyes closed), which also correlated well with subscale C (lower limb coordination). For the peripheral nervous system subscore in FARSn, except for D2 (muscle weakness), none of the items in the peripheral nervous system subscale correlated well with any other subscale (table 3). Remarkably, weaker item-subscale correlations were also found for items E3B (stance feet together, eyes closed), E4 (tandem stance), and E5 (stance on dominant foot) (see below).
Floor and ceiling effects
Ceiling effects were apparent in subscale C (heel-shin tap and heel-shin slide, possible range 0–8), with 21% of observations showing the maximum score. Notably, even after loss of ambulation, patients can perform the heel-shin tests (subscale C). For subscale E (upright stability), we found that item E1 (sitting position, possible range 0–4) is scored at 4 (indicating greatest impairment) in less than 5% of the observations, which masks total score/ceiling effects for subscale E. We also reported a ceiling effect at 90% of the maximum on this item (table 2). Specifically, for the E (upright stability) subscale, the ceiling effect corresponded well to the number of nonambulatory patients in our sample (32%, FDS > 4, table 1).
Floor effects were only visible in the bulbar subscale mA and (and bulbar/A in FARSn). The removal of A1 (facial atrophy) and A2 (tongue atrophy) reduced the ceiling effects to some extent, still 43% of patients had scored 10% or less of the total in the modified (mA) bulbar subscale. We also analyzed the ceiling effects on an item-based level. All individual item scores in mFARS (grouped by subscales) are presented in figure 2 as heat maps from lowest score (light blue) to maximum score (dark blue).
Figure 2. Heat map of individual items within the modified FARS.
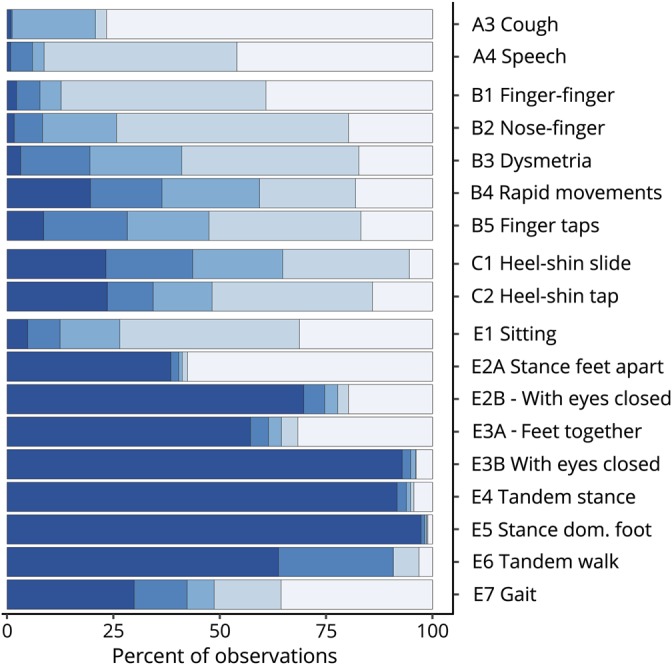
Data are grouped by subscales. Five blue hues (from light to dark) correspond to increasing item scores in steps of 20%. FARS = Friedreich Ataxia Rating Scale.
In general, the heat maps for items in subscales A, B, and C reflect nicely the broad and balanced stages of function loss in this population. Floor effects discussed above are visible in items A3 (cough) and A4 (speech) and relevant but still workable ceiling effects in the lower limb coordination subscale C. In the 9-item subscale E (upright stability), however, although favorable validity and consistency/reliability properties are achieved (α = 0.87, table 2), only items E1 (sitting) and E7 (gait) and to some extent E6 (tandem walk) show balanced distributions. Specifically, all 6 stance-related items E2 to E5 reveal distinct bimodal distributions, which means that a patient can either perform the test well (score 0) or will be unable to complete the item rating a maximum score of 4. This is most evident in items E2A (stance, feet apart, eyes open), E2B (stance, feet apart, eyes closed), and E3A (stance, feet together, eyes open). For the remaining items, E3B (stance feet together, eyes closed), E4 (tandem stance), and E5 (stance dominant foot), it is also true, but only very few patients do not score the maximum.
A grouped analysis shows that only 15.8% of all patients (n = 160) do not score the maximum result in all E3B (stance, feet apart, eyes closed)/E4 (tandem stance)/E5 (stance on dominant foot) items, or, the other way around, 98.5% of patients (n = 996) had the maximum possible score in at least 1 of these 3 items. In the ambulatory sub-population (FDS < 5, N = 704, 69.6%), these proportions were 22.5% (n = 159) and 97.9% (n = 689).
Factor analysis
For principal component (PCA) and factor analysis, several solutions for FARSn and mFARS were evaluated. Using the Kaiser criterion44 (retaining factors with an eigenvalue >1), PCA found 5 factors for the complete FARSn. A more detailed examination of the factor loading structure did not result in overall meaningful groupings. Especially, the items of the peripheral nervous system (D) subscore loaded into components together with items of other subscores (data not shown).
For mFARS, 3 principal components with eigenvalues >1 were found, and 1 additional with an eigenvalue of 0.83. Factor analysis using 4 factors resulted in a separation of independent, clinically meaningful factors. Items in FARS E (upright stability) and C (lower limb coordination) loaded strongest in component 1, upper limb coordination items (FARS B) loaded into component 2, and component 3 included solely the 2 bulbar function items of FARS A. The 3 remaining items of the FARS E (upright stability), with high amounts of “unable” (E3B, E4 and E5) loaded into the 4th component. Cumulatively, these 4 factors explained 70% of the variance in the overall construct.
Discussion
For our psychometric analysis of the FARSn examination, we used the FA-COMS cohort, comprehensively representing the 2 most important dimensions of FRDA, being individuals from the complete severity spectrum of FRDA (as measured by age at symptom onset or GAA1/GAA2 repeat length), and at the same time including all disease durations. Moreover, the predominance of early vs late onset and children vs adults in recruitment is most likely representative of the incidence, but not necessarily prevalence of FRDA. Affected individuals progress fastest in the early phases of the disease20; we used baseline data only to achieve optimal coverage of disease phases. This population profile should be ideal for the analyses of inherently sample-dependent psychometric properties of any scale. Still, overall correlation parameters will revolve around the proportion of early-/late-stage patients and the ratio of ambulant/nonambulant patients.
In the present study, classical psychometric correlation analysis (item-own vs item-other subscale correlations) confirms the validity and structure of the FARSn examination, but specifically endorses the modifications leading to the mFARS. Overall, both scales showed appropriate item-subscale groupings, inter-subscale correlations, and internal consistency (Cronbach α >0.90). However, 2 sets of items within the complete 125-point FARSn scale show clear weaknesses.
First, items in the peripheral nervous system (D) subscore itself have inefficient within subscale correlations and form a weak construct. This may reflect the arbitrary grouping of items within FARS D (peripheral nervous system). In particular, muscle strength and atrophy, items which have a slower decline (and thus lower scoring) and may be secondary to both peripheral and CNS pathology, are grouped with deep tendon reflexes, which, being a hallmark feature of FRDA, are usually absent or diminished on first presentation therefore receiving a maximum score. Second, the A1 (facial atrophy)/A2 (tongue atrophy) items correlate weakly with other items in the bulbar (FARS A) subscore and other parts of the FARS examination. The remaining items in the bulbar subscore (related to cough and speech) have residual floor effects, yet they show considerable intercorrelation justifying their inclusion in the mFARS. Also, the Cronbach α value is improved for the modified bulbar (FARS mA) subscale.
These results justify the exclusion of these 2 groups of items (FARS D and A1/A2) in the newly formed modified mFARS score. Of interest, the requirement to focus on more patient-driven tasks initiated this change without knowledge of the psychometric properties of the items that quantify the functional ability of the individual with FRDA. As a result, intrasubscale correlations and reliability (Cronbach α) of the mFARS score are improved, whereas floor effects in FARS A1 (facial atrophy) and A2 (tongue atrophy) are avoided, demonstrating that the items reflecting functional ability match the most psychometrically robust in the mFARS. In addition, this shows that progression captured by the FARS examination(s) does not match the decline of dysfunctional sensory pathways in FRDA and that sensory loss is less relevant for the patient.
In addition, the present analysis demonstrates the detailed features of the FARS E (upright stability) subscale, which drives quantification of progression in the early phase of the disease. Its 6 stance-related items (E2A, B; E3A, B; E4, E5), are scored almost exclusively with extreme values (0 or the maximum, 4). This might indicate that in context of an otherwise slowly progressing condition, these abilities are lost rapidly. Alternatively, the extreme values could be a function of the item constructs. The easier, initial 3 stance items (E2A, E3A, and E2B) show preferable interitem correlations and should function well within the item response theory (IRT). On the other hand, the increasing difficulty of the remaining stance items results in very few patients in this cohort to perform E3B, E4, and E5. In most situations, these items thus contribute little to the total scores besides addition of noise. However, they also may provide useful information to the overall mFARS score in clinical studies that target those individuals with FRDA who are very early in the disease process. These results also indicate that all 6 stance items could be useful in classifying patients according to function and in longitudinal analysis of those individuals with the mildest of FRDA symptoms. The remaining 3 items in subscore E show beneficial psychometric properties; noteworthy, E7 (gait) correlates with all items in mFARS (and FARSn) and has the best overall correlation with the total mFARS score and in itself directly defines individual ambulatory ability. Another crucial item for functional ability, the sitting posture item (E1), showed the weakest inter-subscale correlation in FARS E (when disregarding E3B, E4, and E5), perhaps as scoring on this item can be improved by scoliosis surgery or physiotherapy. Overall, although ceiling effects in FARS E (upright stability) match the nonambulatory fraction of the cohort, it contributes well to the overall FARSn/mFARS score in the ambulatory portion of the cohort.
Subscales FARS B (upper limb coordination) and C (lower limb coordination) showed beneficial psychometric properties for inclusion in the overall FARSn/mFARS. Of note, the finger-finger test item (B1) showed comparatively low item-subscale correlation, similar to that found in the ICARS analysis.9 Still, the remainder of these subscales provide useful contributions to the scale.
The use of IRT34,45 to evaluate rating scales in FRDA has been proposed.26,46 However, although Rasch-based models have been extended to polytomous45 and continuous47,48 rating scales, they are not easily applied to scales with complex subscale/item structures like FARS and ICARS. Similarly, the assumption of unidimensionality in IRT-based models impedes their implementation.49,50
Factor analysis for FARSn confirmed previous such findings for the FARSn examination, including the equivocal overlap between factor loadings and subscores.11 For the mFARS, a 4-factor solution was the most clinically and statistically appropriate and PCA provided strong support of the subscore structure. This analysis additionally backs the exclusion of the FARS D and the 2 bulbar items and indicates that a lower limb component (FARS C plus E) and the upper limb portion (FARS B) within the mFARS have value as individual scales for separate evaluation.
In this context, the conceptual differences between a multi-subscore scale like the mFARS and a more compact scale (SARA) become obvious. The latter has been designed especially for rapid application and a strong central construct, leading to its unidimensionality.10,11 These features should improve interrater variability, highly important, e.g., in large multicenter studies. However, SARA might be limited in more complex studies. In contrast, the mFARS provides a more detailed evaluation of overall patient status and a more complex yet valid construct. In addition, subcomponents of the mFARS might separately support the evaluation of individual domains, e.g., upper and lower limb function, in specific circumstances. This might prove valuable when investigating temporal differences in loss of function in separate domains or when focusing on later stage, exclusively nonambulatory patients. Although the complete FARS may require more time to complete, much of the extra information is collected in other instruments in typical clinical trials. Thus, overall, the different measures are relatively similar in practical administration, allowing investigators to select the best measure for the clinical approach being tested.
As future clinical trials in FRDA may focus on either subgroup, potentially targeted with specific therapeutic interventions, or more diverse cohorts with broader therapeutic interventions, the present analysis demonstrates that the mFARS examination captures the complex features of FRDA, even in early stages of the disease.
Disclosure
Disclosures available: Neurology.org/NG.
Acknowledgment
The authors thank the coordinators of the Friedreich Ataxia Clinical Outcome Measures Study (FACOMS) for collection of patient visit data.
Glossary
- ADL
activities of daily living
- CTT
classical test theory
- FA-COMS
Friedreich Ataxia–Clinical Outcome Measures Study
- FARS
Friedreich Ataxia Rating Scale
- FARSn
FARS neurologic examination
- FDS
functional disability staging
- FRDA
Friedreich ataxia
- ICARS
International Cooperative Ataxia Rating Scale
- IRT
Item Response Theory
- mFARS
modified FARS
- PCA
principal component analysis
- SARA
Scale for the Assessment and Rating of Ataxia
Appendix. Authors
Study funding
This work was funded by the Friedreich's Ataxia Research alliance (FARA).
References
- 1.Koeppen AH, Mazurkiewicz JE. Friedreich ataxia: neuropathology revised. J Neuropathol Exp Neurol 2013;72:78–90. [DOI] [PMC free article] [PubMed] [Google Scholar]
- 2.Trouillas P, Takayanagi T, Hallett M, et al. International cooperative ataxia rating scale for pharmacological assessment of the cerebellar syndrome. The ataxia neuropharmacology committee of the world federation of neurology. J Neurol Sci 1997;145:205–211. [DOI] [PubMed] [Google Scholar]
- 3.Di Prospero NA, Baker A, Jeffries N, Fischbeck KH. Neurological effects of high-dose idebenone in patients with Friedreich's ataxia: a randomised, placebo-controlled trial. Lancet Neurol 2007;6:878–886. [DOI] [PubMed] [Google Scholar]
- 4.Lynch DR, Perlman SL, Meier T. A phase 3, double-blind, placebo-controlled trial of idebenone in Friedreich ataxia. Arch Neurol 2010;67:941–947. [DOI] [PubMed] [Google Scholar]
- 5.Meier T, Perlman SL, Rummey C, Coppard NJ, Lynch DR. Assessment of neurological efficacy of idebenone in pediatric patients with Friedreich's ataxia: data from a 6-month controlled study followed by a 12-month open-label extension study. J Neurol 2012;259:284–291. [DOI] [PubMed] [Google Scholar]
- 6.A study of efficacy, safety and tolerability of idebenone in the treatment of Friedreich's ataxia (FRDA) patients (MICONOS). Available at: clinicaltrials.gov/ct2/show/NCT00905268. Accessed January 4, 2019.
- 7.Long-term safety and tolerability of idebenone in Friedreich's ataxia patients (MICONOS extension). Available at: clinicaltrials.gov/ct2/show/NCT00993967. Accessed Janaury 4, 2019.
- 8.Saute JAM, Donis KC, Serrano-Munuera C, et al. Ataxia rating scales—psychometric profiles, natural history and their application in clinical trials. Cerebellum 2012;11:488–504. [DOI] [PubMed] [Google Scholar]
- 9.Cano SJ, Hobart JC, Hart PE, Korlipara LVP, Schapira AHV, Cooper JM. International Cooperative Ataxia Rating Scale (ICARS): appropriate for studies of Friedreich's ataxia? Mov Disord 2005;20:1585–1591. [DOI] [PubMed] [Google Scholar]
- 10.Schmitz-Hübsch T, du Montcel ST, Baliko L, et al. Scale for the assessment and rating of ataxia: development of a new clinical scale. Neurology 2006;66:1717–1720. [DOI] [PubMed] [Google Scholar]
- 11.Bürk K, Mälzig U, Wolf S, et al. Comparison of three clinical rating scales in Friedreich ataxia (FRDA). Mov Disord 2009;24:1779–1784. [DOI] [PubMed] [Google Scholar]
- 12.Reetz K, Dogan I, Costa AS, et al. Biological and clinical characteristics of the European Friedreich's Ataxia Consortium for Translational Studies (EFACTS) cohort: a cross-sectional analysis of baseline data. Lancet Neurol 2015;14:174–182. [DOI] [PubMed] [Google Scholar]
- 13.Reetz K, Dogan I, Hilgers RD, et al. Progression characteristics of the European Friedreich's Ataxia Consortium for Translational Studies (EFACTS): a 2 year cohort study. Lancet Neurol 2016;15:1346–1354. [DOI] [PubMed] [Google Scholar]
- 14.Reetz K, Dogan I, Hohenfeld C, et al. Nonataxia symptoms in Friedreich ataxia: report from the registry of the European Friedreich's Ataxia Consortium for Translational Studies (EFACTS). Neurology 2018;91:e917–e930. [DOI] [PubMed] [Google Scholar]
- 15.Patient registry of the European Friedreich's Ataxia Consortium for Translational Studies (EFACTS). Available at: clinicaltrials.gov/ct2/show/NCT02069509. Accessed April 29, 2019.
- 16.Patel M, Isaacs CJ, Seyer L, et al. Progression of Friedreich ataxia: quantitative characterization over 5 years. Ann Clin Transl Neurol 2016;3:684–694. [DOI] [PMC free article] [PubMed] [Google Scholar]
- 17.FA Clinical Outcome Measures (FA-COMS). Available at: clinicaltrials.gov/ct2/show/NCT03090789. Accessed April 29, 2019.
- 18.Subramony SH, May W, Lynch D, et al. Measuring Friedreich ataxia: interrater reliability of a neurologic rating scale. Neurology 2005;64:1261–1262. [DOI] [PubMed] [Google Scholar]
- 19.Fahey MC, Corben L, Collins V, Churchyard AJ, Delatycki MB. How is disease progress in Friedreich's ataxia best measured? A study of four rating scales. J Neurol Neurosurg Psychiatry 2006;78:411–413. [DOI] [PMC free article] [PubMed] [Google Scholar]
- 20.Tai G, Corben LA, Gurrin L, et al. A study of up to 12 years of follow-up of Friedreich ataxia utilising four measurement tools. J Neurol Neurosurg Psychiatry 2015;86:660–666. [DOI] [PubMed] [Google Scholar]
- 21.Lynch DR, Farmer JM, Tsou AY, et al. Measuring Friedreich ataxia: complementary features of examination and performance measures. Neurology 2006;66:1711–1716. [DOI] [PubMed] [Google Scholar]
- 22.Friedman LS, Farmer JM, Perlman S, et al. Measuring the rate of progression in Friedreich ataxia: implications for clinical trial design. Mov Disord 2010;25:426–432. [DOI] [PMC free article] [PubMed] [Google Scholar]
- 23.Milne SC, Murphy A, Georgiou-Karistianis N, Yiu EM, Delatycki MB, Corben LA. Psychometric properties of outcome measures evaluating decline in gait in cerebellar ataxia: a systematic review. Gait Posture 2018;61:149–162. [DOI] [PubMed] [Google Scholar]
- 24.Regner SR, Lagedrost SJ, Plappert T, et al. Analysis of echocardiograms in a large heterogeneous cohort of patients with Friedreich ataxia. Am J Cardiol 2012;109:401–405. [DOI] [PubMed] [Google Scholar]
- 25.Spector P. Summated Rating Scale Construction. Newbury Park: SAGE Publications, Inc; 1992. [Google Scholar]
- 26.Delatycki MB. Evaluating the progression of Friedreich ataxia and its treatment. J Neurol 2009;256:36–41. [DOI] [PubMed] [Google Scholar]
- 27.Marelli C, Figoni J, Charles P, et al. Annual change in Friedreich's ataxia evaluated by the Scale for the Assessment and Rating of Ataxia (SARA) is independent of disease severity. Mov Disord 2012;27:135–139. [DOI] [PubMed] [Google Scholar]
- 28.FARA—Collaborative Clinical Research Network in Friedreich's Ataxia [online]. Available at: curefa.org/. Accessed April 29, 2019.
- 29.Marcotulli C, Fortuni S, Arcuri G, et al. GIFT-1, a phase IIa clinical trial to test the safety and efficacy of IFNγ administration in FRDA patients. Neurol Sci 2016;37:361–364. [DOI] [PubMed] [Google Scholar]
- 30.Zesiewicz T, Heerinckx F, De Jager R, et al. Randomized, clinical trial of RT001: early signals of efficacy in Friedreich's ataxia: signals of Efficacy in Friedreich's Ataxia. Mov Disord 2018;33:1000–1005. [DOI] [PubMed] [Google Scholar]
- 31.Zesiewicz T, Salemi JL, Perlman S, et al. Double-blind, randomized and controlled trial of EPI-743 in Friedreich's ataxia. Neurodegener Dis Manag 2018;8:233–242. [DOI] [PubMed] [Google Scholar]
- 32.Lynch DR, Farmer J, Hauser L, et al. Safety, pharmacodynamics, and potential benefit of omaveloxolone in Friedreich ataxia. Ann Clin Transl Neurol 2018;6:15–26. [DOI] [PMC free article] [PubMed] [Google Scholar]
- 33.Lynch DR, Hauser L, McCormick A, et al. Randomized, double-blind, placebo-controlled study of interferon-γ 1b in Friedreich ataxia. Ann Clin Transl Neurol 2019;6:546–553.. [DOI] [PMC free article] [PubMed] [Google Scholar]
- 34.Hobart J, Cano S. Improving the evaluation of therapeutic interventions in multiple sclerosis: the role of new psychometric methods. Health Technol Assess 2009;13:1–177. [DOI] [PubMed] [Google Scholar]
- 35.R Core Team. R: A Language and Environment for Statistical Computing [online]. Vienna: R Foundation for Statistical Computing; 2018. Available at: R-project.org/. Accessed April 29, 2019. [Google Scholar]
- 36.Wickham H. Tidyverse: easily install and load the “tidyverse” [online]. 2017. Available at: CRAN.R-project.org/package=tidyverse. Accessed April 29, 2019.
- 37.Revelle W. Psych: Procedures for Psychological, Psychometric, and Personality Research [online]. Evanston: Northwestern University; 2018. Available at: //CRAN.R-project.org/package=psych. [Google Scholar]
- 38.Metz G, Coppard N, Cooper JM, et al. Rating disease progression of Friedreich's ataxia by the International Cooperative Ataxia Rating Scale: analysis of a 603-patient database. Brain 2013;136:259–268. [DOI] [PMC free article] [PubMed] [Google Scholar]
- 39.Rummey C. Loss of Ambulation in the CCRN-FA Natural History Study. Italy: Pisa; 2017. [Google Scholar]
- 40.Lynch DR, Deutsch EC, Wilson RB, Tennekoon G. Unanswered questions in Friedreich ataxia. J Child Neurol 2012;27:1223–1229. [DOI] [PMC free article] [PubMed] [Google Scholar]
- 41.Galea CA, Huq A, Lockhart PJ, et al. Compound heterozygous FXN mutations and clinical outcome in Friedreich ataxia: insights from Frataxin structure and function. Ann Neurol 2016;79:485–495. [DOI] [PubMed] [Google Scholar]
- 42.Lance CE, Butts MM, Michels LC. The sources of four commonly reported cutoff criteria: what did they really say? Organ Res Methods 2006;9:202–220. [Google Scholar]
- 43.Nunnally JC. Psychometric Theory (2nd ed.). New York, NY: McGraw-Hill; 1978. [Google Scholar]
- 44.Kaiser HF. The application of Electronic computers to factor Analysis. Educ Psychol Meas 1960;20:141–151. [Google Scholar]
- 45.Rasch G. On General Laws and the Meaning of Measurement in Psychology. Copenhagen, Denmark: Danmarks pædagogiske Institut; 1961. [Google Scholar]
- 46.Lynch DR, Farmer JM, Wilson RL, Balcer LJ. Performance measures in Friedreich ataxia: potential utility as clinical outcome tools. Mov Disord 2005;20:777–782. [DOI] [PubMed] [Google Scholar]
- 47.Andrich D. A rating formulation for ordered response categories. Psychometrika 1978;43:561–573. [Google Scholar]
- 48.Müller H. A Rasch model for continuous ratings. Psychometrika 1987;52:165–181. [Google Scholar]
- 49.Mair P, Hatzinger R. Extended Rasch modeling: The eRm package for the application of IRT models in R. J Stat Softw [online serial] 2007;20 Accessed at: jstatsoft.org/v20/i09/. Accessed August 2, 2019. [Google Scholar]
- 50.Hohensinn C. pcIRT: an R package for polytomous and continuous Rasch models. J Stat Softw [online serial] 2018;84 Accessed at: jstatsoft.org/v84/c02/. Accessed August 2, 2018. [Google Scholar]
Associated Data
This section collects any data citations, data availability statements, or supplementary materials included in this article.
Data Availability Statement
Primary data for the present study (and all other previous studies of this cohort) are available at The Critical Path Institute as part of the Friedreich Ataxia Integrated Clinical Database (cpath.org/programs/dcc/projects/friedreichs-ataxia). Case report forms and protocols are available through FARA (curefa.org). It is expected that such data will remain available indefinitely.