. 2019 Dec 23;8:e49818. doi: 10.7554/eLife.49818

Figure 3. VEGF stimulation promotes the growth of axon branches in hippocampal neurons.

(A) Representative images of 3 DIV hippocampal neurons stimulated with or without 100 ng/ml VEGF for 48 hr and stained with beta-III-tubulin. Scale bars 50 µm. (B,C) Quantification of axonal branch number (B) and branch length (C). Data are represented as % of non-stimulated control. Mean ± SEM,>60 neurons from n = 4. ****p<0.0001; unpaired Student’s ttest. (D,E) 1 DIV hippocampal neurons were stimulated with 50 ng/ml VEGF or vehicle control and time-lapse movies were recorded over the course of 4 hr. The number of extending axon branches (D) was quantified over the course of the movies and the net growth rate of axon branch was calculated (E). Data represents mean ± SEM from 39 neurons, n = 3 independent experiments. ***p<0.001; ****p<0.0001; unpaired Student’s ttest. (F) Hippocampal neurons were transfected with mCherry-UtrCH and imaged in TIRF-mode at 3 DIV. Using this approach, actin patches, membrane bending protrusions and filopodia could be identified and differentiated. Time-lapse movies were recorded over the course of 2 min (actin patches) or 10 min (protrusions and filopodia) to study the dynamic formation of such events. Scale bar 2 µm. (G) The number of newly forming actin patches during 2 min per 10 µm axon segment were counted before and after VEGF stimulation (100 ng/ml). Data represents mean ± SEM from at least 11 neurons of 2 independent experiments. n.s. not significant; paired Student’s ttest. (H,I) The number and the size of newly forming protrusions and filopodia were analyzed during the course of 10 min before and after VEGF stimulation (100 ng/ml). Data represents mean ± SEM from at least 12 neurons of at least three independent experiments. n.s. not significant; paired Student’s ttest.

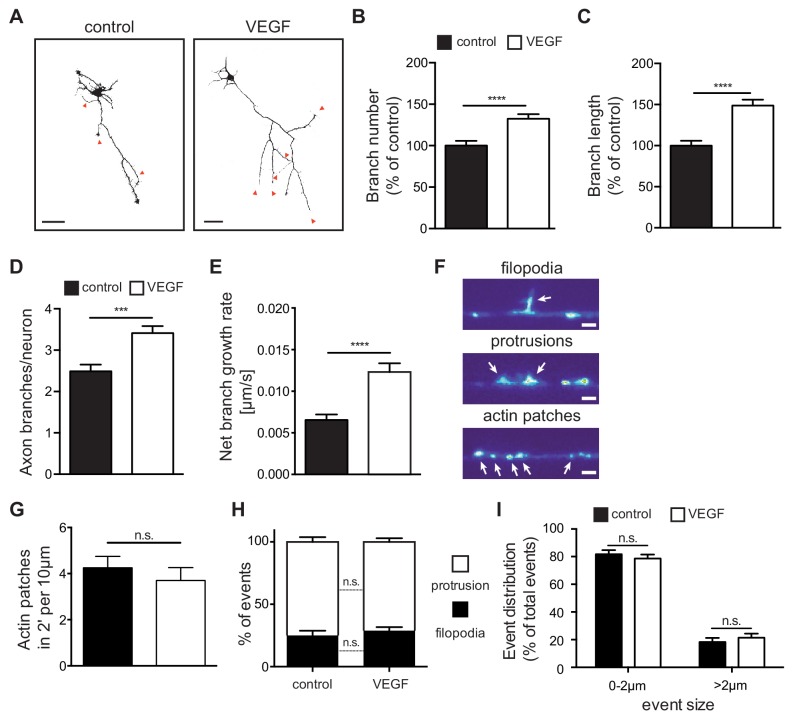
Figure 3—source data 1. Raw data and statistical analysis of graphs of Figure 3.

Figure 3.

Figure 3—figure supplement 1. VEGF stimulation does not affect neurite growth and axon branch retraction.

Figure 3—figure supplement 1.

(A–C) 1 DIV hippocampal neurons were stimulated with or without 100 ng/ml VEGF for 48 hr. Neuron cultures were stained with beta-III-tubulin at 3 DIV and axons were analyzed. Quantification showing the number of primary neurites (A), the average length of primary neurites (B) as well as the length of the axon. Data are represented as % of non-stimulated control. Mean ± SEM,>60 neurons from n = 4. n.s. not significant; unpaired Student’s ttest. (D,E) 1 DIV hippocampal neurons were stimulated with 50 ng/ml VEGF or vehicle control and time-lapse movies recorded over the course of 4 hr. The number of retracting axon branches was quantified over the course of the movies (D) and the retraction rate of axon branch was also calculated (E). Data represents mean ± SEM from 39 neurons, n = 3 independent experiments. n.s. not significant; unpaired Student’s ttest.
Figure 3—figure supplement 1—source data 1. Raw data and statistical analysis of graphs of Figure 3—figure supplement 1.
Figure 3—video 1. Hippocampal axon branching - unstimulated.
Download video file (1MB, mp4)
Related to Figure 3. Live cell time-lapse movies were recorded from 1 DIV hippocampal neurons over the course of 4 hr to study axon branch dynamics. Images were recorded every 4 min. Blue arrows indicate extending and retracting axonal branches.
Figure 3—video 2. Hippocampal axon branching – VEGF stimulated.
Download video file (1MB, mp4)
Related to Figure 3. Live cell time-lapse movies were recorded from 1 DIV hippocampal neurons over the course of 4 hr to study axon branch dynamics. Cells were stimulated with 50 ng/ml VEGF. Images were recorded every 4 min. Blue arrows indicate extending and retracting axonal branches.
Figure 3—video 3. Actin-dynamics in axons of hippocampal neurons.
Download video file (1.1MB, mp4)
Related to Figure 3. Hippocampal neurons were transfected with mCherry-UtrCH plasmid at 1 DIV and TIRF time-lapse movies of actin dynamics were recorded at 3 DIV. Images were acquired every 5 s. Actin patches as well as membrane actin protrusions are indicated.
Figure 3—video 4. Actin patch-to-filopodia transition in axons of hippocampal neurons.
Download video file (893.7KB, mp4)
Related to Figure 3. Hippocampal neurons were transfected with mCherry-UtrCH plasmid at 1 DIV and TIRF time-lapse movies of actin dynamics were recorded at 3 DIV. Images were acquired every 5 s. Red arrow indicates the formation of actin protrusions and its transition to filopodia.