. 2019 Dec 9;8:e50850. doi: 10.7554/eLife.50850

Figure 6. Phosphorylation of NDEL1 S336/S332 modulates F-actin dynamics.

(A) F-actin fractionation assay of NDEL1 and TARA. NDEL1 S336/S332 phosphorylation induced by TARA was observed at both G-actin in the supernatant fraction (S) and F-actin in pellet fraction (P). (B–F) Decreased F-actin dynamics by suppression of NDEL1 S336/S332 phosphorylation. (B) Representative time-lapse images of FRAP assay to measure F-actin dynamics at differentiating SH-SY5Y cells expressing RFP-LifeAct. All of NDEL1 over-expressing constructs here contain an shRNA-resistant mutation. A yellow-dashed circle indicates region-of-interest used for bleaching. Bleaching was given by stimulating with 10% 568 nm laser for 10 s. (C) Time-dependent fluorescence recovery graph. Comparisons of the area under FRAP curves (D), the percentage of mobile F-actin fraction calculated by the amount of eventual fluorescence recovery (E), and the average half-max (t1/2) of RFP-LifeAct fluorescence recovery (F). NDEL1 knockdown cells had decreased fluorescence recovery meaning more immobile fraction of F-actin and could not be rescued by NDEL1S332/336A implying its phosphorylation dependency. Each n number is shown at the bottom of the bar of the graph. The scale bar at (B) represents 10 μm. All results are presented as means ± SEM. *p<0.05, **p<0.01, and ***p<0.001 from two-way ANOVA for (C) and one-way ANOVA for (D–F). See also Figure 6—figure supplements 1, 2 and 3, Figure 6—video 1, and Figure 6—source data 1.

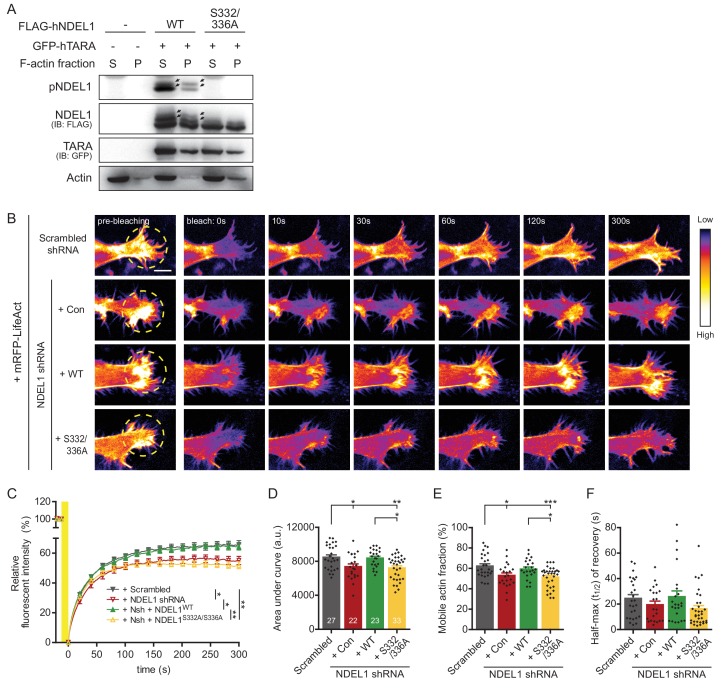
Figure 6—source data 1. Source data for F-actin FRAP assay of NDEL1 knockdown and rescue groups.
elife-50850-fig6-data1.xlsx (203.1KB, xlsx)

Figure 6.

Figure 6—figure supplement 1. Figure of raw data for F-actin FRAP assay plots and results for Microtubule FRAP assay.

Figure 6—figure supplement 1.

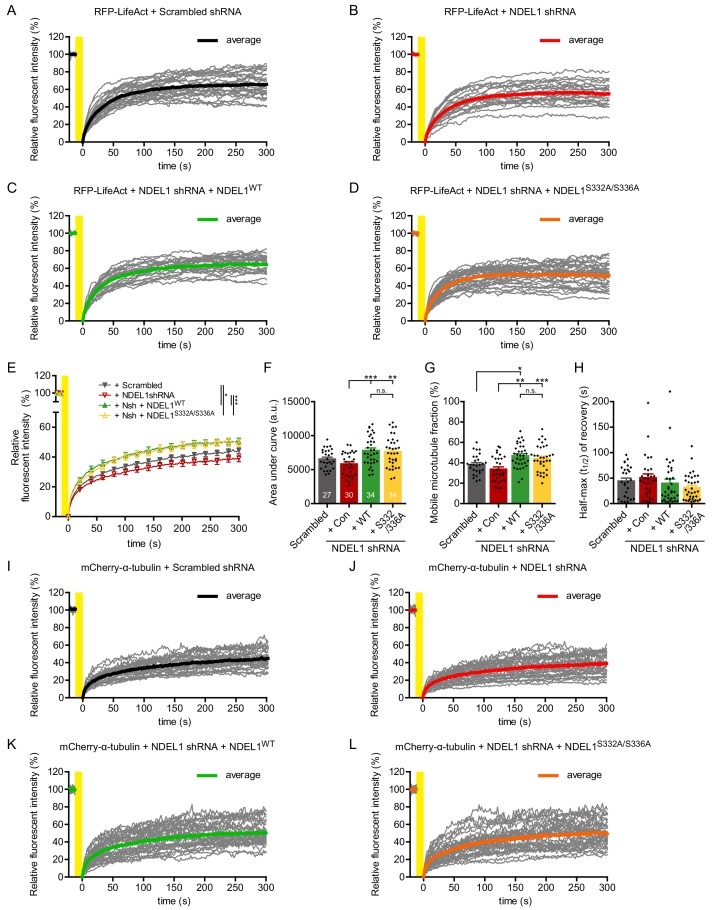
(A–D) Raw data for FRAP assay plots (gray) with average (each color) of each group. RFP-LifeAct was co-expressed with scrambled shRNA (A), NDEL1 shRNA (B), NDEL1 shRNA with shRNA-resistant NDEL1WT (C), and NDEL1 shRNA with shRNA-resistant NDEL1S332/336A (D) in SH-SY5Y cells followed by differentiation and FRAP assay. (E–H) Microtubule dynamics analyzed from time-lapse imaging of FRAP assay with mCherry-α-tubulin. All NDEL1 constructs contain an shRNA-resistant mutation. (E) Time-dependent fluorescence recovery graph. Comparisons of the area under FRAP curves (F), the percentage of motile microtubule fraction calculated by the amount of eventual fluorescence recovery (G), and the half-max (t1/2) of mCherry-α-tubulin fluorescence recovery (H). (I–L) Raw data for FRAP assay plots (gray) with average (each color) of each group. mCherry-α-tubulin was co-expressed with scrambled shRNA (I), NDEL1 shRNA (J), NDEL1 shRNA with shRNA-resistant NDEL1WT (K), and NDEL1 shRNA with shRNA-resistant NDEL1S332/336A (L) in SH-SY5Y cells followed by differentiation and FRAP assay. Each n number is shown at the bottom of the bar of the graph. All results are presented as means ± SEM. *p<0.05, **p<0.01, and ***p<0.001 from two-way ANOVA for (E) and one-way ANOVA for (F–H).
Figure 6—figure supplement 2. Figure for additional data on the effect of S336/S332 phosphorylation on the interaction of NDEL1 with DYNC1I1 and LIS1.

Figure 6—figure supplement 2.

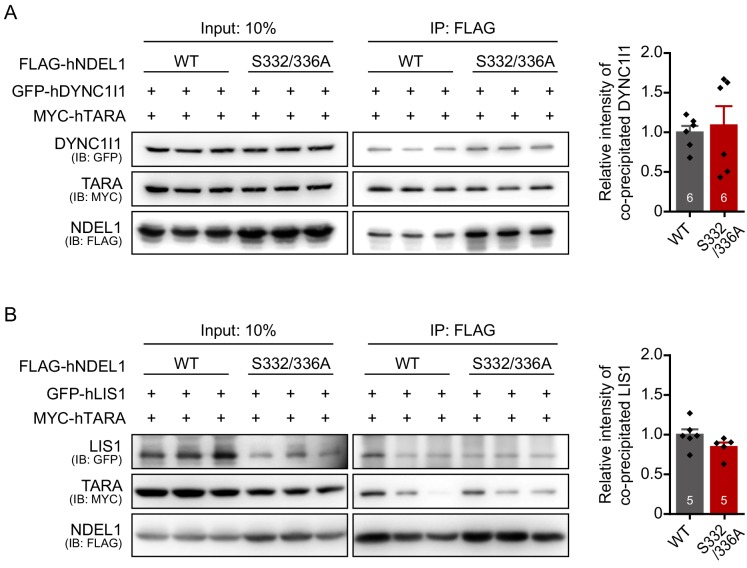
(A) The protein-protein interaction between NDEL1 and dynein intermediate chain. GFP-hDYNC1I1 was co-IPed with FLAG-NDEL1WT or FLAG-NDEL1S332/336A. No significant difference between wild-type and phospho-deficient mutant was detected. (B) The protein-protein interaction between NDEL1 and LIS1. GFP-hLIS1 was co-IPed with FLAG-NDEL1WT or FLAG-NDEL1S332/336A. No significant difference between wild-type and phospho-deficient mutant was detected. Each n number is shown at the bottom of the bar of the graph. All results are presented as means ± SEM.
Figure 6—figure supplement 3. Figure for additional data on the effect of S336/S332 phosphorylation on the lysosomal trafficking.

Figure 6—figure supplement 3.

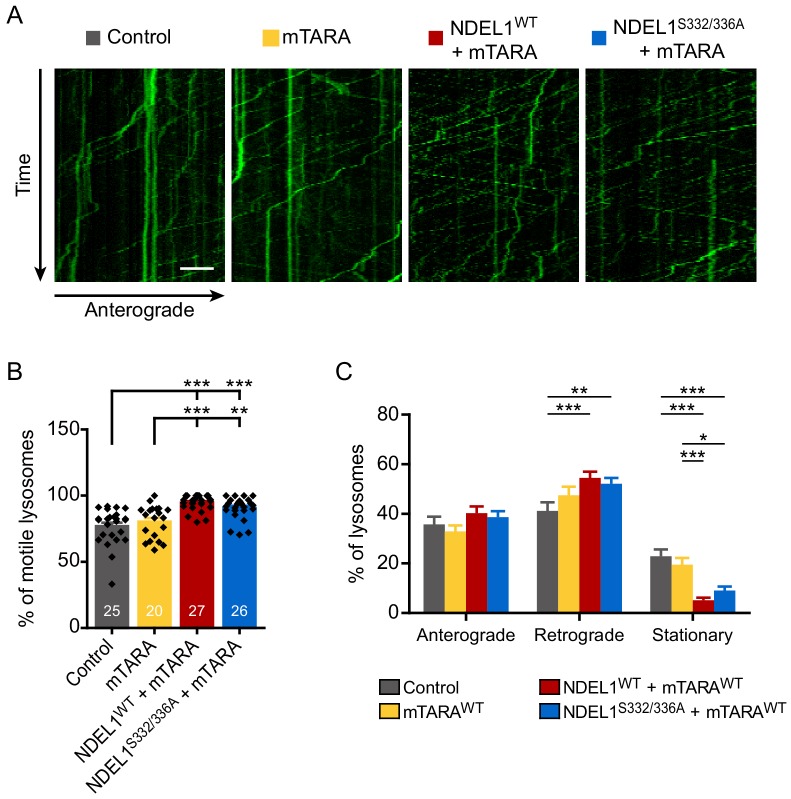
(A–C) Lysosomal trafficking analyzed by time-lapse imaging of primary hippocampal neurons expressing GFP-LAMP1. (A) Representative kymographs. (B) Percentage of motile lysosomes. (C) Percentage of anterograde movement, retrograde movement, and stationary status of lysosomes. Each n number is shown at the bottom of the bar in the graph. The scale bar in (A) represents 10 μm. Results are presented as means ± SEM. *p<0.05, **p<0.01, and ***p<0.001 from one-way ANOVA for (B) and two-way ANOVA for (C).
Figure 6—video 1. Video for the time-lapse imaging series of the FRAP assay for representative cells, related to Figure 6B.
Download video file (6.5MB, mp4)