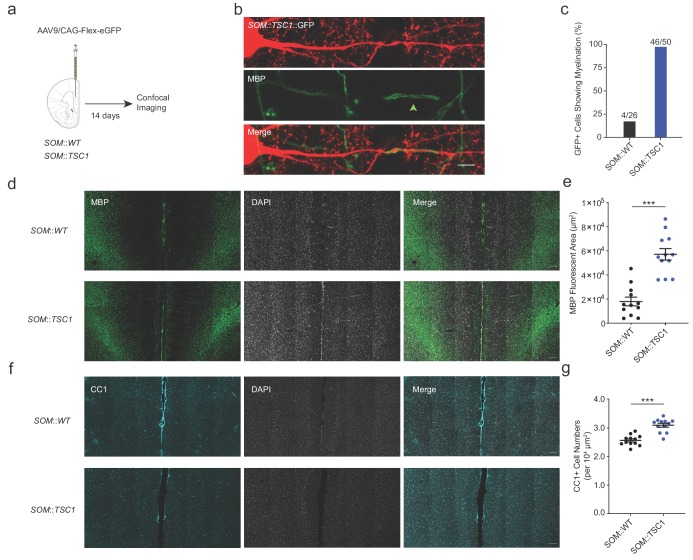
Figure 8. Extensive axonal myelination of SOM::TSC1 cells.
(a) Experimental flowchart. Adult SOM::WT and SOM::TSC1 mice were injected with low-titer AAV9 cre-dependent GFP reporter virus in mPFC, and sacrificed 14 days later for MBP immunofluorescence labeling and confocal microscopy. (b) Maximum projection confocal image of a GFP-labelled SOM::TSC1+ interneuron showing circumferential MBP expression (green). Scale bar, 5 µm. (c) A high proportion of virally-labelled SOM::TSC1 cells exhibited myelination (92.0%, 46 of 50 cells), in contrast to SOM::WT cells (15.4%, 4 of 26 cells) (p<0.001, Fisher’s Exact Test). (d) Representative low-magnification confocal image from mPFC showing the robust increase of myelination (MBP, green) in SOM::TSC1 compared to SOM::WT mice. DAPI in white. Scale bar, 100 µm. (e) Quantification of MBP+ area in mPFC of SOM::TSC1 mice (5.7 × 10⁴ ± 0.48 x 104 µm2) compared to SOM::WT mice (1.8 × 10⁴ ± 0.36 x 104 µm2). p<0.001, Unpaired Student’s two-tailed t-test. (f) Confocal microscopy image showing immunofluorescence of CC1 (cyan) and DAPI (white) in adult mPFC of SOM::WT and SOM::TSC1 mice. Scale bar, 100 µm. (g) CC1+ cell density in adult mPFC of SOM::TSC1 and SOM::WT mice. p<0.001, Unpaired Student’s two-tailed t-test. Black bars indicate mean ± s.e.m.

