

ABSTRACT
Bispecific monoclonal antibodies (BsAbs) are engineered proteins with multiple functionalities and properties. The “bi-specificity” of these complex biopharmaceuticals is a key characteristic for the development of novel and more effective therapeutic strategies. The high structural complexity of BsAbs poses a challenge to the analytical methods needed for their characterization. Modifications of the BsAb structure, resulting from enzymatic and non-enzymatic processes, further complicate the analysis. An important example of the latter type of modification is glycation, which can occur in the manufacturing process, during storage in the formulation or in vivo after application of the drug. Glycation affects the structure, function, and stability of monoclonal antibodies, and consequently, a detailed analysis of glycation levels is required. Mass spectrometry (MS) plays a key role in the structural characterization of monoclonal antibodies and top-down, middle-up and middle-down MS approaches are increasingly used for the analysis of modifications. Here, we apply a novel middle-up strategy, based on IdeS digestion and matrix-assisted laser desorption ionization (MALDI) Fourier transform ion cyclotron resonance (FT-ICR) MS, to analyze all six different BsAb subunits in a single high-resolution mass spectrum, namely two light chains, two half fragment crystallizable regions and two Fd’ regions, thus avoiding upfront chromatography. This method was used to monitor glycation changes during a 168 h forced-glycation experiment. In addition, hot spot glycation sites were localized using top-down and middle-down MALDI-in-source decay FT-ICR MS, which provided complementary information compared to standard bottom-up MS.
KEYWORDS: Bispecific monoclonal antibody, FT-ICR mass spectrometry, MALDI-ISD, glycation, IdeS digestion, middle-up, middle-down, PTM, post-translational modification
Introduction
Bispecific monoclonal antibodies (BsAbs) are recombinant proteins designed to recognize two different epitopes on either one or two different antigens.1 This characteristic is derived from the combination of specificities of two different monoclonal antibodies (mAbs) and has shown great potential for the development of novel therapeutic strategies.2,3 In immunoglobulin G (IgG)-like BsAbs, each antibody molecule contains two different light chains (Lcs) and two different heavy chains (Hcs) that are (inter)connected by disulfide bonds between cysteines to form the typical Y-shaped structure.4 In the simplest format, a BsAb is bivalent; however, valency can be increased by adjusting the format.
As is the case for mAbs, the structural complexity of BsAbs is increased by post-translational modifications (PTMs) such as glycosylation, an enzymatic process that leads to the attachment of glycan structures to specific amino acids (e.g., asparagine-297 of the conserved N-linked glycosylation site of the fragment crystallizable region (Fc)).5,6 Furthermore, the structure of BsAbs can change during or after production as a result of glycation, backbone truncation, oxidation or deamidation.7 Glycation is a non-enzymatic modification that can affect the function and stability of pharmaceutical proteins.8,9 It results from the reaction of a primary amine of a protein and an aldehyde group of a reducing sugar and occurs primarily on lysine residues and to a lesser extent on arginine residues and N-terminal amino acids. Both mAbs and BsAbs can undergo glycation during the manufacturing process, storage in the formulation or once administered to the patient (during in vivo circulation). Determination of the glycation state is important to ensure the structural consistency of the pharmaceutical product throughout the entire manufacturing process.10–12 This analysis is also important during the development phases, when susceptibility tests for glycation are combined with activity tests to design stable antibodies. Factors affecting glycation of biopharmaceuticals include the level and type of sugars in the cell culture broth, the temperature, and the pH used in the cell culture process.13 Although each primary amine in a mAb sequence can potentially be glycated, only a limited number of sites are glycated during production or storage. These glycation hot spots are not determined by any specific consensus motif, but the proximity to catalytic carboxylic acid amino acyl residues seems to play an important role in glycation. Since glycation levels of mAbs are usually low, under normal production conditions, mAbs are often stressed by incubation with high concentrations of reducing sugars in order to promote glycation and facilitate the identification of glycation hot spots. Such stressed or forced conditions increase the level of glycation at the hot spot sites.
The characterization of antibodies with respect to their PTMs, including glycation, is complex and requires the use of various analytical methods, in which mass spectrometry (MS) plays a key role by providing the tools for a multi-level characterization.14–19 For the characterization of recombinant proteins such as mAbs and BsAbs, bottom-up MS analysis is often preferred to other MS-based strategies.20 This method includes chemical reduction of disulfide bonds and enzymatic digestion (e.g., with trypsin), followed by peptide analysis by liquid chromatography (LC)-MS/MS, leading to extensive amino acid sequence coverage.21,22 Further in-depth MS-analysis allows the characterization of PTMs and disulfide bond connectivities.
For bottom-up analysis, it is noted that sample treatment can unintendedly result in additional modifications (artifacts), and that the relationships between specific combinations of PTMs are difficult to assess.23–27 Intact protein analysis and top-down characterization overcomes these limitations since these strategies circumvent digestion and determine the mass of the intact recombinant proteins, including those that carry additional modifications.28–31 However, MS methods that provide so-called intact proteoform profiles are less sensitive and require the use of high-end instrumentation with specific setups.
An intermediate strategy has thus been optimized for mAbs, consisting of a single proteolytic cleavage in the protein backbone, with specific enzymes such as KGP (GingisKHAN) and IdeS, to cleave the Hc in the hinge region, resulting in two parts, namely an antigen-binding fragment (Fab) and Fc.30,32,33 Fab and Fc can then either be mass analyzed in the intact form (i.e., middle-up) or sequenced after reduction of disulfide bonds (i.e., middle-down).16,30,34–41
Previously, we developed both top- and middle-down methods for the structural analysis of mAbs using matrix-assisted laser desorption ionization (MALDI) in combination with in-source decay (ISD) fragmentation on a Fourier transform ion cyclotron (FT-ICR) MS platform.42,43 These methods result in ultrahigh-resolution absorption mode mass spectra that allow relatively fast and simple mAb sequence analysis without the need for chromatography, desalting steps or offline reduction of disulfide bonds, and furthermore include information of the major glycoforms. The MALDI-ISD fragments provide complementary structural information compared to other fragmentation techniques, such as electron-transfer dissociation (ETD) and collision-induced dissociation (CID), that are widely used in electrospray ionization (ESI)-based MS analysis.42 Recently, we applied this approach for the characterization of a sulfated mAb and localized sulfation on a tyrosine of the Lc.44
Here, we applied a middle-up MS strategy to analyze all six different subunits generated after IdeS digestion and chemical reduction of Ang-2-VEGF (A2V) BsAb (i.e., two different Lc, two different Fd and two different Fc/2) in a single mass spectrum. This allowed monitoring of glycation levels during a forced-glycation experiment performed on intact A2V BsAb. Sequential ISD fragment analysis (middle-down) was used to localize hot spot protein backbone glycation sites proximal to N-terminus of A2V BsAb Hcs.
Results
Middle-up MS analysis of A2V bsab subunits and their glycation levels
IdeS digestion followed by chemical reduction of A2V BsAb resulted in the generation of six different subunits (i.e., polypeptide chains) varying in size from approximately 22 to 28 kDa (Figure 1 and Table S1, Supplemental Material). The magnitude mode (mFT) MALDI FT-ICR MS spectrum generated from the analysis of digested and reduced A2V BsAb is shown in Figure 2A. All six different subunits are clearly observed in a single spectrum. It is furthermore noted that all species are detected as doubly charged ions ([M + 2H]2+) and are isotopically resolved (resolving power 61000 at m/z 13837.63). Ultrahigh-resolution allows confident identification of all subunits and is particularly beneficial for the Fc/2 subunits. The sequences of (Fc/2)1 and (Fc/2)2 are similar, with just five amino acid differences at positions 113, 118, 130, 132, 171 (see Table S1). Moreover, both Fc/2 subunits are N-glycosylated, resulting in the detection of multiple glycoforms (not to be confused with glycated forms): G0, G0F, G1F, and G2F (Table S1).
Figure 1.
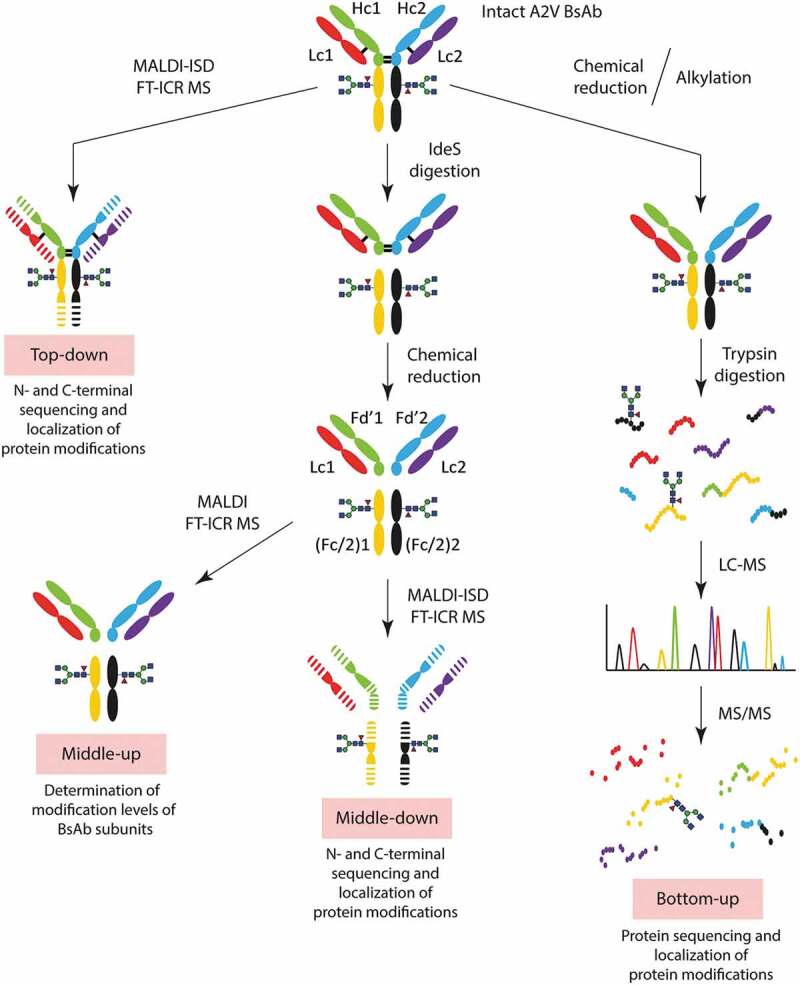
Workflow of analysis followed in this study. A2V BsAb was analyzed by top-down and middle-down MALDI-ISD FT-ICR MS, by middle-up MALDI FT-ICR MS and by bottom-up LC-MS/MS.
Figure 2.
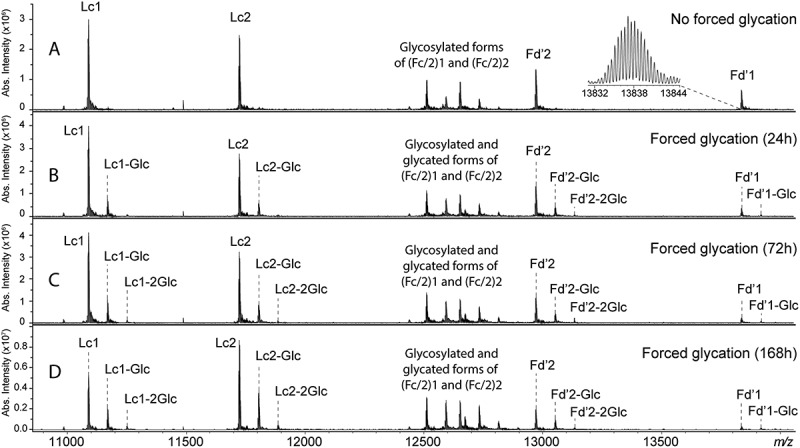
mFT MALDI FT-ICR MS spectra of IdeS-digested and chemically reduced A2V BsAb analyzed (A) prior to and (B-D) after forced glycation. All polypeptide chains, including glycosylated Fc/2 portions, were detected in a single spectrum. Enlargements of such spectra are shown in Figures S1 to S5.
In order to evaluate the performance of our method to determine glycation levels in A2V BsAb, forced glycation of the intact BsAb was performed by a prolonged (i.e., up to 168 h) incubation with glucose. In Figure 2, panels B-D show mFT MALDI FT-ICR MS spectra of glycated, IdeS-digested and chemically reduced A2V BsAb, respectively. In all six polypeptide chains, glycation increased over time. After 168 h of forced glycation, one or two glucose residues (with m/z increases of 81.03 and 162.06, respectively) were detected on Lc1, Lc2, and Fd’2, while one additional glucose was detected on Fd’1.
Glycation levels determined from relative intensities of (Fc/2)1 and (Fc/2)2 ions can be monitored over time, although it is noted that these peaks overlap with some of the Fc/2 N-glycosylated forms, namely G1F and G2F.
For all subunits, it appears that mono-glycation is predominant compared to di-glycation. Enlargements of the spectra depicted in Figure 2 are provided in Figure S1–5, to show the glycation level of each polypeptide chain. Mono-glycation levels were approximately 41%, 45%, 51%, 57%, 28% and 24% for Lc1, Lc2, Fd’1, Fd’2, G0F-(Fc/2)1 and G0F-(Fc/2)2, respectively. The contribution of the glycated G0 glycoform to the signal of the glycated G0F glycoform was not considered. The mass measurement error of each glycated species was lower than 10 ppm.
Sequencing of A2V bsab by top-down and middle-down MS
Intact and IdeS-digested A2V BsAb were analyzed by mFT MALDI-ISD FT-ICR MS using 1,5-diaminonaphthalene (1,5-DAN) as a MALDI matrix. Fragment ions, mainly c-type and z + 1-type, were generated from all polypeptide chains. This resulted in complex MS spectra (depicted in Figure S6) that require ultrahigh resolving power for confident assignments. To further enhance spectral resolution these spectra were visualized in absorption mode (aFT; featuring higher spectral resolution) next to the mFT spectra. This resulted in a slightly higher number of assigned fragment ions. For example, from the analysis of IdeS-digested A2V BsAb 466 and 442 fragment ions were identified in aFT spectra and mFT, respectively. Differences between mFT and aFT spectra are exemplified in Figure S7. As described above, Hc1 and Hc2 exhibit 97.6% sequence identity in the Fc regions. Thus, all c-type fragments generated from (Fc/2)1 and (Fc/2)2 with m/z lower than 7000 were identical and were assigned to both Hc1 and Hc2 sequences. The total sequence coverage resulting from the interpretation of aFT spectra was 38%, 41%, 32%, 35% for Lc1, Lc2, Hc1, and Hc2, respectively (Figure 3). Note that, the presence of a proline in the sequence prevents the formation of c- and z + 1-fragments at this residue. The signal-to-noise ratio (S/N) of identified fragment ions ranged from 5 to 5200 (Figure S8 and Figure S9).
Figure 3.
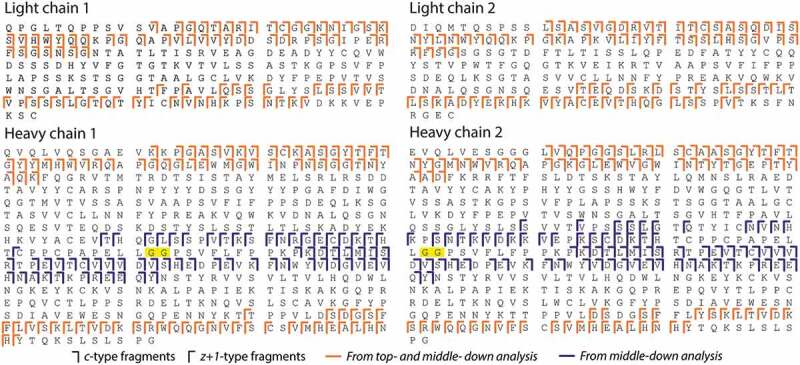
Total sequence coverage for Lc1, Lc2, Hc1, and Hc2. IdeS cleavage site is highlighted in yellow. N-terminal pyroQ was detected on Lc1 and Hc1.
Localization of hot spot glycation sites by top-down and middle-down MS
Glycated A2V BsAb samples were analyzed by aFT MALDI-ISD FT-ICR MS, as intact species and IdeS-digested subunits in the m/z-range 1000–7000 as described for non-glycated A2V BsAb. The appearance of glycated fragment ions in the mass spectra was investigated, assuming potential glycation of lysine or arginine and considering the heterogeneity of the sample with glycated BsAb subunits differing in the position of the glucose residue.
Glycated MALDI-ISD fragments of Hc2 from c11 to c18 (i.e., Leu11 to Leu18) were not detected while both non-glycated and glycated c19 fragments (i.e., m/z 1881.0194 and m/z 2043.0722, respectively) were detected, with glycation increasing overtime during glycation experiments (Figure 4 and Figure S10), indicating glycation on Arg19.
Figure 4.
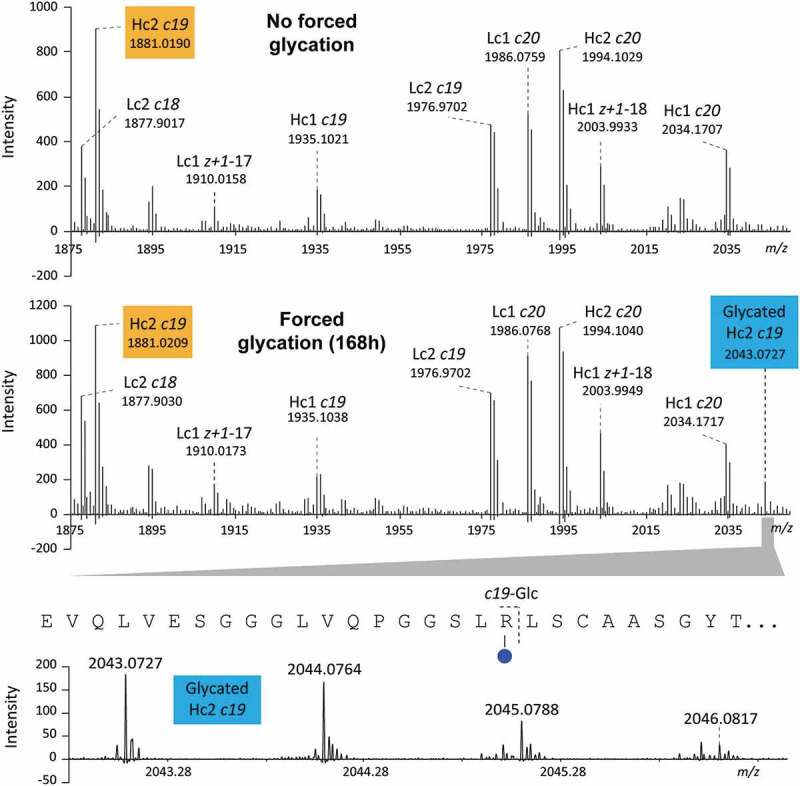
Enlargement of the aFT MALDI-ISD FT-ICR MS spectra obtained from non-glycated (top) and glycated (bottom) intact A2V BsAb. Both non-glycated and glycated c19 fragment ion from Hc2 were detected at m/z 1881.0209 and 2043.0727, respectively, after a 168 h incubation with glucose.
After 168 h, the non-glycated-to-glycated intensity ratio was approximately 8:1 (i.e., intensity c19/intensity glycated c19). Glycated c-type fragments of Hc2 larger than c19 were also detected; however, glycation of Arg19 affected the identification of other glycation sites. For example, glycated c43 fragment, which includes Arg19, Arg38 and Lys43, was detected, but the presence of glycation on Arg38 or Lys43 could not be determined since glycation on Arg19 contributed to the signal. Di-glycated c-type fragments of Hc2 were not observed.
The N-terminus of Hc1 could not be glycated since the primary amine was converted into a pyroglutamate. Therefore, the first potential glycation site of Hc1, identifiable from c-type fragments, was Lys12. Indeed, a glycated c12 fragment on Hc1 was detected at m/z 1429.7538 (Figure 5). After 168 h, the glycation of Lys12 of Hc1 (non-glycated-to-glycated intensity ratio of approximately 30:1) was reduced compared to the glycation of Arg19 of Hc2 (non-glycated-to-glycated intensity ratio of approximately 8:1). The level of glycation on larger c-type fragments was similar, and di-glycated c-type fragments of Hc1 were not observed.
Figure 5.
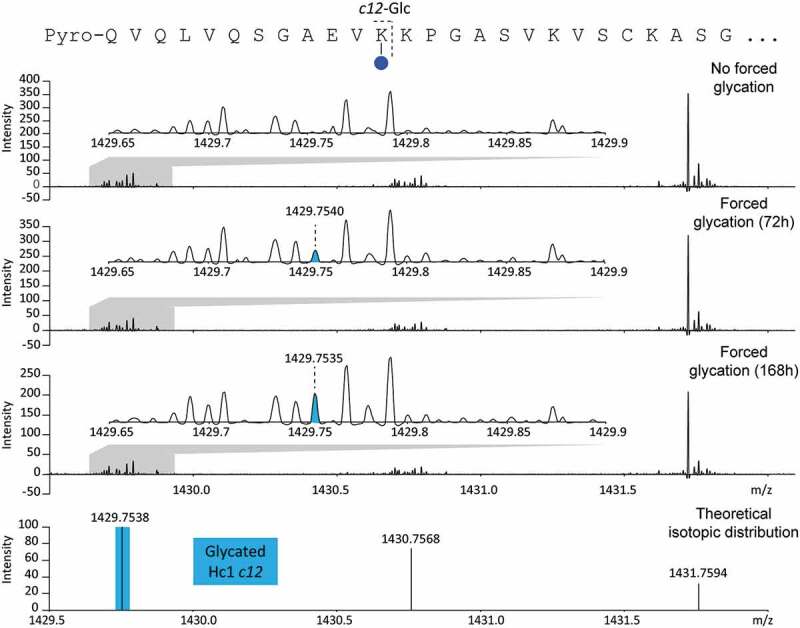
Enlargement of an aFT MALDI-ISD FT-ICR MS spectrum generated from the analysis of non-glycated and glycated intact A2V mAb. Detection of a glycated c12 fragment ion of Hc1 allowed the identification of a glycation site on Lys12.
The analysis of IdeS-digested A2V BsAb revealed a glycation site on (Fc/2)1 and/or (Fc/2)2. In fact, a glycated c11 fragment (i.e., glycation on Lys10; m/z 1346.7360) of (Fc/2)1 and/or (Fc/2)2 was observed (Figure 6). The intensity of this fragment ion increased upon forced glycation. After 168 h, the non-glycated c11 fragment (m/z 1184.6841) was approximately 7 times more intense than the glycated c11 fragment. As described for Hc2, glycation of one site affected the determination of glycation levels of other sites on larger glycated fragment ions. For example, a glycated c12 fragment was observed, but the presence of glycation on Lys12 could not be confirmed because the same c-fragment also contains Lys10.
Figure 6.
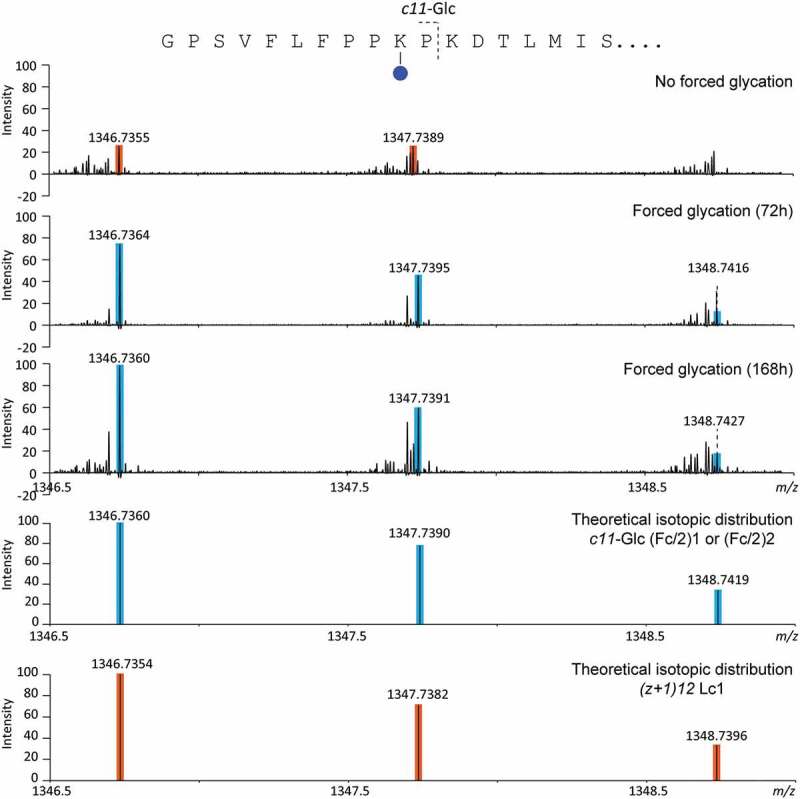
Enlargement of an aFT MALDI-ISD FT-ICR MS spectrum generated from the analysis of non-glycated and glycated IdeS-digested A2V mAb.
Differences in glycation levels between (Fc/2)1 and (Fc/2)2 could not be determined due to a 100% sequence identity of c-type fragment ions generated from these subunits in the m/z-range investigated. Finally, no signals were detected that corresponded to di-glycated c-type fragments.
None of the fragment ions generated from Lc1 and Lc2 and detected in the m/z-range 1000–7000 contained an additional glucose residue. Similarly, glycated z + 1-type fragments were not observed for any of the six subunits generated after IdeS digestion and reduction of A2V BsAb. A summary of identified glycation sites by top-down and middle-down MS is reported in Table 1.
Table 1.
Glycation sites identified by top-down and middle-down MALDI-ISD FT-ICR MS, and standard bottom-up LC-MS/MS.
| Glycated sites | ||
|---|---|---|
| Top-down MS | Hc1 | K12 |
| Hc2 | R19 | |
| Middle-down MS | (Fc/2)1 and (Fc/2)2 | K262 on (Fc/2)1 or K252 on (Fc/2)2 |
| Bottom-up LC-MS/MS with HCD |
Lc1 | N-terminus Q1; K30 |
| Lc2 | K45; K126; K149; K169; K190 | |
| Hc1 | K23; K171; K191; K212; K238; 342; K376 | |
| Hc2 | N-terminus E1; K43; K76; K228; K332 | |
| Bottom-up LC-MS/MS with ETD |
Hc1 | K63; K171; K205; K304; K333; K342; K350; K425 |
| Hc2 | K43; K76; K139; K294; K323; K332; K340; K415 |
Localization of hot spot glycation sites by bottom-up MS
The glycated light and heavy chains of A2V BsAb (from a 168 h glycation experiment) were separated by gel electrophoresis and digested with trypsin, before being analyzed by LC-MS/MS, with higher-energy collisional dissociation (HCD) and in data-dependent acquisition (DDA) mode. Observed peptides were matched to the sequence of the different A2V subunits and results from this analysis are reported in Table S2. Sequence coverage from the bottom-up analysis was 66%, 79%, 87% and 83% for Lc1, Lc2, Hc1 and Hc2, respectively (Table S2 and Figure S11). The glycation sites identified are reported in Table 1 and S3. As an example, the HCD spectrum from the glycated tryptic peptide EVQLVESGGGLVQPGGSLR of Hc2 is reported in Figure S12, revealing glycation of the N-terminus.
In addition, the tryptic digests were analyzed by LC-MS/MS with ETD in DDA mode and results are summarized in Table S2. The sequence coverage was 85% and 82% for Hc1 and Hc2, respectively (Figure S11). The glycation sites identified are reported in Table 1 and S3. As an example, the ETD spectrum from the glycated tryptic peptide VVSVLTVLHQDWLNGKEYK of Hc1 is reported in Figure S12.
The tryptic digest of the Hcs of A2V BsAb was also analyzed by LC-MS/MS with EThcD on selected precursor ions. The EThcD spectra obtained from the glycated tryptic peptide pyroQVQLVQSGAEVKKPGASVK of Hc1 and EVQLVESGGGLVQPGGSLR of Hc2 are reported in Figure S13.
Discussion
Simultaneous analysis of A2V bsab subunits by middle-up MALDI FT-ICR MS
Measurement of the intact mass of proteins provides direct information on protein modifications.28 For complex proteins, such as BsAbs, the determination of the mass of each protein subunit (e.g., Lc and Hc) is important to determine the structural integrity of the molecule. The cleavage of BsAbs into Fab and Fc regions, using specific enzymes, further increases the number of polypeptide chains in the sample. In fact, six different subunits can be obtained from a BsAb by combining specific hinge-region proteolytic cleavage with chemical reduction of disulfide bonds of Fab and Fc regions. Here, we aimed to develop a fast MS-based method for the simultaneous analysis of all six subunits obtained from A2V BsAb. To this end, we used MALDI and ultrahigh-resolution FT-ICR MS to measure two different Lc, two different Fd, and two different glycosylated Fc/2 regions, in a single spectrum. Previously, we reported that MALDI FT-ICR MS analysis of mAbs after IdeS digestion and without chemical reduction allows the analysis of glycosylated Fc/2, solely. Intact Fab portions of the analyzed mAbs were about 100 kDa and therefore were not detectable under the conditions we used.33,42 In this study, we reduced the disulfide bonds and we used THAP as a MALDI matrix to increase the intensity of doubly charged ions which were detected in the m/z-range 11000–14000. Theoretically, in the sample, all six polypeptide chains were present at the same concentration. Consequently, the observed differences in signal intensities may be attributed to differences in ionization efficiency and ion transmission. The use of a 15 T MALDI FT-ICR MS system allowed us to perform measurements at the isotopic resolution, with high sensitivity at high m/z. In addition, compared to ESI-MS, the detection of the different BsAb subunits as doubly charged ion species by MALDI FT-ICR MS allowed us to increase the mass difference between species and avoid overlapping signals. Furthermore, MALDI is more tolerant to the presence of salts or other additives in the sample than ESI. These characteristics allowed a middle-up analysis of BsAbs subunits by MALDI FT-ICR MS after minimal sample preparation and without the need for chromatographic separation.
Determination of glycation level of A2V bsab subunits by middle-up MALDI FT-ICR MS
The MALDI FT-ICR MS method developed was then applied for the analysis of glycated A2V BsAb. In our study, we were able to monitor the glycation level of all polypeptide chains obtained from A2V BsAb in a forced glycation experiment, performed up to 168 h. Mono-glycation was predominant for all chains and di-glycation was likewise observed for all chains except for Fd1. However, the detection of di-glycated Fd1 was probably confounded by the lower signal intensity for this chain; therefore, Fd1 di-glycation cannot be excluded. Glycation of glycosylated (Fc/2)1 and (Fc/2)2 resulted in isobaric glycoforms that affected the interpretation of the glycation levels. This level was, in fact, based on the most abundant glycoform (i.e., G0F), solely.
Glycation of A2V BsAb at the intact level was not investigated. Firstly, with the current technology, the analysis of intact BsAb (~150 kDa) ions by MALDI FT-ICR MS is not possible. Secondly, standard MS-based methods for the analysis of the complex mixture of isomeric structures that result from the glycation of an intact (and glycosylated) BsAb are not available. In fact, techniques such as boronate affinity chromatography, capillary isoelectric focusing and liquid chromatography, commonly used for the analysis of glycated mAbs at an intact level, only allow the separation of non-glycated from glycated structures, without isomeric resolution.9,11,45,46 Thus, although intact mass analysis provides information on the number of sugar molecules attached to a BsAb, the contribution of the different isomeric structures (i.e., combinations of glycated BsAb subunits) to the glycation level cannot be determined.10,45
In addition, the presence of glycosylated structures affects the quantification of glycation levels. This limitation can be overcome by removal of the glycans prior to MS analysis (e.g., using Peptide:N-glycosidase F (PNGase F)).47,48 Similarly, our middle-up approach also overcomes this limitation for the non-glycosylated BsAb subunits, namely the Lcs and the Fd’ subunits.
Structural characterization of A2V bsab by top-down and middle-down MALDI-ISD FT-ICR MS
In this study, we also evaluated the performance of our recently developed MALDI-ISD FT-ICR MS method for the characterization of mAbs, with regard to the analysis of BsAbs. As shown previously, the use of 1,5-DAN as a MALDI matrix predominantly provided N-terminal c-type fragment ions while C-terminal z + 1-type ions were detected at a lower intensity. The hydrogen donor property of 1,5-DAN causes the reduction of disulfide bonds during ionization, allowing the analysis of intact and digested A2V BsAb without chemical reduction.49
Fragment ions were measured in the m/z-range 1000–7000. At m/z lower than 1000, the presence of matrix cluster ions affected the sensitivity for ISD fragment ions, while at m/z higher than 7000 assignment of fragment ions was compromised by a lower resolving power and a lower sensitivity. Thus, mass measurements in this m/z-range allowed us to characterize regions of amino acid sequences close to both the N- and C-terminus. Internal regions of Hc1 and Hc2 could be only characterized after IdeS digestion.
In a previous study, we showed that our method provides complementary amino acid sequence information, when compared with other fragmentation techniques such as ETD and CID.42 This is due to the fact that a more continuous array of fragment ions is observed in the m/z-range analyzed compared to other fragmentation techniques. Using our approach, ISD fragment ions from all six different subunits were detected in one single spectrum, with (Fc/2)1 and (Fc/2)2 having a 100% identity of c-type fragment ions in the analyzed m/z-range.
Ultrahigh-resolution measurements and aFT visualization simplified the interpretation of MALDI-ISD FT-ICR MS spectra, allowing us to manage their complexity and increasing the confidence in the identification. However, although resolving power in aFT spectra was approximately double that in the comparable mFT spectra, the number of assigned ISD fragments increased only slightly. This result was associated with the already high quality of mFT spectra where the number of overlapping ion species was minor compared to the total number of observed fragment ions.
ESI-based MS methods allow the use of a variety of fragmentation techniques, which in general provide complementary sequence information. These techniques rely on the isolation of a precursor ion prior to MS/MS analysis. Typical isolation windows for top-down MS analysis of proteins are larger than 3 m/z units. Thus, the isolation of a single ion species from a dense MS spectrum is not trivial and is usually difficult to achieve in automatic precursor ion selection mode. The overlapping of multiply charged fragment ions from more than one ion species complicates MS/MS spectra, affecting sequence coverage and identification scores. This problem can be tackled by online protein separation techniques (e.g., LC and CE) and specific gas-phase ion/ion reactions.50,51
In our approach, precursor ion selection is avoided but the complexity of fragmentation spectra is reduced by both the generation of singly charged fragment ions (which ensure a maximal m/z difference between ion species) and the use of ultrahigh-resolution. Improving the quality of MALDI-ISD FT-ICR MS spectra acquired at m/z higher than 7000 would lead to higher sequence coverage. Thus, further research focused on novel acquisition strategies (e.g., using new data acquisition systems) and MALDI-ISD conditions (e.g., different ISD matrices) is warranted.52,53
Localization of hot spot glycation sites by middle-down MALDI-ISD FT-ICR MS
MALDI-ISD FT-ICR MS was used to monitor glycation levels of A2V BsAb by relative quantification, based on the comparison between the intensity of non-glycated and glycated fragment ions. Furthermore, MALDI-ISD pinpointed hot spots for glycation close to both N- and C-terminal portions of the BsAb. Hot spot glycation sites were identified on Lys12 of Hc1, Arg19 of Hc2, and Lys10 of (Fc/2)1 and/or (Fc/2)2 (or Lys262 of Hc1 and Lys252 of Hc2), from the observation of glycated c-type fragments. Standard bottom-up MS analysis of trypsin-digested light and heavy chains of A2V mAbs complemented these results.
N-terminal glycation of Hc2 was identified in a bottom-up analysis, while MALDI-ISD determined glycation of Arg19 in Hc2. In the bottom-up approach, each identified glycated lysine was found in a tryptic peptide that contained a missed cleavage at the glycated lysine. Such a missed cleavage at glycated Arg19 would yield EVQLVESGGGLVQPGGSLR(Glc)LSCAASGYTFTNYGMNWVR with a carbamidomethylated cysteine. Bottom-up analysis is not optimal for large peptides in general, and indeed this peptide was not detected in our MS scans.
With regard to glycation on Lys43 of Hc2, results differed between bottom-up and MALDI-ISD. The bottom-up approach determined a glycated Lys43. The MALDI-ISD method identified a glycated c43 fragment from Hc2, but this was not sufficient to pinpoint to glycation on Lys43 due to the presence of (an additional) glycation on Arg19, coming before Lys-43 in the sequence. Hence, a limitation of MALDI-ISD MS analysis is that, in the case of multiple glycations within a fragment ion, it may be hard to pinpoint all the glycations to specific sites. This limitation is common to other top-down MS methods. In fact, although the more commonly used ESI-based top-down approaches typically provide enough sequence information for identification, localization, and quantification of a few positional isomers of modified proteins,54–56 the analysis of complex mixtures of isomers is more difficult.57
The sensitivity of bottom-up MS analysis was improved by selected ion monitoring. For example, glycation on Lys12 of Hc1 was detected by MALDI-ISD MS but not by bottom-up MS analysis in DDA mode. However, the glycated peptide pyroQVQLVQSGAEVKKGASVK of Hc1 was identified by visual inspection of the LC-MS/MS data. Analysis of such a peptide by ETD using selected ion monitoring, allowed us to improve the quality of the MS/MS spectra and to localize the glycation site on Lys12 with high confidence. It is furthermore noted that the application of alternative proteases such as endoproteinase GluC or chymotrypsin potentially increases the number of identified glycation sites.
In conclusion, in this study, a fast method for monitoring of A2V BsAb modifications at the subunit level, based on ultrahigh-resolution MALDI FT-ICR MS, was presented. This method allowed the analysis of glycated A2V BsAb, in a forced glycation experiment, without the need for chromatographic separation of BsAb subunits, providing complementary information compared to standard bottom-up MS analysis. In addition, we have shown that our recently developed MALDI-ISD FT-ICR MS method, developed for the structural characterization of mAbs, can be also applied for the analysis of even more complex biopharmaceuticals such as A2V BsAb. MALDI-ISD localized hot spot glycation sites proximal to N-termini of A2V subunits and provided structure information complementary to standard bottom-up MS analysis with HCD and ETD.
Material and methods
Chemicals
A stock solution of formulated Ang-2-VEGF BsAb at 25 mg/mL (in 20 mM L-histidine, 25 mM sodium chloride, 160 mM sucrose, 7 mM L-methionine, 0.04% (w/v) polysorbate 20, pH 5.5 adjusted with acetic acid) was provided by Roche Diagnostics GmbH and was stored at −80 ᵒC until use. Trifluoroacetic acid (TFA) was purchased from Thermo Fisher Scientific. Formic acid (FA) and 2′,4′,6′-trihydroxyacetophenone (THAP) were purchased from Honeywell. Fabricator (IdeS) was purchased from Genovis. Diammonium hydrogen citrate (DAHC), ammonium bicarbonate, 1,5-DAN (handle with care, check material safety data sheet), acetonitrile (MS grade), horse myoglobin and dithiothreitol (DTT) were purchased from Sigma-Aldrich. Glucose was purchased from Merck. Ultrapure water (Milli-Q; Merck) was used throughout this study.
For intact mass analysis, a THAP solution was prepared by dissolving 7.6 mg of THAP in 375 μL acetonitrile containing 0.1% TFA and adding 125 μL of an 18 mg/mL aqueous solution of DAHC. The matrix was stored at −20 ᵒC for up to 2 weeks.
For ISD experiments, a saturated solution of 1,5-DAN was prepared in acetonitrile/water/FA, 50%:49.95%:0.05%.
Forced glycation
Glycation was achieved by incubation of formulated A2V BsAb with glucose. To this end, 30 μL of formulated BsAb were mixed with 30 μL of glucose 2 M and kept at 25°C for up to 168 h.
Ides digestion of A2V bsab
Non-glycated and glycated A2V BsAb were diluted with 100 mM NH4HCO3, pH 6.8 to a final concentration of 1 mg/mL. IdeS was used according to the protocol of the manufacturer, meaning 1 mg bispecific mAb was digested with 1000 units of IdeS for 1.5 h at 37 ᵒC. The incubation was quenched using a final concentration of 0.05% TFA and the sample was used immediately.
Chemical reduction of disulfide bonds
Reduction of the disulfide bonds of A2V BsAb was performed using DTT. To this end, a 1 M DTT solution was prepared freshly and added to intact or IdeS-digested BsAb, to a final concentration of 20 mM. Reduction was thus performed for 1 h at 60°C.
Desalting by c4-based solid-phase extraction
Prior to MS measurement, intact and IdeS-digested BsAb were desalted by solid-phase extraction (SPE), using a 10 μL ZipTip® (Merck Millipore) filled with 0.6 μL of C4 resin. First, the SPE-tip was flushed 3 times with 15 μL of a solution of acetonitrile:water:FA (50%:49.9%:0.1%) and equilibrated by flushing 3 times with 15 μL of water. Then, 5 μL of digested mAb was diluted with 5 μL of water and allowed to bind to the SPE-tip by pipetting 20 times in and out. Finally, the loaded SPE-tip was flushed 3 times with 15 μL of water and the sample was eluted in 3 μL of acetonitrile:water:FA (50%:49.9%:0.1%).
MALDI spotting
For MALDI middle-up measurements, 1 μL of each sample was spotted onto a polished steel MALDI target plate (Bruker Daltonics) and gently mixed with 1 μL of THAP MALDI matrix. The droplet was allowed to dry at room temperature.
For MALDI-ISD measurements, 1 μL of each sample was spotted onto a polished steel MALDI target plate. Thereafter, 1 μL of 1,5-DAN matrix was added and mixed gently until the onset of small crystal formation. After allowing the spot to dry at room temperature, the samples were measured immediately.
MALDI mass spectrometry measurements
MALDI-(ISD) FT-ICR measurements were performed as previously reported.42 Briefly, measurements were carried out on a 15 T solariX XR FT-ICR mass spectrometer (Bruker Daltonics) equipped with a CombiSource and a ParaCell. The MS system was controlled using ftmsControl software (Bruker Daltonics) and operated in MALDI-mode using a Smartbeam-II Laser System (Bruker Daltonics) at a frequency of 500 Hz with 200 laser shots per measurement. High trapping potentials (up to 9.5 V) and ParaCell DC biases (up to 9.3 V) were used to optimize mass measurement precision. MALDI FT-ICR MS spectra were acquired in serial mode (i.e., 10 single spectra per sample) in the m/z-range 3495–30000 using THAP as a MALDI matrix. MALDI-ISD FT-ICR MS spectra were obtained from a single spot using two acquisition methods for the m/z-ranges between m/z 1012–5000 and between m/z 1012–7000, using 1,5-DAN as a MALDI matrix. Each MALDI-ISD FT-ICR MS spectrum was generated from a variable number of summed spectra (i.e., 10 for middle-up analysis and up to 200 for middle-down analysis). All MS spectra were acquired with 1,000,000 data points and all data files were recorded to include the transient data (fid) file. The measurement time depended on the number of acquired spectra, ranging from approximately 2 min for the acquisitions in the m/z-range 3,495–30,000 to approximately 8 min for the acquisitions in the m/z-range 1,012–5,000. External calibration of MALDI-ISD FT-ICR MS acquisition methods was performed using ISD c-type fragments of myoglobin, while the acquisition method used for MALDI FT-ICR MS analysis was calibrated using the most intense isotopic peak of each non-glycated A2V BsAb subunit (i.e., Lc1, Lc2, Fd’1, Fd’2 and G0F glycoform for both (Fc/2)1 and (Fc/2)2).
Bottom-up mass spectrometry
Glycated (168 h) A2V BsAb was subjected to 4-12% PAGE (NuPAGE Bis-Tris Precast Gel, Life Technologies). Bands were cut from the gel, and the proteins subjected to reduction with DTT, alkylation with iodoacetamide and in-gel trypsin digestion using Proteineer DP digestion robot (Bruker Daltonics).
Tryptic peptides were extracted from the gel slices, lyophilized, dissolved in 95/3/0.1 v/v/v water/acetonitrile/FA and subsequently analyzed by LC-MS using an Easy nanoLC 1200 system (Thermo Scientific) and an Orbitrap Lumos FTMS-system (Thermo Scientific). Trypsin digests were injected onto a homemade precolumn (100 μm × 15 mm; Reprosil-Pur C18-AQ 3 μm, Dr. Maisch, Ammerbuch, Germany) and eluted via a homemade analytical nano-HPLC column (25 cm × 75 μm; Reprosil-Pur C18-AQ 3 um). The gradient was run from 10% to 40% solvent B (20/80/0.1 water/acetonitrile/FA v/v/v) in 30 min. The nano-HPLC column was drawn to a tip of ∼15 μm and acted as the electrospray needle of the MS source.
Data-dependent acquisition with HCD
The Orbitrap Lumos FTMS system was operated in data-dependent acquisition (DDA, top-N) using HCD as a fragmentation technique. In the master scan (MS1) the resolution was set to 120,000 at m/z 200, the m/z-range was 400–1500, and the AGC target was set to 400,000, with a maximum fill time of 50 ms. Dynamic exclusion was set to n = 1 with an exclusion duration of 10 s. Precursor ions with charge states from 2+ to 5+ were isolated using the quadrupole with an isolation window of m/z 1.2. HCD fragment ions were generated using a collision energy of 32 V. MS/MS spectra were acquired in the Orbitrap mass analyzer from m/z 110. The resolution was set to 30,000 at m/z 200 with an AGC target of 50,000 and a maximum fill time of 60 ms.
Data-dependent acquisition with EThcD
LC-MS/MS was also performed using DDA with EThcD (top-N). MS1 parameters were as for DDA analysis with HCD. The calibrated charge-dependent parameters for ion-ion reactions were used with additional supplemental activation at 15%. MS/MS spectra were acquired in the Orbitrap mass analyzer in the m/z-range 200–3000. The resolution was set to 60,000 at m/z 200 with an AGC target of 50,000 and a maximum fill time of 60 ms.
Selected ion monitoring with EThcD
In order to obtain high-quality EThcD spectra of specific-glycated tryptic peptides, MS/MS analysis was limited to selected precursor ions. MS1 and MS/MS parameters were as described for DDA analysis with EThcD, with some differences. The MS/MS scan resolution was set to 120,000 at m/z 200 with an AGC target of 50,000 and a maximum fill time of 128 ms. Multiple MS/MS spectra of the same precursor ions were averaged to improve the S/N ratio. The selected precursor ions were the following: m/z 1056.5 ([M + 4H]4+ of glycated EVQLVESGGGLVQPGGSLRLSC(Carbamidomethyl)AASGYTFTNYGMNWVR of Hc2); m/z 1022.5 ([M + 2H]2+ of glycated EVQLVESGGGLVQPGGSLR of Hc2); m/z 1049.6 and 700.1 ([M + 2H]2+ and [M + 3H]3+ of glycated pyroQVQLVQSGAEVKKPGASVK of Hc1). The quadrupole was set to cycle through the selected precursor ions throughout the entire LC-MS/MS run.
In a post-analysis process, raw data (reduced profile mass spectra) were converted to peak lists using Proteome Discoverer version 2.2 (Thermo Fisher Scientific) and investigated using Mascot v. 2.2.07 (www.matrixscience.com) and the amino acid sequence of A2V BsAb subunits. Mascot searches were with 10 ppm and 0.02 Da deviation for precursor and fragment mass, respectively, and trypsin as an enzyme. Up to two missed cleavages were allowed, and carbamidomethyl on Cys was set as a fixed modification. Methionine oxidation, acetylation (N-terminus and lysine) and glycation (additional 162.0528 Da on N-terminus, lysine, and arginine) were set as variable modifications. The results from this search were compared using Scaffold software version 4.8.9 (www.proteomesoftware.com). A minimum peptide threshold of 80% was used for peptide identification. MS2 spectra of modified peptides were also visually inspected.
Spectra processing
MALDI FT-ICR MS spectra were visualized using DataAnalysis 5.0 SR1 (Bruker Daltonics). For each data file, consisting of 10 acquired MALDI FT-ICR MS spectra, an average mass spectrum was obtained after an internal calibration using the most abundant isotopic peak of each non-glycated A2V BsAb subunit as calibrants. Theoretical m/z-values were obtained using the online tool MS-Isotope (http://prospector.ucsf.edu/prospector/mshome.htm) and theoretical elemental compositions calculated using an in-house developed tool in Excel.
Absorption mode MALDI-ISD FT-ICR mass spectra were generated, directly from the transient data files, using AutoVectis software suite (Spectroswiss, Lausanne, Switzerland), as previously reported.42 aFT mass spectra were internally calibrated using theoretical c-type fragment ions of Hc2 and processed using Autoseequer v6 tool (a part of AutoVectis) for the identification of c- and z + 1-type fragment ions. Fragment ions were assigned with an error tolerance of 10, 20 ppm for the mass spectra produced between m/z 1012–5000 and m/z 1012–7000, respectively. The tolerance for the quality value for the match between the observed and theoretical isotopic distribution was 0.65. Calibrated aFT mass spectra were exported in the ‘’comma-separated value’’ (csv) format, copied in a text file and visually inspected in mMass.58 To this end, the elemental composition of ISD fragments was calculated using an in-house developed tool in Excel and theoretical isotopic abundance distributions were generated using the online tool enviPat Web 2.2 (http://www.envipat.eawag.ch/index.php),59 exported in the csv format and compiled in a text file. Relative quantification of glycated fragment ions was based on the comparison of the intensity of most abundant isotopic peaks of non-glycated and glycated fragments in aFT spectra.
Plots were generated in Excel and exported in Adobe Illustrator CS6 to make the figures.
Funding Statement
This work was supported by the European Commission [765502]; H2020 European Research Council [829157]; Nederlandse Organisatie voor Wetenschappelijk Onderzoek [91116004].
Acknowledgments
This work was supported by the Analytics for Biologics project (Grant agreement ID 765502) of the European Commission and by an Investment Grant NWO Medium with project number 91116004 to P.A.v.V. which is (partially) financed by ZonMw.
DK’s input to this manuscript has been, in part, supported by the TopSpec Project, with funding from the European Horizon 2020 research and innovation program under grant agreement No 829157
Financial conflict of interest
Dr. Tsybin is an employee of Spectroswiss, which commercializes AutoVectis software.
Supplemental Material
The supplementary data for this article can be accessed on the publisher’s website.
References
- 1.Brinkmann U, Kontermann RE.. The making of bispecific antibodies. mAbs. 2017;9:182–13. doi: 10.1080/19420862.2016.1268307. [DOI] [PMC free article] [PubMed] [Google Scholar]
- 2.Sedykh SE, Prinz VV, Buneva VN, Nevinsky GA. Bispecific antibodies: design, therapy, perspectives. Drug Des Dev Ther. 2018;12:195–208. doi: 10.2147/DDDT. [DOI] [PMC free article] [PubMed] [Google Scholar]
- 3.Krishnamurthy A, Jimeno A. Bispecific antibodies for cancer therapy: A review. Pharmacol Ther. 2018;185:122–34. doi: 10.1016/j.pharmthera.2017.12.002. [DOI] [PubMed] [Google Scholar]
- 4.Liu H, May K. Disulfide bond structures of IgG molecules. mAbs. 2012;4:17–23. doi: 10.4161/mabs.4.1.18347. [DOI] [PMC free article] [PubMed] [Google Scholar]
- 5.Zheng K, Bantog C, Bayer R. The impact of glycosylation on monoclonal antibody conformation and stability. mAbs. 2011;3:568–76. doi: 10.4161/mabs.3.6.17922. [DOI] [PMC free article] [PubMed] [Google Scholar]
- 6.Higel F, Seidl A, Sörgel F, Friess W. N-glycosylation heterogeneity and the influence on structure, function and pharmacokinetics of monoclonal antibodies and Fc fusion proteins. Eur J Pharm Biopharm. 2016;100:94–100. doi: 10.1016/j.ejpb.2016.01.005. [DOI] [PubMed] [Google Scholar]
- 7.Liu H, Gaza-Bulseco G, Faldu D, Chumsae C, Sun J. Heterogeneity of monoclonal antibodies. J Pharm Sci. 2008;97:2426–47. doi: 10.1002/jps.21180. [DOI] [PubMed] [Google Scholar]
- 8.Kennedy DM, Skillen AW, Self CH. Glycation of monoclonal antibodies impairs their ability to bind antigen. Clin Exp Immunol. 1994;98:245–51. doi: 10.1111/j.1365-2249.1994.tb06133.x. [DOI] [PMC free article] [PubMed] [Google Scholar]
- 9.Wei B, Berning K, Quan C, Zhang YT. Glycation of antibodies: modification, methods and potential effects on biological functions. mAbs. 2017;9:586–94. doi: 10.1080/19420862.2017.1300214. [DOI] [PMC free article] [PubMed] [Google Scholar]
- 10.Saleem RA, Affholter BR, Deng S, Campbell PC, Matthies K, Eakin CM, Wallace A, et al. A chemical and computational approach to comprehensive glycation characterization on antibodies. mAbs. 2015;7:719–31. doi: 10.1080/19420862.2015.1046663. [DOI] [PMC free article] [PubMed] [Google Scholar]
- 11.Quan C, Alcala E, Petkovska I, Matthews D, Canova-Davis E, Taticek R, Ma S, et al. A study in glycation of a therapeutic recombinant humanized monoclonal antibody: where it is, how it got there, and how it affects charge-based behavior. Anal Biochem. 2008;373:179–91. doi: 10.1016/j.ab.2007.09.027. [DOI] [PubMed] [Google Scholar]
- 12.Brady LJ, Martinez T, Balland A. Characterization of nonenzymatic glycation on a monoclonal antibody. Anal Chem. 2007;79:9403–13. doi: 10.1021/ac7017469. [DOI] [PubMed] [Google Scholar]
- 13.Yuk IH, Zhang B, Yang Y, Dutina G, Leach KD, Vijayasankaran N, Shen AY, Andersen DC, Snedecor BR, Joly JC, et al. Controlling glycation of recombinant antibody in fed-batch cell cultures. Biotechnol Bioeng. 2011;108:2600–10. doi: 10.1002/bit.v108.11. [DOI] [PubMed] [Google Scholar]
- 14.Zhang Z, Pan H, Chen X. Mass spectrometry for structural characterization of therapeutic antibodies. Mass Spectrom Rev. 2009;28:147–76. doi: 10.1002/mas.v28:1. [DOI] [PubMed] [Google Scholar]
- 15.Beck A, Sanglier-Cianférani S, Van Dorsselaer A, Biosimilar B. Next generation antibody characterization by mass spectrometry. Anal Chem. 2012;84:4637–46. doi: 10.1021/ac3002885. [DOI] [PubMed] [Google Scholar]
- 16.Tran BQ, Barton C, Feng J, Sandjong A, Yoon SH, Awasthi S, Liang T, Khan MM, Kilgour DPA, Goodlett DR, et al. Glycosylation characterization of therapeutic mAbs by top- and middle-down mass spectrometry. Data Brief. 2016;6:68–76. doi: 10.1016/j.dib.2015.11.031. [DOI] [PMC free article] [PubMed] [Google Scholar]
- 17.Miller AK, Hambly DM, Kerwin BA, Treuheit MJ, Gadgil HS. Characterization of site-specific glycation during process development of a human therapeutic monoclonal antibody. J Pharm Sci. 2011;100:2543–50. doi: 10.1002/jps.22504. [DOI] [PubMed] [Google Scholar]
- 18.Zhang J, Zhang T, Jiang L, Hewitt D, Huang Y, Kao YH, Katta V, et al. Rapid identification of low level glycation sites in recombinant antibodies by isotopic labeling with 13C6-reducing sugars. Anal Chem. 2012;84:2313–20. doi: 10.1021/ac202995x. [DOI] [PubMed] [Google Scholar]
- 19.Chelius D, Ruf P, Gruber P, Ploscher M, Liedtke R, Gansberger E, Hess J, Wasiliu M, Lindhofer H, et al. Structural and functional characterization of the trifunctional antibody catumaxomab. mAbs. 2010;2:309–19. doi: 10.4161/mabs.2.3.11791. [DOI] [PMC free article] [PubMed] [Google Scholar]
- 20.Zhang Y, Fonslow BR, Shan B, Baek M-C, Yates JR. Protein analysis by shotgun/bottom-up proteomics. Chem Rev. 2013;113:2343–94. doi: 10.1021/cr3003533. [DOI] [PMC free article] [PubMed] [Google Scholar]
- 21.Wang L, Amphlett G, Lambert JM, Blättler W, Zhang W. Structural characterization of a recombinant monoclonal antibody by electrospray time-of-flight mass spectrometry. Pharm Res. 2005;22:1338–49. doi: 10.1007/s11095-005-5267-7. [DOI] [PubMed] [Google Scholar]
- 22.Srzentić K, Fornelli L, Laskay ÜA, Monod M, Beck A, Ayoub D, Tsybin YO, et al. Advantages of extended bottom-up proteomics using Sap9 for analysis of monoclonal antibodies. Anal Chem. 2014;86:9945–53. doi: 10.1021/ac502766n. [DOI] [PubMed] [Google Scholar]
- 23.Stadlmann J, Pabst M, Kolarich D, Kunert R, Altmann F. Analysis of immunoglobulin glycosylation by LC-ESI-MS of glycopeptides and oligosaccharides. Proteomics. 2008;8:2858–71. doi: 10.1002/pmic.v8:14. [DOI] [PubMed] [Google Scholar]
- 24.Wang Y, Lu Q, Wu S-L, Karger BL, Hancock WS. Characterization and comparison of disulfide linkages and scrambling patterns in therapeutic monoclonal antibodies: using LC-MS with electron transfer dissociation. Anal Chem. 2011;83:3133–40. doi: 10.1021/ac200128d. [DOI] [PMC free article] [PubMed] [Google Scholar]
- 25.Marx V. Making sure PTMs are not lost after translation. Nat Methods. 2013;10:201. doi: 10.1038/nmeth.2370. [DOI] [PubMed] [Google Scholar]
- 26.Venne AS, Kollipara L, Zahedi RP. The next level of complexity: crosstalk of posttranslational modifications. Proteomics. 2014;14:513–24. doi: 10.1002/pmic.v14.4-5. [DOI] [PubMed] [Google Scholar]
- 27.Ren D, Pipes GD, Liu D, Shih LY, Nichols AC, Treuheit MJ, Brems DN, Bondarenko PV, et al. An improved trypsin digestion method minimizes digestion-induced modifications on proteins. Anal Biochem. 2009;392:12–21. doi: 10.1016/j.ab.2009.05.018. [DOI] [PubMed] [Google Scholar]
- 28.Tran JC, Zamdborg L, Ahlf DR, Lee JE, Catherman AD, Durbin KR, Tipton JD, Vellaichamy A, Kellie JF, Li M, et al. Mapping intact protein isoforms in discovery mode using top-down proteomics. Nature. 2011;480:254–58. doi: 10.1038/nature10575. [DOI] [PMC free article] [PubMed] [Google Scholar]
- 29.Tvardovskiy A, Wrzesinski K, Sidoli S, Fey SJ, Rogowska-Wrzesinska A, Jensen ON. Top-down and middle-down protein analysis reveals that intact and clipped human histones differ in post-translational modification patterns. Mol Cell Proteomics. 2015;14:3142–53. doi: 10.1074/mcp.M115.048975. [DOI] [PMC free article] [PubMed] [Google Scholar]
- 30.Lermyte F, Tsybin YO, O’Connor PB, Loo JA. Top or middle? Up or down? Toward a standard lexicon for protein top-down and allied mass spectrometry approaches. J Am Soc Mass Spectrom. 2019;30:1149–57. doi: 10.1007/s13361-019-02201-x. [DOI] [PMC free article] [PubMed] [Google Scholar]
- 31.Donnelly DP, Rawlins CM, DeHart CJ, Fornelli L, Schachner LF, Lin Z, Lippens JL, Aluri KC, Sarin R, Chen B, et al. Best practices and benchmarks for intact protein analysis for top-down mass spectrometry. Nat Methods. 2019;16:587–94. doi: 10.1038/s41592-019-0457-0. [DOI] [PMC free article] [PubMed] [Google Scholar]
- 32.Vincents B, Guentsch A, Kostolowska D, von Pawel-rammingen U, Eick S, Potempa J, Abrahamson M, et al. Cleavage of IgG1 and IgG3 by gingipain K from porphyromonas gingivalis may compromise host defense in progressive periodontitis. Faseb J. 2011;25:3741–50. doi: 10.1096/fj.11-187799. [DOI] [PMC free article] [PubMed] [Google Scholar]
- 33.Sjögren J, Olsson F, Beck A. Rapid and improved characterization of therapeutic antibodies and antibody related products using IdeS digestion and subunit analysis. Analyst. 2016;141:3114–25. doi: 10.1039/C6AN00071A. [DOI] [PubMed] [Google Scholar]
- 34.D’Atri V, Fekete S, Beck A, Lauber M, Guillarme D. Hydrophilic interaction chromatography hyphenated with mass spectrometry: a powerful analytical tool for the comparison of originator and biosimilar therapeutic monoclonal antibodies at the middle-up level of analysis. Anal Chem. 2017;89:2086–92. doi: 10.1021/acs.analchem.6b04726. [DOI] [PubMed] [Google Scholar]
- 35.Sorensen M, Harmes DC, Stoll DR, Staples GO, Fekete S, Guillarme D, Beck A, et al. Comparison of originator and biosimilar therapeutic monoclonal antibodies using comprehensive two-dimensional liquid chromatography coupled with time-of-flight mass spectrometry. mAbs. 2016;8:1224–34. doi: 10.1080/19420862.2016.1203497. [DOI] [PMC free article] [PubMed] [Google Scholar]
- 36.Resemann A, Jabs W, Wiechmann A, Wagner E, Colas O, Evers W, Belau E, Vorwerg L, Evans C, Beck A, et al. Full validation of therapeutic antibody sequences by middle-up mass measurements and middle-down protein sequencing. mAbs. 2016;8:318–30. doi: 10.1080/19420862.2015.1128607. [DOI] [PMC free article] [PubMed] [Google Scholar]
- 37.Ayoub D, Jabs W, Resemann A, Evers W, Evans C, Main L, Baessmann C, Wagner-Rousset E, Suckau D, Beck A, et al. Correct primary structure assessment and extensive glyco-profiling of cetuximab by a combination of intact, middle-up, middle-down and bottom-up ESI and MALDI mass spectrometry techniques. mAbs. 2013;5:699–710. doi: 10.4161/mabs.25423. [DOI] [PMC free article] [PubMed] [Google Scholar]
- 38.Srzentic K, Nagornov KO, Fornelli L, Lobas AA, Ayoub D, Kozhinov AN, Gasilova N, Menin L, Beck A, Gorshkov MV, et al. Multiplexed middle-down mass spectrometry as a method for revealing light and heavy chain connectivity in a monoclonal antibody. Anal Chem. 2018;90:12527–35. doi: 10.1021/acs.analchem.8b02398. [DOI] [PubMed] [Google Scholar]
- 39.Haselberg R, De Vijlder T, Heukers R, Smit MJ, Romijn EP, Somsen GW, Domínguez-Vega E, et al. Heterogeneity assessment of antibody-derived therapeutics at the intact and middle-up level by low-flow sheathless capillary electrophoresis-mass spectrometry. Anal Chim Acta. 2018;1044:181–90. doi: 10.1016/j.aca.2018.08.024. [DOI] [PubMed] [Google Scholar]
- 40.Leblanc Y, Ramon C, Bihoreau N, Chevreux G. Charge variants characterization of a monoclonal antibody by ion exchange chromatography coupled on-line to native mass spectrometry: case study after a long-term storage at +5 degrees C. J Chromatogr B Anal Technol Biomed Life Sci. 2017;1048:130–39. doi: 10.1016/j.jchromb.2017.02.017. [DOI] [PubMed] [Google Scholar]
- 41.Faid V, Leblanc Y, Bihoreau N, Chevreux G. Middle-up analysis of monoclonal antibodies after combined IgdE and IdeS hinge proteolysis: investigation of free sulfhydryls. J Pharm Biomed Anal. 2018;149:541–46. doi: 10.1016/j.jpba.2017.11.046. [DOI] [PubMed] [Google Scholar]
- 42.van der Burgt YEM, Kilgour DPA, Tsybin YO, Srzentić K, Fornelli L, Beck A, Wuhrer M, Nicolardi S, et al. Structural analysis of monoclonal antibodies by ultrahigh resolution MALDI in-source decay FT-ICR mass spectrometry. Anal Chem. 2019;91:2079–85. doi: 10.1021/acs.analchem.8b04515. [DOI] [PMC free article] [PubMed] [Google Scholar]
- 43.Kilgour DPA, Wills R, Qi Y, O’Connor PB. Autophaser: an algorithm for automated generation of absorption mode spectra for FT-ICR MS. Anal Chem. 2013;85:3903–11. doi: 10.1021/ac303289c. [DOI] [PMC free article] [PubMed] [Google Scholar]
- 44.Tyshchuk O, Gstöttner C, Funk D, Nicolardi S, Frost S, Klostermann S, Becker T, Jolkver E, Schumacher F, Koller CF, et al. Characterization and prediction of positional 4-hydroxyproline and sulfotyrosine, two post-translational modifications that can occur at substantial levels in CHO cells-expressed biotherapeutics. mAbs. 2019;11:1219–32. doi: 10.1080/19420862.2019.1635865. [DOI] [PMC free article] [PubMed] [Google Scholar]
- 45.Mo J, Jin R, Yan Q, Sokolowska I, Lewis MJ, Hu P. Quantitative analysis of glycation and its impact on antigen binding. mAbs. 2018;10:406–15. doi: 10.1080/19420862.2018.1438796. [DOI] [PMC free article] [PubMed] [Google Scholar]
- 46.Fischer S, Hoernschemeyer J, Mahler HC. Glycation during storage and administration of monoclonal antibody formulations. Eur J Pharm Biopharm. 2008;70:42–50. doi: 10.1016/j.ejpb.2008.04.021. [DOI] [PubMed] [Google Scholar]
- 47.Goetze AM, Liu YD, Arroll T, Chu L, Flynn GC. Rates and impact of human antibody glycation in vivo. Glycobiology. 2012;22:221–34. doi: 10.1093/glycob/cwr141. [DOI] [PubMed] [Google Scholar]
- 48.Zhang B, Yang Y, Yuk I, Pai R, McKay P, Eigenbrot C, Dennis M, Katta V, Francissen KC, et al. Unveiling a glycation hot spot in a recombinant humanized monoclonal antibody. Anal Chem. 2008;80:2379–90. doi: 10.1021/ac701810q. [DOI] [PubMed] [Google Scholar]
- 49.Fukuyama Y, Iwamoto S, Tanaka K. Rapid sequencing and disulfide mapping of peptides containing disulfide bonds by using 1,5-diaminonaphthalene as a reductive matrix. J Mass Spectrom. 2006;41:191–201. doi: 10.1002/(ISSN)1096-9888. [DOI] [PubMed] [Google Scholar]
- 50.Huang T-Y, McLuckey SA. Top-down protein characterization facilitated by ion/ion reactions on a quadrupole/time of flight platform. Proteomics. 2010;10:3577–88. doi: 10.1002/pmic.201000187. [DOI] [PMC free article] [PubMed] [Google Scholar]
- 51.Bashyal A, Sanders JD, Holden DD, Brodbelt JS. Top-down analysis of proteins in low charge states. J Am Soc Mass Spectrom. 2019;30:704–17. doi: 10.1007/s13361-019-02146-1. [DOI] [PMC free article] [PubMed] [Google Scholar]
- 52.Kooijman PC, Nagornov KO, Kozhinov AN, Kilgour DPA, Tsybin YO, Heeren RMA, Ellis SR, et al. Increased throughput and ultra-high mass resolution in DESI FT-ICR MS imaging through new-generation external data acquisition system and advanced data processing approaches. Sci Rep. 2019;9:8. doi: 10.1038/s41598-018-36957-1. [DOI] [PMC free article] [PubMed] [Google Scholar]
- 53.Fukuyama Y, Izumi S, Tanaka K. 3-hydroxy-2-nitrobenzoic acid as a MALDI matrix for in-source decay and evaluation of the isomers. J Am Soc Mass Spectrom. 2018;29:2227–36. doi: 10.1007/s13361-018-2030-y. [DOI] [PubMed] [Google Scholar]
- 54.Zhang H, Ge Y. Comprehensive analysis of protein modifications by top-down mass spectrometry. Circ Cardiovasc Genet. 2011;4:711. doi: 10.1161/CIRCGENETICS.110.957829. [DOI] [PMC free article] [PubMed] [Google Scholar]
- 55.Lin Z, Wei L, Cai W, Zhu Y, Tucholski T, Mitchell SD, Guo W, Ford SP, Diffee GM, Ge Y, et al. Simultaneous quantification of protein expression and modifications by top-down targeted proteomics: a case of the sarcomeric subproteome. Mol Cell Proteomics. 2019;18:594–605. doi: 10.1074/mcp.TIR118.001086. [DOI] [PMC free article] [PubMed] [Google Scholar]
- 56.Pesavento JJ, Mizzen CA, Kelleher NL. Quantitative analysis of modified proteins and their positional isomers by tandem mass spectrometry: human histone H4. Anal Chem. 2006;78:4271–80. doi: 10.1021/ac0600050. [DOI] [PubMed] [Google Scholar]
- 57.Woodling KA, Eyler JR, Tsybin YO, Nilsson CL, Marshall AG, Edison AS, Al-Naggar IM, Bubb MR, et al. Identification of single and double sites of phosphorylation by ECD FT-ICR/MS in peptides related to the phosphorylation site domain of the myristoylated alanine-rich c kinase protein. J Am Soc Mass Spectrom. 2007;18:2137–45. doi: 10.1016/j.jasms.2007.09.010. [DOI] [PubMed] [Google Scholar]
- 58.Strohalm M, Hassman M, Košata B, Kodíček M. mMass data miner: an open source alternative for mass spectrometric data analysis. Rapid Commun Mass Spectrom. 2008;22:905–08. doi: 10.1002/(ISSN)1097-0231. [DOI] [PubMed] [Google Scholar]
- 59.Loos M, Gerber C, Corona F, Hollender J, Singer H. Accelerated isotope fine structure calculation using pruned transition trees. Anal Chem. 2015;87:5738–44. doi: 10.1021/acs.analchem.5b00941. [DOI] [PubMed] [Google Scholar]
Associated Data
This section collects any data citations, data availability statements, or supplementary materials included in this article.