Abstract
Objective
Accurate and reliable detection of tremor onset in Parkinson’s disease (PD) is critical to the success of adaptive deep brain stimulation (aDBS) therapy. Here, we investigated the potential use of feature engineering and machine learning methods for more accurate detection of rest tremor in PD.
Methods
We analyzed the local field potential (LFP) recordings from the subthalamic nucleus region in 12 patients with PD (16 recordings). To explore the optimal biomarkers and the best performing classifier, the performance of state-of-the-art machine learning (ML) algorithms and various features of the subthalamic LFPs were compared. We further used a Kalman filtering technique in feature domain to reduce the false positive rate.
Results
The Hjorth complexity showed a higher correlation with tremor, compared to other features in our study. In addition, by optimal selection of a maximum of five features with a sequential feature selection method and using the gradient boosted decision trees as the classifier, the system could achieve an average F1 score of up to 88.7% and a detection lead of 0.52 s. The use of Kalman filtering in feature space significantly improved the specificity by 17.0% (p = 0.002), thereby potentially reducing the unnecessary power dissipation of the conventional DBS system.
Conclusion
The use of relevant features combined with Kalman filtering and machine learning improves the accuracy of tremor detection during rest.
Significance
The proposed method offers a potential solution for efficient on-demand stimulation for PD tremor.
Keywords: Parkinson’s disease (PD), Kalman filtering, Machine learning (ML), Local field potential (LFP), Tremor detection, Adaptive deep-brain stimulation
1. Introduction
Deep brain stimulation (DBS) is a widely utilized treatment option to reduce the motor symptoms of advanced PD such as resting tremor, akinesia, and rigidity. Conventional DBS delivers constant and high-frequency (~130 Hz) stimulation pulses which may cause side effects such as psychiatric symptoms and speech impairment (Meidahl et al., 2017, Yao et al., 2018). Moreover, open-loop charge delivery increases the power consumption of the DBS system, potentially requiring a surgical battery replacement every three to five years. To address these challenges, the so-called adaptive DBS (aDBS) approach offers a promising alternative, by replacing conventional stimulation with a closed-loop and adaptive one (Burgess et al., 2010; Santaniello et al., 2011; Little et al., 2013; Priori et al., 2013; Meidahl et al., 2017; Arlotti et al., 2018; Yao et al., 2018). In this approach, the neuromodulation is dynamically controlled by motor symptoms such as tremor or bradykinesia, either in a continuous way (Rosa et al., 2015), or with an on-off strategy (Yamamoto et al., 2013; Little et al., 2013). By providing feedback from relevant biomarkers, such as the beta band power of LFPs in the subthalamic nucleus (STN) (Brown, 2003), adaptive DBS can titrate stimulation, hence reducing the total stimulation delivered, improving both the efficacy of treatment and side effects, and increasing the battery life. Proof-of-concept studies of adaptive DBS in humans (Little et al., 2013) have reported promising advantages over conventional DBS, including a 27% improvement of the Unified PD Rating Scale (UPDRS), 56% reduction of stimulation time and energy dissipation, and improved speech intelligibility (Little et al., 2016a, 2016b, 2013). The adaptive DBS method tested used feedback based on the beta amplitude of LFPs recorded by the stimulation electrodes.
In order to characterize motor symptoms in PD, biomarkers in the LFP of STN and GPi have been studied (Beudel and Brown, 2016; Weinberger et al., 2009; Hirschmann et al., 2016, 2013; Qasim et al., 2016). For instance, neuronal oscillations within the motor network and over the tremor frequency range (~3–7 Hz) have been shown to correlate with resting tremor, measured as increased cortico-muscular coherence during tremor (Hirschmann et al., 2013). The beta band (13–30 Hz) power in the cortex and STN has been shown to reduce during PD rest tremor (Hirschmann et al., 2013; Qasim et al., 2016), while the cortical beta phase-amplitude coupling with broadband gamma oscillations (50–200 Hz) decreases during rest tremor (Qasim et al., 2016). The ratio of high-frequency oscillations (HFOs) between the slow band (200–300 Hz) and the fast band (300–400 Hz) has also been shown to increase during rest tremor (Hirschmann et al., 2016). Moreover, the low gamma (33–55 Hz) power in the STN LFP is increased during rest tremor in Parkinson patients (Weinberger et al., 2009). While such features can potentially be used for real-time detection of resting tremor, the majority of current adaptive DBS experiments have been overly simplistic and based on a single feature such as beta band power, with a simple thresholding mechanism to control DBS. However, the exclusive usage of beta-band power in the STN may not be optimal for tremor detection in PD, given that it is not correlated with tremor (Beudel and Brown, 2016). Therefore, other relevant biomarkers of pathological neural activity and powerful classification algorithms need to be investigated to more accurately characterize and predict the tremor state (Yao et al., 2018).
To improve resting tremor detection from the LFP, a multi-feature classification approach based on features of the LFP such as variance, zero crossing rate, autocorrelation, band powers, and wavelet transform has been used to identify tremor related characteristics in PD patients (Bakstein et al., 2012), and shows that LFPs from STN or GPi provide sufficient information for rest tremor detection. In another study, using beta, gamma, and tremor band powers, the ratio of slow and fast high frequency oscillations (HFOs), and a Hidden Markov Model (HMM), the Parkinsonian rest tremor was also accurately detected from STN LFPs (Hirschmann et al., 2017). Both frequency and time domain features such as multiple band powers and the Hjorth parameters from subthalamic LFPs, combined with a logistic regression classifier have also been used to detect Parkinsonian rest tremor (Shah et al., 2018). However, despite promising results, the latency of tremor detection was not reported in these studies, and is an important parameter for implementation of closed-loop DBS where stimulation should best anticipate symptomatic disturbance. Furthermore, it is still unclear whether the use of more domain-specific features and advanced machine learning techniques could further improve the tremor detection accuracy. In various other neurological applications such as seizure detection for medication-resistant epilepsy (Shoaran et al., 2018) and movement intention decoding in brain-machine interface systems (Glaser et al., 2017), the use of machine learning and domain-specific features has made a significant impact by achieving remarkable accuracies. Particularly, gradient boosting-based algorithms such as XGBoost (Chen and He, 2015) have been very successful in classifying time-series neurophysiological data with limited training sets and have been included in our analysis. Such decision tree-based classifiers have been recently integrated on microchips with ultra-low power consumption and small area utilization (Shoaran et al., 2018) and could potentially be used for hardware implementation of aDBS. Moreover, the evaluation of tremor detection algorithms in a greater number of patients with different tremor characteristics is another crucial step for the reliability assessment of aDBS and its translation to a clinical setting.
In this work, we study the predictive accuracy of various biomarkers in the LFP recorded in the region of STN, such as band power in relevant frequency bands, beta-HFO phase-amplitude coupling (PAC) (van Wijk et al., 2016), the Hjorth parameters that have been primarily used for EEG characterization (Hjorth, 1970), and wavelet entropy (Rosso et al., 2001). We evaluate these neurophysiological biomarkers for quantifying Parkinsonian rest tremor in a group of 12 PD patients with different tremor intensities, and employ advanced ML models to detect rest tremor periods. Moreover, to further enhance the tremor detection performance, a Kalman filtering approach in the feature domain is explored (Yao et al., 2018).
2. Materials and methods
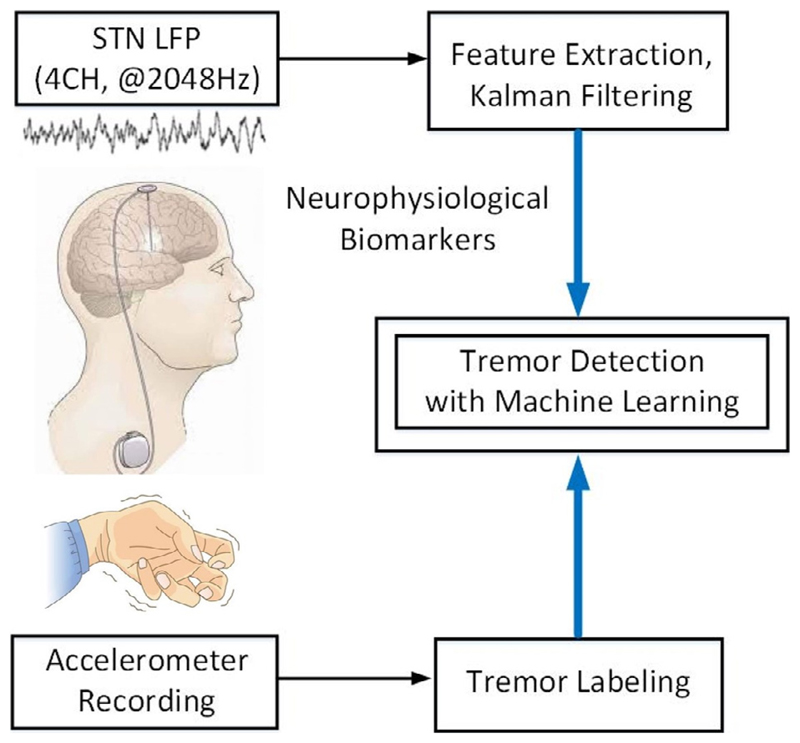
The overview of our proposed framework for tremor detection is depicted in Fig. 1. The goal is to accurately detect the occurrence of resting tremor by directly measuring the neural activity in STN. We opted to detect tremor from the LFP rather than from peripheral inertial signals as then stimulation could potentially anticipate the physical symptom. In addition, wireless communication between peripheral sensors and an internalized system introduces potential vulnerability to hacking, and additional energy demands. We used a supervised learning approach to classify the continuous LFP signal, while simultaneous measurements from an accelerometer sensor were used to label the data, as ‘ground truth’. The neurophysiological biomarkers were extracted from multi-channel LFP signals and a Kalman filter was used to process the extracted features. We subsequently trained different classifiers on a labeled feature set and evaluated the trained models on the test set to detect the tremor and non-tremor states.
Fig. 1.
Overview of the proposed framework for tremor detection. The output of machine learning-based classifier can be used to activate DBS in an envisioned closed-loop system.
2.1. Patients and surgical procedure
We studied 12 PD patients recruited from the University of Oxford. All subjects gave informed consent to participate, and the local research ethics committee approved the study. Patients were aged between 46 and 73 years old (mean 62 years old, 10 males), and had a disease duration ranging from 4 to 17 years (mean 10 years). Bilateral DBS electrodes were implanted into the STN, preceding the therapeutic stimulation for advanced idiopathic PD with motor fluctuations or dyskinesias. All the studied patients also had resting tremor. Detailed techniques for targeting and implanting electrodes in the STN have been previously reported (Foltynie and Hariz, 2010). Microelectrode recording was not performed during surgery. The model 3389 quadripolar macroelectrode with four platinum-iridium cylindrical contacts was used (Medtronic Neurologic Division, Minneapolis, USA). The contacts of this electrode range from 0 to 3, with contact 0 indicating the most caudal contact. Electrodes were localized intra-operatively through the effect of direct stimulation, and immediately post-operation by stereotactic imaging. Nevertheless, considering that not all contacts lie in the STN per se, we termed the area sampled by the electrode contact as the STN region (STNr). The extension cables for DBS electrodes were externalized through the scalp, enabling recordings prior to connection to a subcutaneous pacemaker, which was implanted in a second operation a week later. A TMSi porti (TMS international, Netherlands) and associated acquisition software were used to record monopolar LFPs at a sampling rate of 2048 Hz. These were then common average referenced and bandpass filtered between (0.5–500 Hz). Bipolar LFPs were extracted offline, by subtracting the monopolar signals measured by neighboring contacts on each electrode (Bakstein et al., 2012). We included three bipolar channels in our analysis (0–1, 1–2, 2–3). In a separate study, we included the bipolar channels between 0–2 and 1–3 contacts, which is a preferred strategy to reject the stimulation artifact on the middle electrode during adaptive DBS (Arlotti et al., 2016b; Little et al., 2016a). We also compared the performance of our classifier using a bipolar versus monopolar electrode contact configuration.
Overall, the dataset included 16 LFP recordings (7 from right side), as patients with bilateral tremor were recorded from both hemispheres. The LFPs were recorded from the STNr with both medication withdrawn overnight and DBS off, while the acceleration of the contralateral limb was simultaneously recorded. Patients were at rest throughout the recordings. The LFP recordings varied from 1.5 to 10 (mean 6.2) minutes in duration among patients. Tremor prevalence ranged from 41 to 97 (mean 73) % of time.
2.2. Data annotation
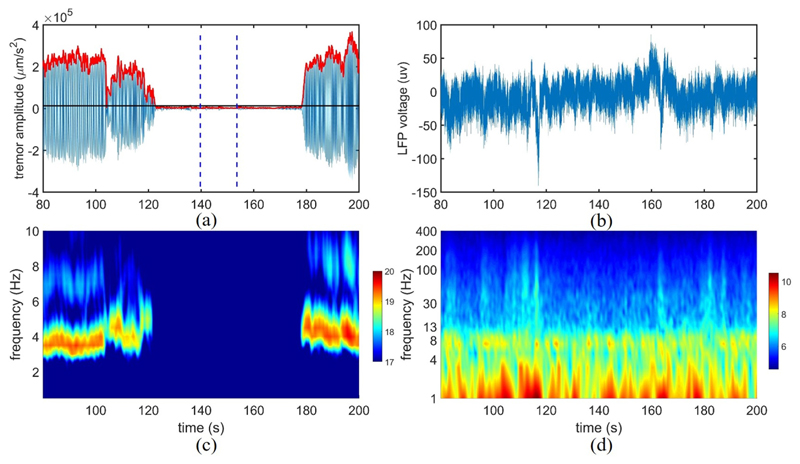
In order to label the data, the tremor frequency fT of the accelerometer recording was calculated as the frequency associated with the highest amplitude (over 1–10 Hz). Then, a Butter-worth filter of second-order over the frequency range of (fT − 1, fT + 1 Hz) was used to filter the acceleration signal from the limb, and a Hilbert transform was subsequently applied to extract the envelope, as shown in Fig. 2. We then identified the resting non-tremor period as baseline, through visual inspection. For instance, the interval between the two vertical lines in Fig. 2 (a) is considered as non-tremor. The mean value + five times the standard deviation of baseline was empirically set as threshold, and the envelope was labeled as tremor if its amplitude surpassed the threshold level. While this method was effective in most patients, in some cases (i.e., 5 recordings) we had to slightly adjust the threshold to avoid the unnecessary annotation of very small and short-duration motions as tremor, and avoid rapid label switching within longer tremor episodes (Hirschmann et al., 2017).
Fig. 2.
(a) Tremor labeling based on acceleration signal, (b) the corresponding LFP. The red curve shows the envelope of the filtered acceleration around the tremor frequency, while the two vertical lines define the non-tremor period as baseline for threshold setting. The horizontal black line represents the threshold to separate the tremor and non-tremor periods; (c) Time-frequency decomposition of the acceleration signal, (d) and corresponding LFP (the y-axis is displayed in log scale). The color bars on the right indicate the log of the absolute power.
2.3. Feature extraction
In order to compute the LFP biomarkers of tremor, we used a 1-second window with half overlapping to continuously segment the LFP recordings. Fifteen features were extracted from the three bipolar channels as described in Table 1, forming a 45-dimensional feature vector. In addition to beta power, which is the most commonly used feature in aDBS studies, we explored other potentially relevant biomarkers based on prior research on Parkinson’s disease and other neurological diseases, with the goal of improving tremor detection performance. The selected feature set included band power in several frequency bands, phase-amplitude coupling, and time-domain features such as the Hjorth parameters, as outlined below.
Table 1. Neurophysiological biomarkers for resting tremor detection.
| Biomarker | Description |
|---|---|
| 1. Low Beta | Spectral power in (13–20 Hz) (Priori et al., 2004; Qasim et al., 2016) |
| 2. High Beta | Spectral power in (20–30 Hz) (Priori et al., 2004) |
| 3. Low Gamma | Spectral power in (31–45 Hz) (Weinberger et al., 2009) |
| 4. Gamma | Spectral power in (60–90 Hz) (Trottenberg et al., 2006) |
| 5. High Gamma | Spectral power in (100–200 Hz) (Ray et al., 2008) |
| 6. Low HFO | Spectral power in (200–300 Hz) (López-Azcárate et al., 2010) |
| 7. High HFO | Spectral power in (300–400 Hz) (López-Azcárate et al., 2010) |
| 8. HFO Ratio | Power ratio of HFO in (200–300 Hz) and (300–400 Hz) (Hirschmann et al., 2016) |
| 9. PAC | Phase-amplitude coupling between the phase of beta (13–30 Hz) and the amplitude of HFO (150–400 Hz) (van Wijk et al., 2016) |
| 10. Tremor Power | Spectral power in (3–7 Hz) |
| 11. Max Power | The peak power in (3–7 Hz) |
| 12. Wavelet Ent | Wavelet entropy (Rosso et al., 2001) |
| 13. Hjo Act | Hjorth activity (Hjorth, 1970) |
| 14. Hjo Mob | Hjorth mobility (Hjorth, 1970) |
| 15. Hjo Com | Hjorth complexity (Hjorth, 1970) |
2.3.1. Low and high HFO power
The presence of HFO in STN (~300 Hz) was reported in patients with PD under dopaminergic treatment (Foffani et al., 2003). It has been further shown that the lower frequency HFO power (200–300 Hz) decreases after levodopa intake, while the higher frequency HFO power (300–400 Hz) increases (López-Azcárate et al., 2010). Furthermore, the ratio between the low and high HFO powers is shown to be a marker of Parkinsonian resting tremor. This ratio has been shown to increase when tremor occurs (Hirschmann et al., 2016).
2.3.2. Phase-amplitude coupling (PAC)
The coupling between the beta-band phase and HFO (150–400 Hz) amplitude in STN LFPs has been shown to have a positive correlation with severity of motor impairment, while it decreases after the intake of dopaminergic medication (van Wijk et al., 2016).
2.3.3. Tremor power and maximum peak power
An increased cortico-muscular coherence during tremor has been observed within (3–7 Hz) frequency range in the motor network (Hirschmann et al., 2013). In our study, we extracted both the total power and the maximum peak power in (3–7 Hz) to index the tremor state.
2.3.4. Hjorth parameters
The Hjorth parameters of a signal describe its statistical characteristics in the time domain and are commonly used in EEG studies (Hjorth, 1970). These parameters include the activity, mobility, and complexity. While the Hjorth activity indicates the signal variance, mobility is a measure of the average frequency. Furthermore, the variations in frequency within a given time period are presented by the Hjorth complexity.
2.3.5. Gamma power
Multi-site LFP recordings from STN have shown an increased low gamma oscillation (31–45 Hz) during strong tremor periods (Weinberger et al., 2009), suggesting that low gamma might be a pertinent feature for tremor detection. We further included the gamma power in a higher frequency band (60–90 Hz) previously reported in STN LFPs (Trottenberg et al., 2006), and the high gamma (100–200 Hz) power that has been reported in macaque local field potentials (Ray et al., 2008).
2.3.6. Wavelet entropy
The wavelet entropy can be used to analyze the transient features of a non-stationary signal, while estimating the degree of order or disorder of the signal (Rosso et al., 2001). It has been a useful tool to analyze EEG signals, and given the difference of power spectrum within tremor and non-tremor states, we hypothesized that the associated wavelet entropy might be a useful feature for tremor detection.
2.3.7. Low and high beta power
The beta (13–30 Hz) power measured in the cortex and STN is reduced during resting tremor (Hirschmann et al., 2013; Qasim et al., 2016). Furthermore, the low beta (13–20 Hz) power significantly decreases in the on-state following the administration of apomorphine and levodopa (Priori et al., 2004). We included both low and high beta features in our study.
2.4. Correlation analysis
We used a biserial correlation coefficient (Müller et al., 2004) to quantify the correlation of each feature with the labeled tremor. This coefficient measures the ratio between the absolute difference of the group means (tremor and non-tremor) and the pooled standard deviation of the two classes. The maximum correlation coefficient of the three bipolar channels was used to represent the correlation of each feature with tremor.
2.5. Kalman filtering
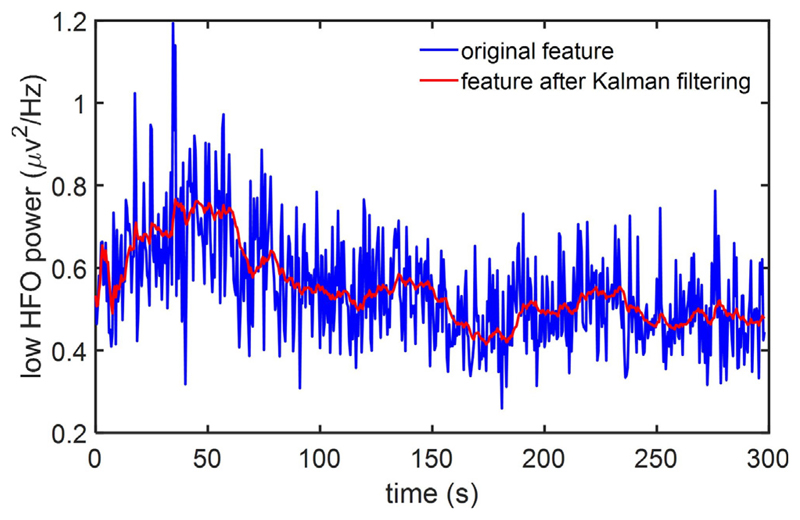
The Kalman filter has been extensively used to track the state of a system based on the model of its dynamics and noisy measurements over time. This approach minimizes the variance of the estimation error, thus effectively reducing the undesired fluctuations of the measured data (Zhang and Parhi, 2016; Chisci et al., 2010). In tremor detection for PD, the noisy fluctuations of the measured local field potentials and the associated features may degrade the tremor detection performance. As illustrated in Fig. 3, we applied a Kalman filter of second-order to reduce the noise in feature time series and obtain a smoothed feature following Kalman filter. We expected that this approach would lower the rate of false positive detections and improve the overall decoding performance. A brief summary of the filtering process (Chisci et al., 2010) is provided below.
Fig. 3.
Kalman filtering in feature space. The blue curve represents the original feature (low HFO power), while the red curve shows the corresponding feature following Kalman filtering.
Assuming that represents the state vector vk, where denotes the derivative of dk, the feature vector fk is described by the following state-space model:
| (1) |
where Tp shows the time interval of the prediction and wk represents the process disturbance, assumed to be a white noise of zero mean and covariance of:
| (2) |
The Kalman filter is applied to the model in (1) to recursively provide an estimate of dk. Next, the obtained smoothed variable is utilized in place of fk as input to our machine learning model. The standard deviations σw of wk and σu of uk are the required parameters for Kalman filtering, while the Kalman gain depends on σ = σw/σu, which is set to 5 × 10⁻⁵ in this design (Chisci et al., 2010; Zhang and Parhi, 2016).
2.6. Classification and performance assessment
In order to detect the tremor episodes from extracted features, we evaluated the performance of different machine learning models and performed a hyperparameter tuning of classifiers in a patient-specific manner to determine the optimal settings. These models include the commonly used classification algorithms such as logistic regression (LR), support vector machines based on linear or RBF kernels (SVM-L, SVM-R), linear discriminant analysis (LDA), multilayer perceptron (MLP), K-nearest neighbors (KNN), and more recent models such as extreme gradient-boosted trees (XGB) and random forest (RF). The decision tree ensembles (e.g., gradient boosting (Friedman, 2001) and random forest) have been among the winning classifiers in ML challenges in recent years, performing remarkably well on small training datasets (Shoaran et al., 2018; Zhu et al., 2019). We further examined the performance of ML algorithms that do not rely on handcrafted features or domain knowledge, such as convolutional neural network (CNN) (Zhu et al., 2019). We used a compact CNN previously employed for EEG classification (Lawhern et al., 2018). The CNN model was implemented using the AlexNet architecture of TensorFlow, with three convolutional layers, three average pooling layers, and a softmax output layer. During model training, a 32-samples input batch was fed to the CNN in each iteration and the weights were updated by backpropagation. Multiple iterations were conducted until a stable cross-validation score was obtained.
Here, all the features described in Table 1 were used for classification. We used a block-wise approach to partition the LFP recordings into training and test sets and to minimize the risk of data leakage. Each recording was first divided into twenty blocks of equal size. A five-fold cross-validation (CV) was subsequently applied, i.e., in each round, 80% of the LFP blocks were used to train the model and the rest to validate the performance. The results of five rounds were then averaged to assess the overall predictive performance. Given the unbalanced distribution of tremor/non-tremor episodes in our dataset, we measured the performance of classifiers by F1 score, sensitivity, and specificity, rather than accuracy. The F1 score is defined as indicating the harmonic mean of the sensitivity and precision. It ranges from 0 to 1 with higher values representing better performance (precision is the fraction of true positive detections to the total positive detections returned by the classifier).
2.7. Feature importance
Following model selection, we evaluated the predictive performance of features for the top performing classifier (XGB, as later shown in Section 3.2) to assess the relative feature importance and potentially reduce the feature computation overhead. Here, a sequential feature selection (SFS) method was utilized (Jain and Zongker, 1997; Zhu et al., 2019). The algorithm first evaluates all single-feature subsets to find the most predictive biomarker. In each subsequent iteration, the performance of the previous subset combined with a new element from the remaining feature set is investigated to find the next “best feature”, using F1 score measured by 5-fold CV (Zhu et al., 2019). The algorithm continues to successively add new features and update the subset until all features are analyzed.
2.8. Detection latency
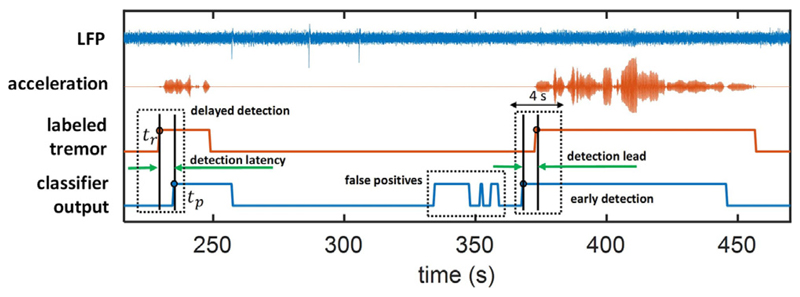
In addition to detection rate, the timing of stimulation in adaptive DBS is also critical for modulation to be effective, and to be used as a reliable alternative for conventional DBS. In this work, the latency in tremor detection is measured with reference to the labeled tremor onset, showing how early ahead (or late) a detection is raised by the model. To measure the latency of classifiers, we define tr as the onset of tremor based on the labeled acceleration with the following conditions: (1) the state changes from non-tremor to tremor at tr; (2) the next consecutive state starting at tr + w/2 is also labeled as tremor, where w represents the window size and w/2is the overlap. Similarly, we define tp as the predicted onset of tremor based on the output of classifier, with the following two criteria: (1) the predicted state changes from non-tremor to tremor at tp; (2) the subsequent state starting at tp + w/2 is predicted as tremor. Then, the latency is calculated by tp − tr based on the nearest prediction within a range of 4 s around tr, as shown in Fig. 4.
Fig. 4.
Latency calculation in an example patient. The time difference between the onset of classifier output (tp) and the onset of labeled tremor (tr) is defined as detection latency.
In the current dataset, some patients exhibit continuous tremor-like activity, lacking a clear transition from the non-tremor to tremor state. For latency analysis, we chose those patients who had at least one clear tremor onset (tr) and one correctly detected tremor onset (tp) as described above. With this condition, 7 patients (9 recordings) were included in our latency analysis. The average detection latency of individual patients is used to quantify the overall latency.
2.9. Statistical analysis
We used a one-way repeated measures ANOVA to compare the correlation coefficient among biomarkers (15 levels corresponding to the features in Table. 1), to compare the F1 score for different channel configurations (3 levels: monopolar, bipolar between adjacent channels [0–1,1–2,2–3], and bipolar [0–2,1–3]), and to compare the F1 score for different window sizes and overlapping (6 levels: 2 s without overlap, 2 s with half overlap, 1 s without overlap, 1 s with half overlap, 0.5 s without overlap, and 0.5 s with half overlap). In addition, a two-way ANOVA with repeated measures was applied to study the impact of Kalman filtering (2 levels: with and without Kalman filter) and classifiers (8 levels: LDA, LR, KNN, SVM-L, SVM-R, MLP, RF, and XGB) on the classification performance. We used the IBM SPSS Statistics Version 22 for the statistical analyses presented here. Mauchly’s test for sphericity was performed for repeated measures and in cases where the sphericity assumption was violated, the results were Greenhouse-Geisser corrected. Multiple comparisons with Bonferroni correction were used for post-hoc comparison when the main effect was significant (p < 0.05).
3. Results
3.1. STNr LFP biomarkers for quantifying resting tremor
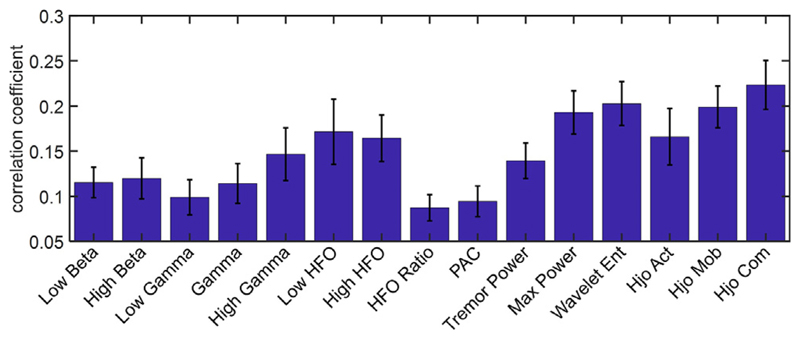
Fig. 5 depicts the correlation coefficient of each feature with tremor. The one-way ANOVA with repeated measures showed a significant difference in the examined electrophysiological biomarkers (Greenhouse-Geisser corrected F (5.0,75.0) = 6.4, p < 0.0001), and the Hjorth complexity exhibited a higher correlation with tremor compared to other features. No significant difference was observed between low beta vs. high beta (p = 0.72), neither between low and high HFO (p = 0.84), in our dataset.
Fig. 5.
Correlation coefficients of features with tremor. For each feature, the channel with the maximum correlation coefficient has been used. The error bars indicate the standard error.
3.2. Kalman filtering to enhance the specificity
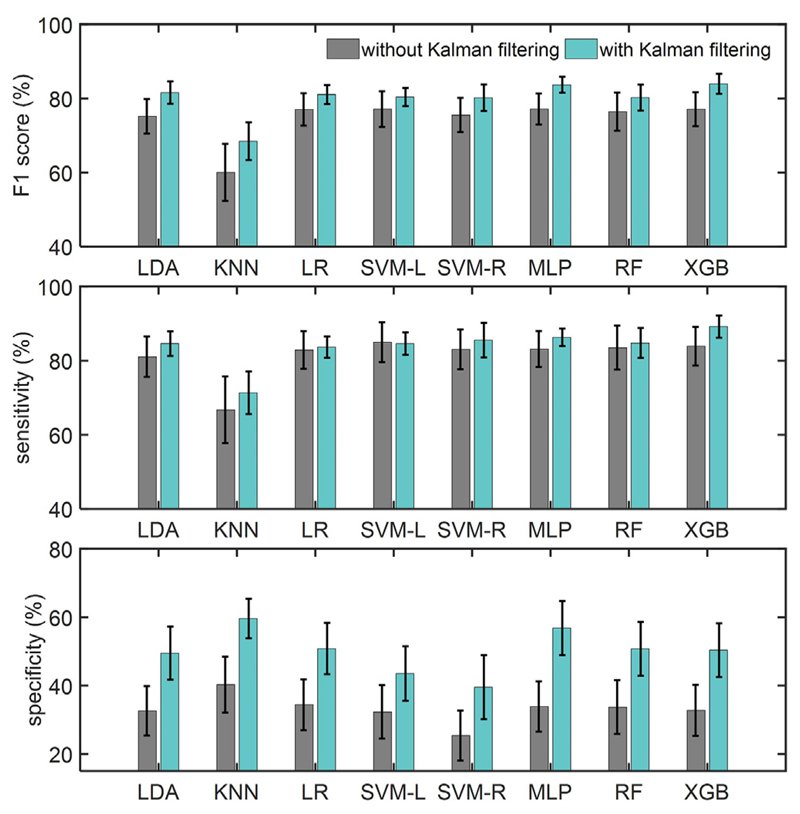
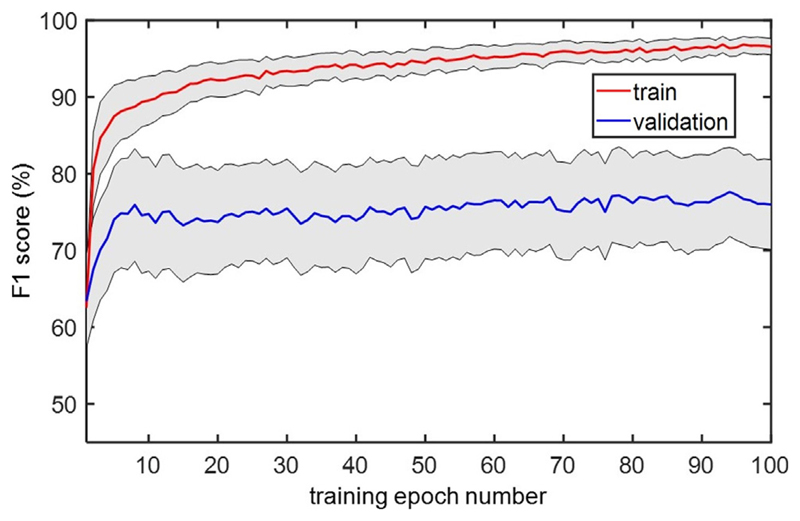
Fig. 6 compares the classification performance of different ML models using the feature set in Table 1, and the effect of Kalman filtering. For F1 score, a two-way repeated measures ANOVA showed a marginal effect of Kalman filter (F (1,15) = 4.19, p = 0.058) and a significant effect of classifiers (Greenhouse-Geisser corrected F (1.3,18.8) = 5.37, p = 0.026) with no interaction. For the sensitivity measure, the classifiers showed a significant main effect (Greenhouse-Geisser corrected F (1.4,20.4) = 5.02, p = 0.027), while all classifiers except KNN showed comparable performance. For the specificity measure, the two-way repeated measures ANOVA showed a significant main effect of Kalman filter (F (1,15) = 14.62, p = 0.002) and of ML models (Greenhouse-Geisser corrected F (2.7,40.8) = 3.83, p = 0.019) with no interaction. Moreover, the Kalman filtering resulted in a 17.0% higher specificity compared to the cases without Kalman filtering. The XGB classifier obtained the highest F1 score (84.0% ± 10.8%) and sensitivity (89.2% ± 12.0%), while KNN achieved the highest specificity (59.6% ± 23.1%) on this dataset. The tremor detection performance for each recording based on the XGB model is shown in Table 2. The CNN classifier obtained an F1 score of 77.1% ± 18.3%, sensitivity of 81.7% ± 20.1%, and specificity of 37.8% ± 30.1%. Fig. 7 depicts the performance of CNN while increasing the number of training epochs to the network. On average, the performance reached its maximum value after 10 training epochs.
Fig. 6.
Performance of different classifiers in tremor detection, with and without Kalman filtering. The performance is measured by F1 score, sensitivity, and specificity. The error bar indicates the standard error.
Table 2. Tremor detection performance for each recording using the XGB classifier. Here, K and N denote the performance with and without Kalman filtering.
| Recording index | F1 Score (%) |
Sensitivity (%) |
Specificity (%) |
|||
|---|---|---|---|---|---|---|
| N | K | N | K | N | K | |
| 1 | 88.7 | 84.9 | 98.5 | 88.6 | 5.6 | 28.5 |
| 2 | 68.9 | 78.1 | 70.0 | 80.8 | 69.4 | 74.9 |
| 3 | 39.6 | 69.0 | 43.7 | 70.9 | 72.1 | 82.3 |
| 4 | 96.3 | 98.6 | 99.6 | 100.0 | 32.5 | 82.5 |
| 5 | 36.8 | 63.0 | 33.7 | 63.7 | 70.4 | 79.7 |
| 6 | 81.6 | 84.0 | 94.8 | 93.0 | 9.5 | 34.6 |
| 7 | 70.8 | 76.2 | 73.3 | 80.4 | 75.4 | 76.2 |
| 8 | 92.5 | 92.4 | 100.0 | 99.9 | 0.0 | 0.5 |
| 9 | 90.9 | 98.0 | 98.8 | 98.8 | 4.0 | 66.9 |
| 10 | 70.4 | 71.4 | 76.7 | 77.5 | 52.3 | 65.3 |
| 11 | 81.5 | 91.0 | 88.0 | 96.0 | 30.3 | 69.7 |
| 12 | 65.4 | 75.8 | 73.4 | 80.6 | 64.4 | 77.1 |
| 13 | 95.1 | 95.1 | 100.0 | 100.0 | 0.0 | 0.0 |
| 14 | 92.3 | 92.3 | 100.0 | 100.0 | 0.0 | 0.0 |
| 15 | 73.4 | 84.0 | 96.5 | 100.0 | 11.4 | 43.6 |
| 16 | 89.1 | 89.7 | 95.7 | 97.2 | 26.5 | 24.5 |
| Mean | 77.1 ± 18.3 | 84.0 ± 10.8 | 83.9 ± 20.8 | 89.2 ± 12.0 | 32.7 ± 29.8 | 50.4 ± 31.4 |
Fig. 7.
Performance of compact CNN on the training and validation sets across consecutive training epochs. The gray area indicates the standard error across patients.
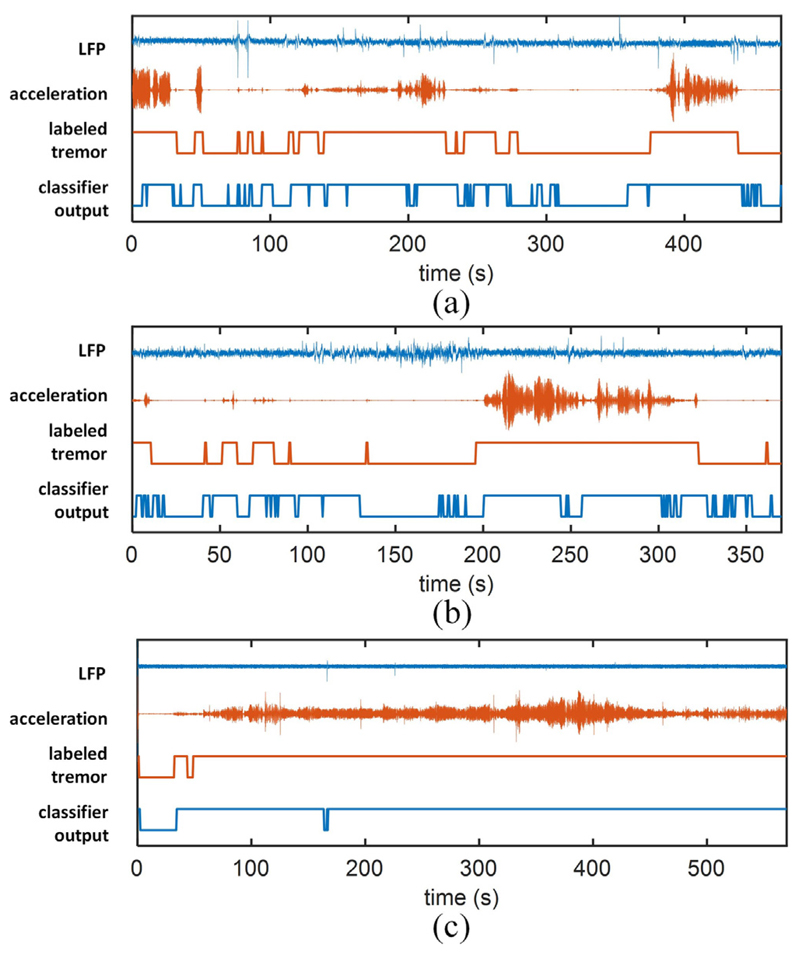
Using Kalman filter and XGB, the simulated classification results for three representative LFP recordings are illustrated in Fig. 8, showing a reasonable detection of tremor state. Specifically, for patients with prolonged episodes of weak or strong tremor (Fig. 8(a)), the proposed method can reliably detect the presence of tremor in the majority of cases. Our approach was also effective on recordings with a single prolonged tremor (Fig. 8(b)) while raising a number of false positives for small motions during the non-tremor state. Finally, for recordings with a high tremor prevalence (Fig. 8(c)), the algorithm could reliably detect the tremor episode.
Fig. 8.
Examples of tremor detection on three sample LFP recordings. The bipolar LFP, measured acceleration, labeled tremor, and classifier output are shown. The binary output of XGB classifier that is built upon LFP features successfully tracks the episodes of tremor.
3.3. Other design parameters
In addition to the type of classifier and features, the other parameters that may affect the classification performance include the window size, sampling rate, and channel configuration, which are discussed in the following. We further investigated the optimal number of features that led to the highest classification performance. For the following analysis, we use XGB combined with Kalman filter, as it showed a superior performance in tremor detection.
3.3.1. Window size and overlapping
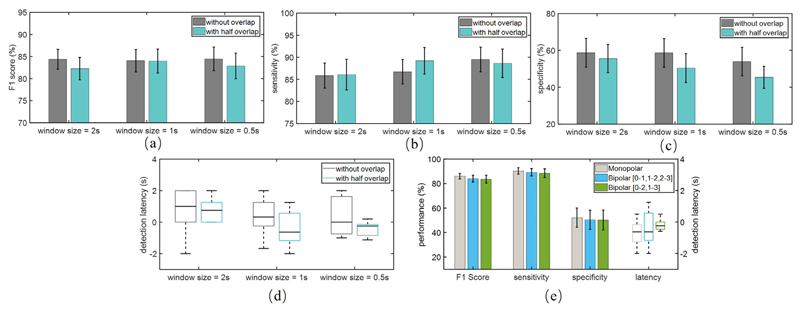
The classification performance and latency for different window lengths and overlaps are depicted in Fig. 9(a)-(d). Here, we observed a nearly similar performance in terms of F1 score (Greenhouse-Geisser corrected F (2.7,39.7) = 0.43, p = 0.71). As expected, shorter windows and the use of overlapping improved the detection latency. Overall, the 1-second window with half overlapping achieved a reasonable trade-off between detection performance and latency.
Fig. 9.
Performance for different window sizes and overlaps; (a) F1 score, (b) sensitivity, (c) specificity, and (d) latency; (e) Performance for monopolar and bipolar configurations with a 1-s window and half overlap, and the boxplot of the corresponding latency on the right axis.
3.3.2. Bipolar and monopolar channel configurations
The performance and detection latency for the monopolar and two bipolar configurations using a 1-second window and half overlapping are shown in Fig. 9(e). The one-way ANOVA with repeated measures showed no significant difference in terms of F1 score (Greenhouse-Geisser corrected F (1.5,22.3) = 1.74, p = 0.20) among the three configurations. Moreover, by only using the 0–2 or 1–3 bipolar channel for classification, no significant deterioration in performance was observed. The monopolar configuration led to a lower detection latency, but it was not significant. Considering that in practice, a bipolar configuration would limit the impact of stimulation artifact by canceling it as a common-mode input, we opted to use the bipolar method in this work.
3.3.3. Sampling rate
Although we used a high sampling rate (2048 Hz) to capture the high-frequency content in LFPs, this may increase the hardware complexity and power dissipation of the processing circuitry. To study the effect of sampling rate, we reduced the date rate to 512 Hz and excluded the HFO-based features (low HFO, high HFO, HFO ratio, PAC) from our analysis. We observed that the performance slightly degraded at lower sampling rates (F1 score of 84.0% ± 11.2%, sensitivity of 88.6% ± 13.3%, and specificity of 49.5% ± 35.0%).
3.3.4. Optimal number of biomarkers
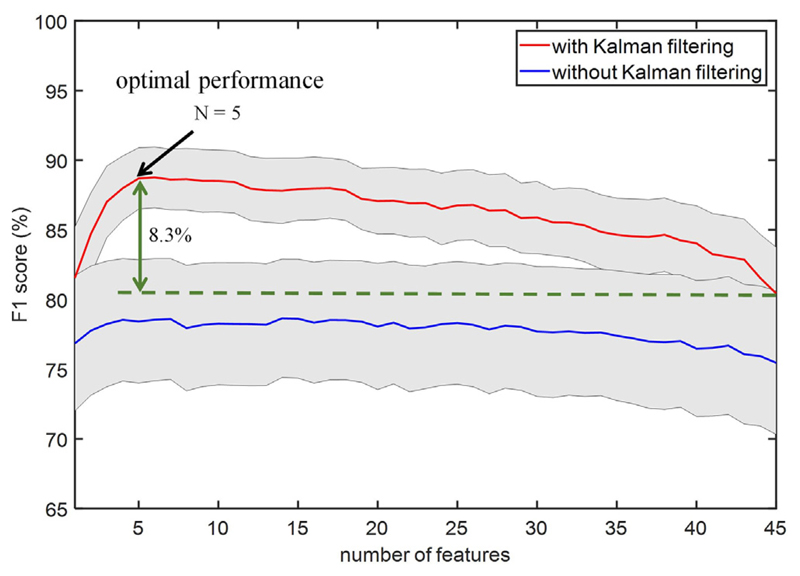
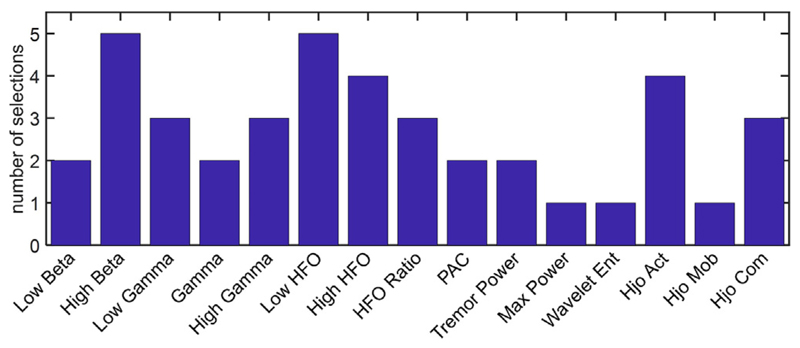
In order to reduce the feature count and assess the importance of different biomarkers in the overall classification performance, the number of input features to the XGB model was successively increased based on the SFS method, as depicted in Fig. 10. We observed that performance can be further improved by optimally selecting as low as only five features or less, from each patient. For equal number of features, the F1 score with Kalman filtering was generally higher than the case without Kalman filter. This figure shows that the average F1 score for the XGB model can reach 88.7% ± 8.5%, which is 8.3% higher compared to using all 45 features. The detection latency for this optimal setting was −0.52 ± 1.14 s (i.e., detection lead of 0.52 ± 1.14 s). The most discriminative features using the SFS method and XGB classifier are outlined in Table 3 for each LFP recording. The stopping criterion is when adding a new feature improves the F1 score by less than 1%, with a maximum of 5 features selected in each case. With this process, the distribution of selected features for the patients in our dataset is shown in Fig. 11, in which the high beta, low HFO, high HFO, and Hjorth parameters are among the most commonly selected features. While the correlation analysis did not show any significant difference between the low and high beta features, the latter is more frequently selected as an important feature for tremor detection in this study.
Fig. 10.
The grand-averaged classification performance with respect to number of features using the sequential feature selection method. The arrow shows the setting that leads to the highest performance on average, using the same XGB model for all patients. The gray area indicates the standard error across patients.
Table 3. The top performing features with XGB model.
| Recording index | Most discriminative features |
|---|---|
| 1 | High Beta |
| 2 | High Gamma, Low Beta, Hjo Com |
| 3 | High Beta, Gamma, Hjo Act, Low Beta |
| 4 | High Gamma |
| 5 | Tremor Power, High Beta, HFO Ratio, Max Power, Wavelet Ent |
| 6 | Hjo Com, HFO Ratio, High HFO |
| 7 | HFO Ratio, Wavelet Ent, Low Gamma, Hjo Com, High HFO |
| 8 | Hjo Mob |
| 9 | Low Beta |
| 10 | Gamma, High HFO, HFO Ratio |
| 11 | High Gamma, HFO Ratio, Hjo Com |
| 12 | High HFO, PAC, Low HFO, Tremor Power |
| 13 | Hjo Act |
| 14 | High Gamma, Gamma |
| 15 | Gamma, Low Beta, High HFO |
| 16 | Gamma |
Hjo = Hjorth, Act = Activity, Mob = Mobility, Com = Complexity.
Fig. 11.
Distribution of the number of times a feature is selected across patients. A subject-specific number of features is used for each patient (min 1, max 5). Features selected from more than one channel in a patient are counted as one.
4. Discussion
In this work, we systematically analyzed the neurophysiological biomarkers in the STNr LFP in a machine learning framework, with the goal of accurately detecting resting tremor in PD. To the best of our knowledge, this is the first use of Kalman filtering as a post feature processing approach to enhance tremor detection performance. The Kalman filtering had a significant impact on specificity for all the studied classifiers. The enhancement of specificity is critical to limit the number of false positive detections and thereby to minimize DBS power consumption and side effects.
4.1. The choice of feedback signal
To detect the onset of tremor from local field potentials, we need to properly identify and label tremor episodes for model training. Here, we placed a peripheral accelerometer sensor on patients’ hands to measure their tremor intensity. Then, we adopted a thresholding method to separate the tremor and non-tremor periods, similar to the methods used elsewhere (Bakstein et al., 2012; Houston et al., 2015; Hirschmann et al., 2017). As an alternative feedback signal, the tremor severity measured by peripheral sensors or surface EMG could be used to control DBS. For example, the peripheral measurements of the tremulous limb have been utilized to guide the stimulation and suppress tremor (Malekmohammadi et al., 2016; Cagnan et al., 2016). However, this approach may impose an additional requirement on patient compliance (Arlotti et al., 2016a; Hirschmann et al., 2017), as well as security concerns for wireless telemetry between the implant and the wearable sensor. To implement adaptive DBS, the combination of informative biomarkers based on neuronal activity (e.g., STN LFPs or ECoG in motor cortex (Swann et al., 2018)) may be preferred as they directly reflect brain activities that may underlie symptoms (Meidahl et al., 2017; Arlotti et al., 2016a). For example, the cortical narrow gamma (60–90 Hz) oscillations pertaining to dyskinesia have been used to control DBS (Swann et al., 2018), while reducing energy consumption by 38% to 45% and maintaining therapeutic efficacy. Ideally, a combination of both depth and cortical biomarkers may provide a more precise and/or reliable approach for the closed-loop control of DBS and enable the targeting of multiple PD symptoms (Arlotti et al., 2016a). For instance, cortical biomarkers could be used in place of the low-amplitude STN HFOs that are difficult to detect in the presence of stimulation artifact (Meidahl et al., 2017), while these sensitive STN biomarkers could accurately detect the onset of tremor (as shown in this work) and activate DBS in the first place. The advantage of our proposed framework is that a handful of most relevant biomarkers can be selected in a patient-specific manner and combined with powerful classification algorithms, without the need to prioritize and threshold a single depth or cortical biomarker that could, in turn, sacrifice the efficacy or energy efficiency of the adaptive DBS.
In addition to detection performance, the physical and practical constraints of the system should be carefully considered when choosing the feedback signal for aDBS, such as the need for additional implants, any required changes in the surgical procedure, and patient comfort and compliance (Arlotti et al., 2016a). Our current study is based on LFPs in STNr, with the advantage that no additional implant is needed and no change in the standard surgical procedure for DBS. Moreover, the multiple biomarkers extracted from the LFP may allow for the better personalization and adaptability of therapy to account for inter-subject variability.
4.2. Features, classifiers, and Kalman filter
Multiple LFP biomarkers and a feedforward neural network were previously used for resting tremor detection (Bakstein et al., 2012), achieving a classification accuracy of over 86% in 4 out of 8 patients. However, due to the unbalanced duration of tremor/non-tremor episodes in most patients, the classification accuracy may not be appropriate for quantifying the performance. In the current study, we further demonstrated the possibility of successful tremor detection on 12 patients with diverse tremor characteristics and durations, using relevant biomarkers in the STNr LFP, state-of-the-art ML models, and Kalman filtering. If we instead apply a median threshold to beta power only, similar to most prior studies, the F1 score, sensitivity and specificity dropped to 49.6% ± 9.9%, 44.7% ± 9.0% and 47.3% ± 24.04%, respectively. Moreover, using the HMM model (Hirschmann et al., 2017) on our feature set, we obtained an F1 score of 56.3% ± 15.5%, sensitivity of 48.2% ± 16.4% and specificity of 55.5% ± 23.6%, while Kalman filter is not effective in this case. The CNN model with embedded feature learning led to an F1 score of 77.1% ± 18.3%, sensitivity of 81.7% ± 20.1%, and specificity of 37.8% ± 30.1%. Therefore, our feature-engineered approach showed a superior performance in the current dataset. In general, while deep learning models obtain an outstanding performance on large and unstructured datasets such as provided by imaging, they may not be optimal for problems with limited training data (Zhu et al., 2019).
In this work, we used the Hjorth parameters for tremor analysis in PD (Shah et al., 2018). Interestingly, the Hjorth complexity, which is a measure of the change in frequency, showed a higher correlation with tremor compared to other features. The underlying neurophysiological mechanism that contributes to the correlation of Hjorth complexity with tremor may be worth further study. The use of Kalman filter in feature space was motivated by prior studies on epileptic seizure detection (Zhang and Parhi, 2016) and emotion classification from EEG (Zheng et al., 2017). In this work, the Kalman filter improved the tremor detection performance of different classifiers, by reducing the noisy fluctuations of the features. Due to the inherent noise in the neural system and the corresponding LFP recordings, a second-order Kalman filter provided a suitable way to model this noisy activity, thereby successfully tracking the tremor state. The Kalman filter offers the potential benefit of enhancing the detection specificity without degrading the sensitivity of the classifier, thus improving the energy efficiency in aDBS. Furthermore, we tested the potential use of Kalman filter after classification, which proved to be less effective compared to filtering in feature space for tremor detection.
The classification results in Fig. 8 show that our algorithm performs well on typical patients that have sustained tremor periods. For patients with shorter tremor episodes, our algorithm raises a number of false positives. In this work, we used Kalman filtering to lower the number of false positives and achieved 17% improvement in specificity on average. The other potential approach to limit the false positive rate is to increase the number of successive detections required to define tremor, e.g., by defining tremor onset after three positive detections. Although we have largely improved specificity by the use of Kalman filtering, this is still a remaining challenge for adaptive DBS and needs to be addressed in future work.
4.3. Channel configuration
Considering that in a closed-loop approach, the DBS electrodes would be used for both sensing the neural activity and stimulation, this would unavoidably cause a strong stimulation artifact at the recording site. The bipolar configuration provides a way to reduce this effect, by partially canceling the common-mode artifact component. In this work, we compared the classification performance of monopolar and two bipolar configurations, and no significant difference was found in the absence of stimulation. Our analysis showed that a single bipolar combination (0–2 or 1–3) leads to a comparable performance, which could further reduce hardware complexity. To minimize the potential impact of stimulation artifact on the classifier performance, we also tested our algorithm by excluding the high-gamma feature (100–200 Hz), and the results showed no significant decline in performance. More advanced circuit techniques will be explored to suppress the artifact both at the input of amplifiers and digitally in the back-end, in order to enable a robust implementation of adaptive DBS in future.
4.4. Limitations and future work
In the current approach for labeling the data, we visually identified a low-activity time period as baseline. Then, a threshold was empirically set by calculating the average and standard deviation for the baseline. However, we had to slightly adjust the threshold in some patients to avoid the abrupt transitions in labels due to noise or artifact in the acceleration signal. Alternatively, the accelerometer could be combined with other methods such as video recording and EMG sensing in order to more reliably define and label the tremor episodes for model training.
It has been previously shown that amplitude-responsive aDBS decreases the total energy delivered to the tissue by ~130 mW per side, while the energy dissipated by a single-channel power classifier is of the order of 10 mW (Little et al., 2013). Through system-on-chip integration in modern CMOS technologies, power dissipation in the range of sub-microwatt per channel has recently been reported for epileptic seizure detection (Shoaran et al., 2016), and a very low energy of 41.2nJ/class for computing 12 features with an XGB classifier (Shoaran et al., 2018). Moreover, while a high voltage compliance is required for stimulation, recording can be reliably done at a lower supply voltage. Considering that sensing, feature computation, and classification could be performed with low energy, aDBS could potentially save total battery usage, in addition to the saving in energy delivered to the tissue through stimulation (and thereby the reduction in side-effects). The actual computational overhead and energy consumption for the proposed algorithm needs to be investigated and compared with the potential saving in stimulation energy. An optimal sampling rate that enables a good trade-off between detection accuracy and energy should be further explored. Moreover, the performance in this study was evaluated offline, while an online evaluation of the proposed approach should be performed to further validate its efficacy in real-time and during closed-loop operation. The effect of stimulation artifact on the tremor detection circuitry should be studied in order to efficiently integrate this method into the DBS system.
Efficient integration of multiple biomarkers and advanced control algorithms could potentially improve the therapeutic efficacy of aDBS (Arlotti et al., 2016a; Beudel and Brown, 2016). Although aDBS has mostly been realized using external devices this is not exclusively the case. Medtronic’s implantable research system, the Activa PC + S, has been used for neural recording and stimulation in essential tremor and PD, and for acute trials of aDBS in Parkinson’s (Velisar et al., 2019). The investigational Summit RC + S (Medtronic) embeds basic spectral analysis algorithms and an LDA classifier. The design of a low-power and miniaturized ASIC with integration of sensing, optimal biomarker extraction, advanced classification, and stimulation could enable high quality, low-noise recording and more effective intervention, and remains a future goal. Also, while the use of multiple biomarkers may account for inter-subject variability, more research is required to translate this approach into an effective personalized therapy.
Here, as a proof-of-concept, we demonstrated our approach in the form of a binary classifier that could activate an on-demand stimulator. However, it is also possible to use this framework in a truly adaptive manner, by predicting the tremor strength using a regressor or a multi-class machine learning method to adaptively control the stimulation amplitude. Finally, we limited our analyses to Parkinsonian rest tremor, and the confounding effects, if any, of voluntary movement remain to be investigated, as does the detection of Parkinsonian action or postural tremor.
5. Conclusion
In this work, we evaluated a number of neurophysiological biomarkers in the LFP signal from the STNr, and various classification algorithms to detect resting tremor episodes in Parkinson’s disease. By combining a powerful machine learning model with relevant patient-specific features in the LFP, and using Kalman filtering, we achieved an average F1 score of 88.7% and detection lead of 0.52 s. This work demonstrates the potential use of a more accurate ML-based approach for resting tremor detection and adaptive DBS control in Parkinson’s disease.
Highlights.
Multiple features of local field potentials in subthalamic nucleus were investigated to detect resting tremor in Parkinson’s disease.
The use of relevant features, machine learning, and Kalman filter improves the tremor detection performance.
The Kalman filter in feature space significantly improves the specificity of detection by 17%.
Acknowledgement
We thank Bingzhao Zhu at Cornell University for his contribution to feature importance analysis and valuable comments.
Footnotes
Declaration of Competing Interest
None.
References
- Arlotti M, Marceglia S, Foffani G, Volkmann J, Lozano AM, Moro E, et al. Eight-hours adaptive deep brain stimulation in patients with Parkinson disease. Neurology. 2018;90:e971–6. doi: 10.1212/WNL.0000000000005121. [DOI] [PMC free article] [PubMed] [Google Scholar]
- Arlotti M, Rosa M, Marceglia S, Barbieri S, Priori A. The adaptive deep brain stimulation challenge. Park Relat Disord. 2016a;28:12–7. doi: 10.1016/j.parkreldis.2016.03.020. [DOI] [PubMed] [Google Scholar]
- Arlotti M, Rossi L, Rosa M, Marceglia S, Priori A. An external portable device for adaptive deep brain stimulation (aDBS) clinical research in advanced Parkinson’s Disease. Med Eng Phys. 2016b;38:498–505. doi: 10.1016/j.medengphy.2016.02.007. [DOI] [PubMed] [Google Scholar]
- Bakstein E, Burgess J, Warwick K, Ruiz V, Aziz T, Stein J. Parkinsonian tremor identification with multiple local field potential feature classification. J Neurosci Methods. 2012;209:320–30. doi: 10.1016/j.jneumeth.2012.06.027. [DOI] [PubMed] [Google Scholar]
- Beudel M, Brown P. Adaptive deep brain stimulation in Parkinson’s disease. Parkinsonism Relat Disord. 2016;22:S123–6. doi: 10.1016/j.parkreldis.2015.09.028. [DOI] [PMC free article] [PubMed] [Google Scholar]
- Brown P. Oscillatory nature of human basal ganglia activity: relationship to the pathophysiology of Parkinson’s disease. Mov Disord. 2003;18:357–63. doi: 10.1002/mds.10358. [DOI] [PubMed] [Google Scholar]
- Burgess JG, Warwick K, Ruiz V, Gasson MN, Aziz TZ, Brittain JS, et al. Identifying tremor-related characteristics of basal ganglia nuclei during movement in the Parkinsonian patient. Park Relat Disord. 2010;16:671–5. doi: 10.1016/j.parkreldis.2010.08.025. [DOI] [PubMed] [Google Scholar]
- Cagnan H, Pedrosa D, Little S, Pogosyan A, Cheeran B, Zrinzo L, et al. Stimulating at the right time : phase-specific deep brain stimulation Stimulating at the right time : phase-specific deep brain stimulation. Brain. 2016;140:132–45. doi: 10.1093/brain/aww286. [DOI] [PMC free article] [PubMed] [Google Scholar]
- Chen T, He T. Xgboost: eXtreme Gradient Boosting. R package version. 2015(4–2):1–4. [Google Scholar]
- Chisci L, Mavino A, Perferi G, Sciandrone M, Anile C, Colicchio G, et al. Real-time epileptic seizure prediction using AR models and support vector machines. IEEE Trans Biomed Eng. 2010;57:1124–32. doi: 10.1109/TBME.2009.2038990. [DOI] [PubMed] [Google Scholar]
- Foffani G, Priori A, Egidi M, Rampini P, Tamma F, Caputo E, et al. 300-Hz subthalamic oscillations in Parkinson’s disease. Brain. 2003;126:2153–63. doi: 10.1093/brain/awg229. [DOI] [PubMed] [Google Scholar]
- Foltynie T, Hariz MI. Surgical management of Parkinson’s disease. Expert Rev Neurother. 2010;10(6):903–14. doi: 10.1586/ern.10.68. [DOI] [PubMed] [Google Scholar]
- Friedman JH. Greedy function approximation: A gradient boosting machine. Ann Stat. 2001;29:1189–232. [Google Scholar]
- Glaser JI, Chowdhury RH, Perich MG, Miller LE, Kording KP. Machine learning for neural decoding. arXiv Prepr arXiv1708.00909. 2017 doi: 10.1523/ENEURO.0506-19.2020. [DOI] [PMC free article] [PubMed] [Google Scholar]
- Hirschmann J, Butz M, Hartmann CJ, Hoogenboom N, Özkurt TE, Vesper J, et al. Parkinsonian rest tremor is associated with modulations of subthalamic high-frequency oscillations. Mov Disord. 2016;31:1551–9. doi: 10.1002/mds.26663. [DOI] [PubMed] [Google Scholar]
- Hirschmann J, Hartmann CJ, Butz M, Hoogenboom N, Özkurt TE, Elben S, et al. A direct relationship between oscillatory subthalamic nucleus-cortex coupling and rest tremor in Parkinson’s disease. Brain. 2013;136:3659–70. doi: 10.1093/brain/awt271. [DOI] [PubMed] [Google Scholar]
- Hirschmann J, Schoffelen JM, Schnitzler A, van Gerven MAJ. Parkinsonian rest tremor can be detected accurately based on neuronal oscillations recorded from the subthalamic nucleus. Clin Neurophysiol. 2017;128:2029–36. doi: 10.1016/j.clinph.2017.07.419. [DOI] [PubMed] [Google Scholar]
- Hjorth B. EEG analysis based on time domain properties. Electroencephalogr Clin Neurophysiol. 1970;29:306–10. doi: 10.1016/0013-4694(70)90143-4. [DOI] [PubMed] [Google Scholar]
- Houston B, Blumenfeld Z, Quinn E, Bronte-Stewart H, Chizeck H. Long-term detection of Parkinsonian tremor activity from subthalamic nucleus local field potentials. Engineering in Medicine and Biology Society (EMBC); 37th Annual International Conference of the IEEE; 2015. pp. 3427–31. [DOI] [PubMed] [Google Scholar]
- Jain A, Zongker D. Feature selection: Evaluation, application, and small sample performance. IEEE Trans Pattern Anal Mach Intell. 1997;19:153–8. [Google Scholar]
- Lawhern V, Solon A, Waytowich N, Gordon SM, Hung C, Lance BJ. EEGNet: a compact convolutional neural network for EEG-based brain-computer interfaces. J Neural Eng. 2018;15 doi: 10.1088/1741-2552/aace8c. 056013. [DOI] [PubMed] [Google Scholar]
- Little S, Beudel M, Zrinzo L, Foltynie T, Limousin P, Hariz M, et al. Bilateral adaptive deep brain stimulation is effective in Parkinson’s disease. J Neurol Neurosurg Psychiatry. 2016a;87:717–21. doi: 10.1136/jnnp-2015-310972. [DOI] [PMC free article] [PubMed] [Google Scholar]
- Little S, Pogosyan A, Neal S, Zavala B, Zrinzo L, Hariz M, et al. Adaptive deep brain stimulation in advanced Parkinson disease. Ann Neurol. 2013;74:449–57. doi: 10.1002/ana.23951. [DOI] [PMC free article] [PubMed] [Google Scholar]
- Little S, Tripoliti E, Beudel M, Pogosyan A, Cagnan H, Herz D, et al. Adaptive deep brain stimulation for Parkinson’s disease demonstrates reduced speech side effects compared to conventional stimulation in the acute setting. J Neurol Neurosurg Psychiatry. 2016b;87:1388–9. doi: 10.1136/jnnp-2016-313518. [DOI] [PMC free article] [PubMed] [Google Scholar]
- López-Azcárate J, Tainta M, Rodriguez-Oroz MC, Valencia M, González R, Guridi J, et al. Coupling between beta and high-frequency activity in the human subthalamic nucleus may be a pathophysiological mechanism in Parkinson’s disease. J Neurosci. 2010;30:6667–77. doi: 10.1523/JNEUROSCI.5459-09.2010. [DOI] [PMC free article] [PubMed] [Google Scholar]
- Malekmohammadi M, Herron J, Velisar A, Blumenfeld Z, Trager MH, Chizeck HJ, et al. Kinematic A daptive D eep B rain S timulation for R esting T remor in P arkinson’s D isease. Mov Disord. 2016;31:426–8. doi: 10.1002/mds.26482. [DOI] [PubMed] [Google Scholar]
- Meidahl AC, Tinkhauser G, Herz DM, Cagnan H, Debarros J, Brown P. Adaptive deep brain stimulation for movement disorders: the long road to clinical therapy. Mov Disord. 2017;32:810–9. doi: 10.1002/mds.27022. [DOI] [PMC free article] [PubMed] [Google Scholar]
- Müller K-R, Krauledat M, Dornhege G, Curio G, Blankertz B. Machine learning techniques for brain-computer interfaces. Biomed Technik. 2004;49:11–22. [Google Scholar]
- Priori A, Foffani G, Pesenti A, Tamma F, Bianchi AM, Pellegrini M, et al. Rhythm-specific pharmacological modulation of subthalamic activity in Parkinson’s disease. Exp Neurol. 2004;189:369–79. doi: 10.1016/j.expneurol.2004.06.001. [DOI] [PubMed] [Google Scholar]
- Priori A, Foffani G, Rossi L, Marceglia S. Adaptive deep brain stimulation (aDBS) controlled by local field potential oscillations. Exp Neurol. 2013;245:77–86. doi: 10.1016/j.expneurol.2012.09.013. [DOI] [PubMed] [Google Scholar]
- Qasim SE, de Hemptinne C, Swann NC, Miocinovic S, Ostrem JL, Starr PA. Electrocorticography reveals beta desynchronization in the basal ganglia-cortical loop during rest tremor in Parkinson’s disease. Neurobiol Dis. 2016;86:177–86. doi: 10.1016/j.nbd.2015.11.023. [DOI] [PMC free article] [PubMed] [Google Scholar]
- Ray S, Crone NE, Niebur E, Franaszczuk PJ, Hsiao SS. Neural correlates of high-gamma oscillations (60-200 Hz) in macaque local field potentials and their potential implications in electrocorticography. J Neurosci. 2008;28:11526–36. doi: 10.1523/JNEUROSCI.2848-08.2008. [DOI] [PMC free article] [PubMed] [Google Scholar]
- Rosa M, Arlotti M, Ardolino G, Cogiamanian F, Marceglia S, Di Fonzo A, et al. Adaptive deep brain stimulation in a freely moving parkinsonian patient. Mov Disord. 2015;30:1003–5. doi: 10.1002/mds.26241. [DOI] [PMC free article] [PubMed] [Google Scholar]
- Rosso OA, Blanco S, Yordanova J, Kolev V, Figliola A, Schürmann M, et al. Wavelet entropy: a new tool for analysis of short duration brain electrical signals. J Neurosci Methods. 2001;105:65–75. doi: 10.1016/s0165-0270(00)00356-3. [DOI] [PubMed] [Google Scholar]
- Santaniello S, Fiengo G, Glielmo L, Grill WM. Closed-loop control of deep brain stimulation: A simulation study. IEEE Trans Neural Syst Rehabil Eng. 2011;19:15–24. doi: 10.1109/TNSRE.2010.2081377. [DOI] [PubMed] [Google Scholar]
- Shah SA, Tinkhauser G, Chen CC, Little S, Brown P. Parkinsonian tremor detection from subthalamic nucleus local field potentials for closed-loop deep brain stimulation. 40th Annual International Conference of the IEEE Engineering in Medicine and Biology Society (EMBC); 2018. pp. 2320–4. [DOI] [PMC free article] [PubMed] [Google Scholar]
- Shoaran M, Haghi BA, Taghavi M, Farivar M, Emami A. Energy-efficient classification for resource-constrained biomedical applications. IEEE J Emerg Sel Top Circ Syst. 2018:693–707. [Google Scholar]
- Shoaran M, Shahshahani M, Farivar M, Almajano J, Shahshahani A, Schmid A, et al. A 16-channel 1.1mm2 implantable seizure control SoC with sub-lW/channel consumption and closed-loop stimulation in 0.18lm CMOS. IEEE Symposium on VLSI Circuits, Digest of Technical Papers; 2016. [Google Scholar]
- Swann NCC, de Hemptinne C, Thompson MCC, Miocinovic S, Miller AMM, Ostrem JLL, et al. Adaptive deep brain stimulation for Parkinson’s disease using motor cortex sensing. J Neural Eng. 2018;15 doi: 10.1088/1741-2552/aabc9b. 46006. [DOI] [PMC free article] [PubMed] [Google Scholar]
- Trottenberg T, Fogelson N, Kühn AA, Kivi A, Kupsch A, Schneider G-H, et al. Subthalamic gamma activity in patients with Parkinson’s disease. Exp Neurol. 2006;200:56–65. doi: 10.1016/j.expneurol.2006.01.012. [DOI] [PubMed] [Google Scholar]
- van Wijk BCM, Beudel M, Jha A, Oswal A, Foltynie T, Hariz MI, et al. Subthalamic nucleus phase-amplitude coupling correlates with motor impairment in Parkinson’s disease. Clin Neurophysiol. 2016;127:2010–9. doi: 10.1016/j.clinph.2016.01.015. [DOI] [PMC free article] [PubMed] [Google Scholar]
- Velisar A, Syrkin-Nikolau J, Blumenfeld Z, Trager MH, Afzal MF, Prabhakar V, et al. Dual threshold neural closed loop deep brain stimulation in Parkinson disease patients. Brain Stimul. 2019 doi: 10.1016/j.brs.2019.02.020. [DOI] [PubMed] [Google Scholar]
- Weinberger M, Hutchison WD, Lozano AM, Hodaie M, Dostrovsky JO. Increased gamma oscillatory activity in the subthalamic nucleus during tremor in Parkinson’s disease patients. J Neurophysiol. 2009;101:789–802. doi: 10.1152/jn.90837.2008. [DOI] [PubMed] [Google Scholar]
- Yamamoto T, Katayama Y, Ushiba J, Yoshino H, Obuchi T, Kobayashi K, et al. On-demand control system for deep brain stimulation for treatment of intention tremor. Neuromodulation. 2013;16:230–5. doi: 10.1111/j.1525-1403.2012.00521.x. discussion 235. [DOI] [PubMed] [Google Scholar]
- Yao L, Brown P, Shoaran M. Resting tremor detection in parkinson’s disease with machine learning and kalman filtering. IEEE Biomedical Circuits and Systems Conference (BioCAS); pp. 1–4. [DOI] [PMC free article] [PubMed] [Google Scholar]
- Zhang Z, Parhi KK. Low-complexity seizure prediction from iEEG/sEEG using spectral power and ratios of spectral power. IEEE Trans Biomed Circuits Syst. 2016;10:693–706. doi: 10.1109/TBCAS.2015.2477264. [DOI] [PubMed] [Google Scholar]
- Zheng W, Zhu J, Lu B, Zhu J, Lu B. Identifying stable patterns over time for emotion recognition from EEG. IEEE Trans Affect Comput. 2017 doi: 10.1109/TAFFC.2017.2712143. [DOI] [Google Scholar]
- Zhu B, Coppola G, Shoaran M. Migraine classification using somatosensory evoked potentials. Cephalalgia. 2019 doi: 10.1177/0333102419839975. [DOI] [PubMed] [Google Scholar]


