Abstract
Tumours depend on altered rates of protein synthesis for growth and survival, suggesting that mechanisms controlling mRNA translation may be exploitable for therapy. Here, we show that loss of APC, which occurs almost universally in colorectal tumours, strongly enhances the dependence on the translation initiation factor eIF2B5. Depletion of eIF2B5 induces an integrated stress response and enhances translation of MYC via an internal ribosomal entry site. This perturbs cellular amino acid and nucleotide pools and strains energy resources and causes MYC-dependent apoptosis. eIF2B5 limits MYC expression and prevents apoptosis in APC-deficient murine and patient-derived organoids and in APC-deficient murine intestinal epithelia in vivo. Conversely, the high MYC levels present in APC-deficient cells induce phosphorylation of eIF2α via the GCN2 and PKR kinases. Pharmacological inhibition of GCN2 phenocopies eIF2B5 depletion and has therapeutic efficacy in tumour organoids, demonstrating that a negative MYC/eIF2α feedback loop constitutes a targetable vulnerability of colorectal tumours.
Keywords: colorectal cancer, APC, MYC, translation, eIF2B5, eIF2α
Introduction
Overall rates of cellular protein synthesis are regulated by extracellular and cell-intrinsic signals. Specifically, recognition of the mRNA cap structure by eIF4F as well as binding and recycling of the ternary complex (TC) are tightly controlled steps during translation initiation [1, 2]. In response to stress signals, eIF2α, a component of the TC, is phosphorylated [3]. This enhances its affinity for eIF2B, which sequesters phosphorylated eIF2α into an inactive complex, and disrupts TC formation [4–6]. Reduction in TC levels inhibits global translation initiation, but enhances translation of stress-responsive mRNAs via the integrated stress response (ISR) [3].
Virtually all colorectal cancers (CRC) harbor activating mutations in the WNT signaling pathway. Most frequently, this is due to deletion or loss-of-function mutations of the APC tumour suppressor [7], leading to an upregulation of the transcription factor MYC [8]. Restoration of Apc or deletion of Myc ablates tumourigenesis in mouse models of CRC [9, 10]. MYC induces transcription of genes encoding proteins of the translation machinery [7], and enhances global protein synthesis [8, 11–13]. Interfering with translation initiation or the mTOR-eEF2K axis controlling translational elongation is tolerated by normal tissues but prevents CRC growth, arguing that CRC depends on enhanced protein synthesis [1, 11, 14–16].
Here, we searched for specific dependencies of APC-deficient CRCs. Starting from an unbiased genetic screen, we identified a negative feedback loop, in which deregulated MYC expression and global translation in APC-deficient cells induce phosphorylation of eIF2α, which limits protein synthesis. Using mouse tumour models as well as murine and patient-derived organoids, we validated this dependency. Disrupting this circuit either genetically or by small molecule inhibitors of eIF2α kinases has therapeutic efficacy in APC-deficient tumours.
Results
Restoration of APC expression suppresses translation and anchorage-independent growth
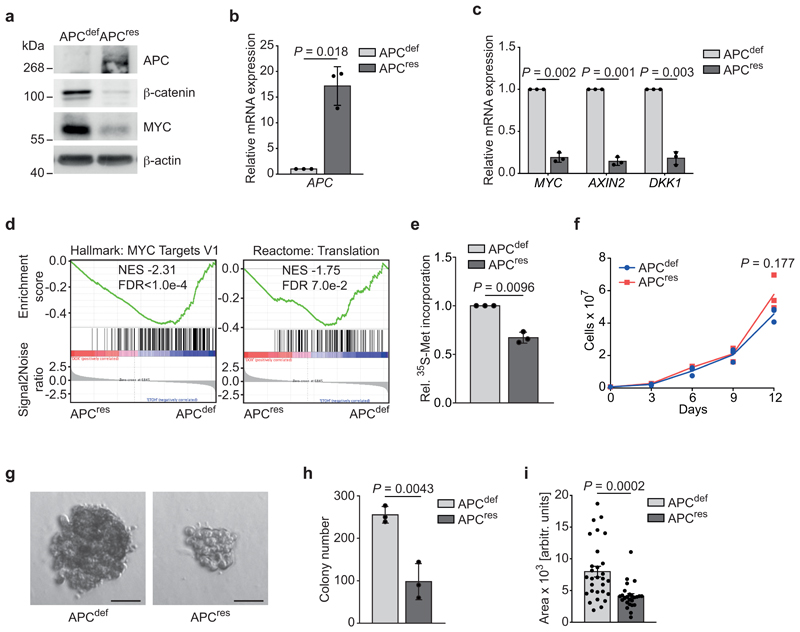
To identify genes that are essential in APC-deficient cells, we engineered SW480 cells, harbouring truncating mutations in both APC alleles, to express full-length APC in a doxycycline-inducible manner (SW480TetOnAPC) (Fig. 1a and Extended Data 1a,b). We designate these cells APC-deficient (APCdef) in the absence and APC-restored (APCres) in the presence of doxycycline. In APCres cells, β-catenin protein levels and mRNA expression of MYC, DKK1 and AXIN2 were significantly downregulated (Fig. 1a,b,c and Extended Data 1b,c). Gene set enrichment analysis (GSEA) of RNA-sequencing data showed that induction of APC represses multiple WNT- and MYC-regulated genes (Fig. 1d), including genes encoding proteins involved in translation (Fig. 1d and Supplementary Table 1) [17–20]. Consistent with these data and previous observations, global protein synthesis was enhanced in APCdef cells (Fig. 1e) [11]. Restoration of APC did not affect cell growth in two-dimensional culture conditions and did not induce apoptosis (Fig. 1f, and Extended Data 1d). In contrast, the number and size of APCres colonies growing in an anchorage-independent manner, a hallmark of oncogenic transformation [21], were markedly reduced (Fig. 1g,h,i) [22].
Figure 1. Restoration of APC expression suppresses translation and anchorage-independent growth.
(a) Immunoblot of SW480TetOnAPC cells after 48 h treatment with doxycycline (APCres) or ethanol (APCdef), representative of three independent experiments with similar results.
(b) mRNA expression of APC in SW480TetOnAPC cells (96 h ethanol or doxycycline, respectively) analysed via qPCR (n = 3 biologically independent experiments); unpaired, two-tailed t-test.
(c) mRNA expression of WNT pathway target genes MYC, AXIN2, DKK1 in SW480TetOnAPC cells treated as described in (b) analysed via qPCR (n = 3 biologically independent experiments); unpaired, two-tailed t-test.
(d) RNA-sequencing followed by GSEA of gene expression changes in APCdef and APCres cells (48 h ethanol and doxycycline, respectively). Enrichment plots of indicated gene sets are displayed (n = 3 biologically independent experiments). Calculation of the normalised enrichment score (NES) is based on a weighted running sum statistic and computed as part of the GSEA methodology [55]. A Kolmogorov-Smirnov test with 1,000 permutations was used to calculate P values that were then corrected for multiple testing using the Benjamini-Hoechberg procedure (FDR).
(e) 35S-methionine labelling of APCdef and APCres cells (72 h doxycycline). Incorporated radioactivity was measured by scintillation counting. Data show mean ± s.d. (n = 3 biologically independent experiments); unpaired, two-tailed t-test.
(f) Cumulative growth curve of APCdef and APCres cells treated with doxycycline or ethanol, respectively. Data show mean ± s.d. (n = 3 biologically independent experiments); unpaired, two-tailed t-test.
(g) Anchorage-independent growth of APCdef and APCres colonies. Colonies were grown over ten days, with fresh ethanol or doxycycline added every third day. Representative colonies are shown. Scale bars = 50 μM.
(h) Quantification of size of colonies from (g). Data show mean ± s.d. of all colonies counted (n = 29 for APCdef and n = 25 for APCres); unpaired, two-tailed t-test.
(i) Quantification of number of colonies from (g). Data show mean ± s.d. (n = 3 biologically independent experiments); unpaired, two-tailed t-test.
Unprocessed immunoblots are shown in Source Data Figure 1.
APC-deficient CRC cells depend on physiological eIF2B5 levels
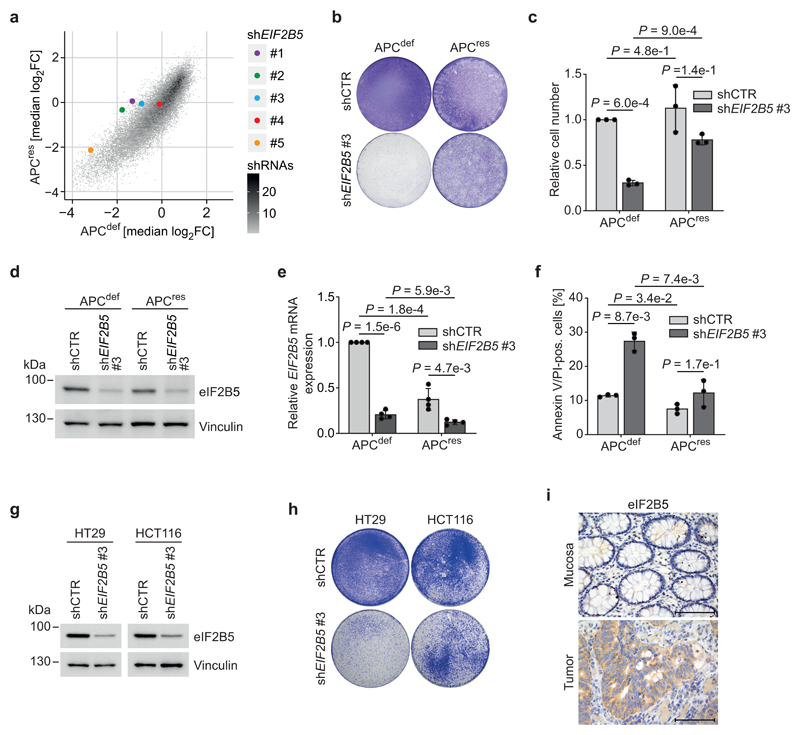
To identify genes required for the growth of APCdef, but not of APCres cells, we performed a dropout screen and infected SW480TetOnAPC cells with a lentiviral shRNA library targeting 5,000 potentially druggable genes encoding translation initiation and elongation factors as well as ribosomal proteins (Extended Data 1e,f). For each shRNA, relative enrichment or depletion after day 3 and day 15 of ethanol or doxycycline treatment was determined. Twenty-one shRNAs targeting luciferase, included as negative controls, were not selected against during growth of either APCdef or APCres cells (Extended Data 1g). In contrast, four out of five shRNAs targeting PSMB2, encoding an essential component of the proteasome, led to growth disadvantage in both APCdef and APCres cells (Extended Data 1h). Using a two-fold difference in representation between APCdef and APCres cells at day 15, but not at day 3, we filtered for potential hits (FDR < 0.05). From these, we recovered nine genes that were targeted by at least two shRNAs (Extended Data 1i and Supplementary Table 2). Among them were shRNAs targeting BCL2L1, which has previously been shown to be required for growth of cells with activating β-catenin mutations [23]. Notably, four out of five shRNAs targeting EIF2B5 were depleted specifically in APCdef cells, and showed the greatest difference in shRNA representation (Fig. 2a). Consistent with recovery as a hit, eIF2B5 depletion by an shRNA, used in the screen, suppressed growth of APCdef cells, but had only minor effects on APCres cells (Fig. 2b,c), despite similar knockdown efficiency (Fig. 2d,e). eIF2B5 depletion in APCdef cells, but not in APCres cells, significantly increased the percentage of annexin V/PI-positive cells and the percentage of cells with a subG1 DNA content (Fig. 2f and Extended Data 2a).
Figure 2. APC-deficient CRC cells depend on physiological eIF2B5 levels.
(a) Plot documenting log2 fold change of all shRNAs included in the screen in APCres versus APCdef cells (median of n = 3 biologically independent experiments) with five shRNAs targeting EIF2B5 shown in colour.
(b) Crystal violet staining of shCTR-transduced or eIF2B5-depleted APCdef and APCres cells (six days ethanol and doxycycline, respectively), representative of three biologically independent experiments with similar results. Cells were lentivirally infected with shRNAs targeting EIF2B5 or luciferase (shCTR).
(c) Relative number of shCTR-transduced or eIF2B5-depleted APCdef and APCres cells (seven days ethanol or doxycycline, respectively). Cell numbers were determined by staining with Hoechst and high-content microscopy imaging. Data show mean ± s.d. (n = 3 biologically independent experiments); unpaired, two-tailed t-test.
(d) Immunoblot of shCTR-transduced or eIF2B5-depleted APCdef and APCres cells (72 h ethanol or doxycycline), representative of five independent experiments with similar results.
(e) EIF2B5 mRNA levels determined via qPCR from cells described in (d). Data show mean ± s.d. (n = 4 biologically independent experiments); unpaired, two-tailed t-test.
(f) Annexin V/PI FACS analysis of shCTR-transduced or eIF2B5-depleted APCdef and APCres cells (96 h ethanol or doxycycline, respectively). Data shown mean ± s.d. (n = 3 biologically independent experiments); unpaired, two-tailed t-test.
(g) Immunoblot of shCTR-transduced or eIF2B5-depleted HT29 and HCT116 cells, representative of two independent experiments with similar results. Cells were lentivirally infected with shRNAs targeting EIF2B5 or luciferase (shCTR).
(h) Crystal violet staining of shCTR-transduced or eIF2B5-depleted HT29 and HCT116 cells, representative of two independent experiments with similar results.
(i) eIF2B5 staining of human CRC tumour tissue and normal mucosa (representative image of n = 10 biologically independent patients). Scale bars = 100 μm.
Unprocessed immunoblots are shown in Source Data Figure 2.
Using a series of four shRNAs with different knockdown efficacy (Extended Data 2b), we established that differential apoptosis induction in APCdef and APCres cells correlated with the degree of eIF2B5 depletion (Extended Data 2c). Strong knockdown elicited by shEIF2B5 #1 potently induced apoptosis in APCdef, but also to some degree in APCres cells. Moderate knockdown by shEIF2B5 #3 induced apoptosis in APCdef, but had no effect on APCres cells. Weak knockdown (shEIF2B5 #2, #4) induced little or no apoptosis in APCdef and APCres cells. To validate that apoptosis is an on-target effect, we overexpressed an shRNA-resistant HA-tagged eIF2B5 (eIF2B5mut-HA). Neither shEIF2B5 #1 nor #3 depleted HA-tagged exogenous eIF2B5, although they are functional since they reduced expression of endogenous eIF2B5 (Extended Data 2d,e). Accordingly, we observed no apoptosis in cells expressing eIF2B5mut-HA (Extended Data 2f). Finally, eIF2B5 depletion strongly suppressed growth of APC-deficient HT29 cells, but had a much weaker effect in APC-proficient HCT116 cells (Fig. 2g,h and Extended Data 2g).
Notably, APCdef and APCres cells express comparable eIF2B5 protein levels despite increased EIF2B5 mRNA levels in APCdef relative to APCres cells (Fig. 2d,e). Datasets from human CRCs show a moderate increase in EIF2B5 mRNA in CRC relative to normal tissue (Extended Data 2h). Histopathologic staining of human CRC samples revealed an enhanced eIF2B5 expression in tumours relative to mucosa (Fig. 2i). We concluded that physiological levels of eIF2B5 are required to suppress apoptosis in APC-deficient cells.
eIF2B5 controls translation initiation and limits global protein synthesis
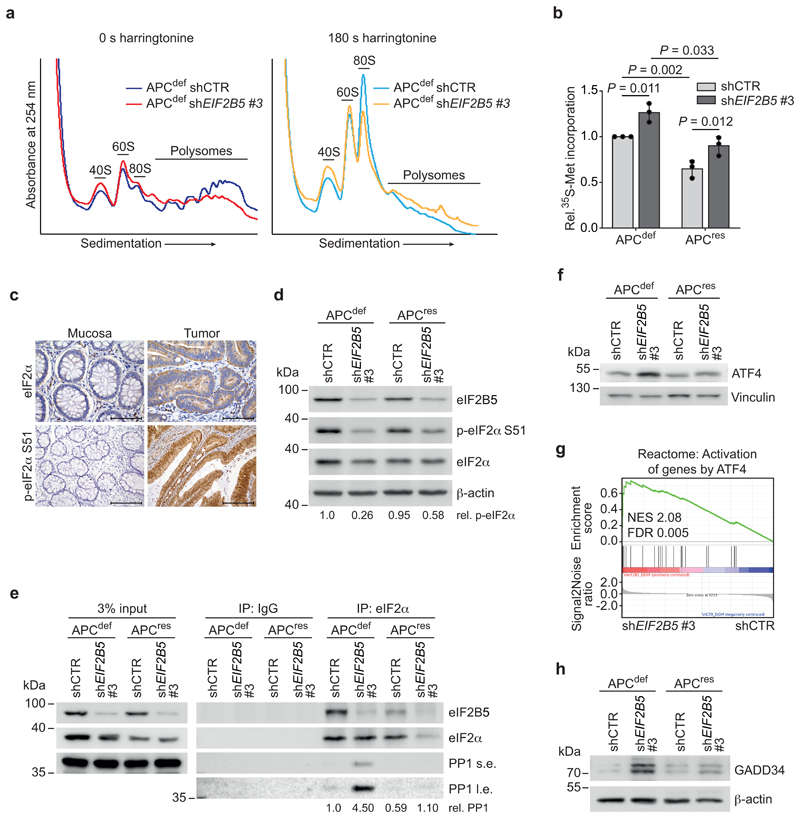
eIF2B5 is the catalytic subunit of the decameric eIF2B complex [4, 24, 25], which is the guanine nucleotide exchange factor (GEF) for eIF2 that replaces GDP by GTP and enables binding of initiator methionyl transfer RNA (Met-tRNAi) to eIF2 (TC formation) [24, 26]. Accordingly, eIF2B5 depletion caused a relative increase in free 40S and 60S ribosomal subunits and a decrease in polysomal fractions (Fig. 3a and Extended Data 3a). To pinpoint the effect on translation initiation, we blocked the first translation elongation step by addition of harringtonine [27]. This led to an expected increase in 40S, 60S, and 80S monosomes and showed that eIF2B5 depletion strongly reduced the amount of 80S monosomes consistent with its effect on TC formation (Fig. 3a). Surprisingly, eIF2B5 knockdown elicited an increase in overall protein synthesis in both APCdef and APCres cells (Fig. 3b). This increase correlated with the degree of eIF2B5 knockdown (Extended Data 2b and 3b). In CRC cells, inhibition of initiation can be compensated by an increase in translation elongation driven via inhibition of eEF2K by S6K1 [11]. Accordingly, depletion of eIF2B5 strongly activated S6K1 in APCdef cells (Extended Data 3c).
Figure 3. eIF2B5 controls translation initiation and limits global protein synthesis.
(a) Polysome profiling of shCTR-transduced and eIF2B5-depleted APCdef cells (72 h ethanol) incubated with harringtonine for 0 s (left) and 180 s (right) before harvest. 40S, 60S, 80S monosomal and polysomal fractions are indicated. Data (0 s harringtonine) are representative of three independent experiments with similar results, 180 s harringtonine assay was performed once.
(b) 35S-methionine labelling of shCTR-transduced and eIF2B5-depleted APCdef and APCres cells (72 h ethanol or doxycycline, respectively). Incorporated radioactivity was measured by scintillation counting. Data show mean ± s.d. (n = 3 biologically independent experiments); unpaired, two-tailed t-test.
(c) Total eIF2α and p-eIF2α S51 staining of human CRC tumour tissue and normal mucosa (representative image of n = 10 biologically independent patients). Scale bars = 100 μm.
(d) Immunoblot of shCTR-transduced and eIF2B5-depleted APCdef and APCres cells (96 h ethanol or doxycycline, respectively), representative of three independent experiments with similar results. p-eIF2α S51 levels, relative to total eIF2α levels, are shown below the immunoblot.
(e) Immunoprecipitation of eIF2α in shCTR-transduced or eIF2B5-depleted APCdef and APCres cells (72 h ethanol or doxycycline, respectively). As input, 3% of lysate was loaded. Proteins bound to eIF2α were detected by immunoblotting. Average levels of immunoprecipitated PP1 relative to immunoprecipitated eIF2α levels, normalised to input, are shown below (n = 2 biologically independent experiments). s.e. short exposition, l.e. long exposition.
(f) Immunoblot of shCTR-transduced or eIF2B5-depleted APCdef and APCres cells treated as described in (d), representative of three independent experiments with similar results.
(g) RNA-sequencing followed by GSEA of gene expression changes in shCTR-transduced or eIF2B5-depleted APCdef cells. Enrichment plot of a Reactome gene set representing an ATF4-dependent stress response is shown (n = 3 biologically independent experiments). Statistical analysis was done as described in Fig. 1d.
(h) Immunoblot of shCTR-transduced or eIF2B5-depleted APCdef and APCres cells treated as described in (d), representative of three independent experiments with similar results.
Unprocessed immunoblots are shown in Source Data Figure 3.
Consistent with previous findings, eIF2α and its phosphorylated form are upregulated in tumour tissue [28] (Fig. 3c). In addition, eIF2B binds p-eIF2α with high affinity and antagonizes dephosphorylation and activation of eIF2α by PP1 [29]. Depletion of eIF2B5 led to dephosphorylation of eIF2α at S51, readily detectable in APCdef cells, while the effect in APCres cells was more variable (Fig. 3d and Extended Data 3d). To determine whether eIF2B5 limits PP1 binding to eIF2α, we immunoprecipitated eIF2α. Depletion of eIF2B5 strongly enhanced association of PP1 with eIF2α in APCdef, but much less so in APCres cells (Fig. 3e). This mechanism is expected to reduce the sensitivity of translation initiation to inhibition by stress-related kinases.
Depletion of eIF2B5 causes MYC-driven apoptosis
To understand why eIF2B5 depletion causes apoptosis specifically of APCdef cells, we performed ribosome profiling of APCdef and APCres cells to investigate a potential shift in the spectrum of translated mRNAs [30, 31]. We did not observe any differences in global ribosome association of mRNAs between eIF2B5-depleted APCdef and APCres cells (Extended Data 3e and Supplementary Table 3). However, gene ontology analysis of ribosome-associated mRNAs revealed an enrichment of mRNAs associated with stress response and apoptotic signaling pathways upon eIF2B5 knockdown in APCdef, but less in APCres cells (Extended Data 3f). This is consistent with observations that a reduction in TC formation induces an ISR resulting in a bypass of upstream open reading frames (uORFs) present in stress-responsive mRNAs such as that of the transcription factor ATF4 [2]. Indeed, inactivating mutations in eIF2B subunits in yeast lead to the induction of the ISR [32]. Accordingly, eIF2B5 knockdown induced ATF4 protein expression as well as enrichment of a consensus ATF4 target gene signature including DDIT3, ATF3 and ATF6, in APCdef cells and this response correlates with the degree of eIF2B5 knockdown (Fig. 3f,g, Extended Data 3g and Supplementary Table 4).
Enhanced translation and defects in protein folding in the endoplasmic reticulum can activate two other stress signaling pathways, mediated by IRE1α and ATF6, as part of the unfolded protein response (UPR) [33]. Notably, while APC loss activated both the ISR and IRE1α as well as ATF6, evidenced by expression of UPR-associated genes (spliced XBP1, GRP78 and unspliced XBP1), additional eIF2B5 depletion induced only the ISR (Extended Data 3h,i) [34].
ATF4 controls transcription of multiple stress-related genes, including GADD34 and ATF3, both of which were induced upon eIF2B5 knockdown in APCdef, but not in APCres cells (Fig. 3h and Extended Data 3i). ATF3 is important for CHOP expression [35] and CHOP can drive apoptosis, eliminating cells after prolonged stress [36]. eIF2B5 depletion in APCdef cells induced CHOP expression to a similar extent as exposure to tunicamycin (Extended Data 4a), which blocks protein glycosylation and is an established inducer of an ISR [36]. These responses were attenuated in APCres cells (Extended Data 4a). siRNA-mediated CHOP knockdown abolished its upregulation after eIF2B5 depletion in APCdef cells, but had only minor effects on the apoptotic response after eIF2B5 depletion (Extended Data 4b,c).
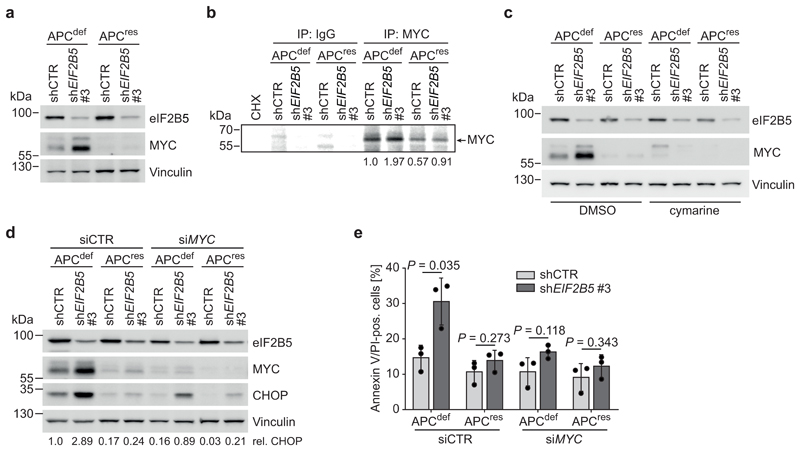
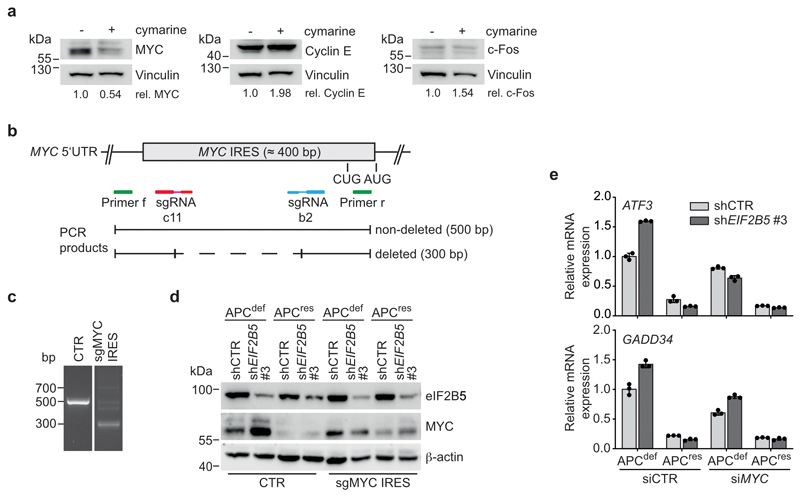
APC loss strongly enhances expression of MYC mRNA [9]. Since high MYC levels induce apoptosis [37], we tested whether MYC expression is differentially regulated after eIF2B5 knockdown. Upon eIF2B5 knockdown in APCdef cells, MYC protein levels were markedly upregulated, while MYC mRNA levels and protein stability remained unaltered (Fig. 4a and Extended Data 4d,e). MYC protein levels were also induced by shEIF2B5 #1, but not by shEIF2B5 #4 (Extended Data 4f,g). Similarly, MYC is upregulated after eIF2B5 knockdown in APC-deficient HT29 cells, but not in APC-proficient HCT116 cells (Extended Data 4h). Immunoprecipitation of 35S-methionine pulse-labelled MYC showed that eIF2B5 depletion enhanced MYC translation in APCdef cells (Fig. 4b). In apoptotic cells, translation of MYC is enhanced via an internal ribosomal entry site (IRES) [38, 39]. A specific inhibitor of MYC IRES-dependent translation, cymarine [40], decreased basal MYC expression and abolished its upregulation in response to eIF2B5 depletion in APCdef cells, but had no effect on two other short-lived proteins (Cyclin E, c-Fos) (Fig. 4c and Extended Data 5a). Furthermore, deleting an internal part of the MYC IRES by CRISPR/Cas9 abolished MYC induction upon eIF2B5 knockdown (Extended Data 5b,c,d). We concluded that depletion of eIF2B5 enhances IRES-dependent translation of MYC.
Figure 4. Depletion of eIF2B5 causes MYC-driven apoptosis.
(a) Immunoblot of shCTR-transduced or eIF2B5-depleted APCdef and APCres cells (96 h ethanol or doxycycline, respectively), representative of three independent experiments with similar results.
(b) 35S-methionine pulse-labelling followed by immunoprecipitation with a MYC-specific antibody or control IgG in shCTR-transduced or eIF2B5-depleted APCdef and APCres cells (96 h ethanol or doxycycline, respectively). Protein synthesis inhibitor cycloheximide (CHX) was used as control. Radio-labelled MYC was detected by autoradiography. The arrow indicates the position of the specific MYC band. Average MYC levels are shown below the panel (n = 3 biologically independent experiments).
(c) Immunoblot of cymarine-treated (100 nM, 24 h) shCTR-transduced or eIF2B5-depleted APCdef and APCres cells (72 h ethanol or doxycycline, respectively), representative of two independent experiments with similar results. DMSO was used as solvent control.
(d) Immunoblot of shCTR-transduced and eIF2B5-depleted APCdef and APCres cells (96 h ethanol or doxycycline, respectively) upon MYC depletion, representative of two independent experiments with similar results. siRNA transfections were carried out using siCTR as non-targeting control or siMYC for 72 h.
(e) Annexin V/PI FACS of shCTR-transduced or eIF2B5-depleted APCdef and APCres cells treated as described in (d). Data show mean ± s.d. (n = 3 biologically independent experiments), unpaired, two-tailed t-test.
Unprocessed immunoblots are shown in Source Data Figure 4.
Depletion of MYC strongly reduced induction of apoptosis in response to eIF2B5 depletion in APCdef cells (Fig. 4d,e). It also decreased basal CHOP levels and compromised CHOP, ATF3 and GADD34 induction upon eIF2B5 knockdown (Fig. 4d and Extended Data 5e). We concluded that eIF2B5 downregulation increases MYC translation in APCdef cells, causing apoptosis. Since MYC mRNA and the ISR levels, which enhance MYC IRES translation, are lower in APCres cells, eIF2B5 depletion does not cause a similar MYC upregulation in these cells.
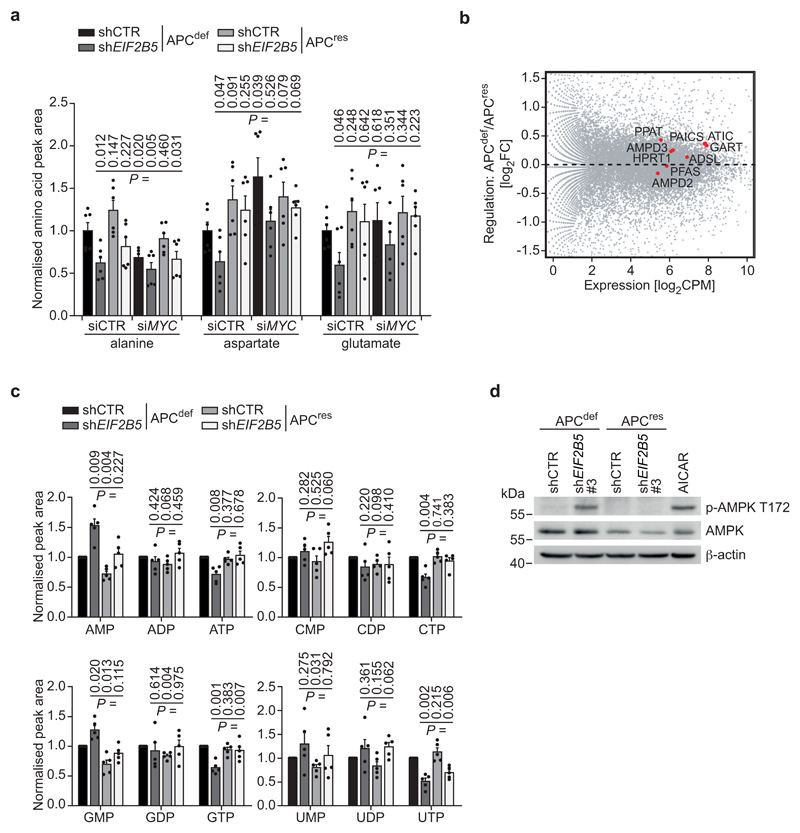
To understand how deregulation of protein synthesis and MYC expression contribute to apoptosis, we determined intracellular amino acid pools. Knockdown of eIF2B5 significantly reduced alanine, aspartate and glutamate levels (Fig. 5a). APC restoration or MYC depletion alleviated the effects of eIF2B5 depletion on aspartate and glutamate levels. Both amino acids are precursors for nucleotide synthesis, a highly energy-demanding process [41]. The corresponding biosynthetic enzymes are encoded by MYC target genes and several are induced following APC loss (Fig. 5b) [42]. Intriguingly, eIF2B5 depletion decreased tri-phosphorylated nucleotides in APCdef cells, which was lessened or abolished by APC restoration, indicative of a reduction in cellular energy charge (Fig. 5c). Consistent with these findings, eIF2B5 depletion strongly increased phosphorylated AMPK in APCdef, but not in APCres cells (Fig. 5d). We concluded that eIF2B5 depletion causes an APC-dependent perturbation of cellular amino acid and nucleotide pools and of energy homeostasis.
Figure 5. Depletion of eIF2B5 causes an imbalance in amino acid and nucleotide pools.
(a) Mass spectrometric analysis of intracellular alanine, aspartate and glutamate levels in shCTR-transduced or eIF2B5-depleted APCdef and APCres cells upon MYC depletion. siRNA transfections were carried out using siCTR as non-targeting control or siMYC for 72 h. Relative measured peak area normalised to protein concentration and total amino acid levels is shown. Peak area in APCdef cells transfected with siCTR was set to one. Data represent mean + s.d. (n = 6 biologically independent experiments); unpaired, two-tailed t-test.
(b) MA plot of RNA-sequencing data of APCdef and APCres cells. Genes associated with inosine monophosphate (IMP)/purine biosynthesis (GO:0006188) are highlighted in red (n = 3 biologically independent experiments).
(c) Mass spectrometric analysis of intracellular nucleotide levels in shCTR-transduced and eIF2B5-depleted APCdef and APCres cells treated as described in (a). Relative measured peak area normalised to protein concentration is shown. Peak area in APCdef cells transfected with siCTR was set to one. Data represent mean + s.d. (n = 5 biologically independent experiments); unpaired, two-tailed t-test.
(d) Immunoblot of shCTR-transduced or eIF2B5-depleted APCdef and APCres cells (96 h ethanol or doxycycline, respectively), representative of two independent experiments with similar results. As control for AMPK activation, cells were treated with AICAR (1 mM, 24 h).
Unprocessed immunoblots are shown in Source Data Figure 5.
Physiological eIF2B5 levels are required for tumourigenesis driven by loss of APC
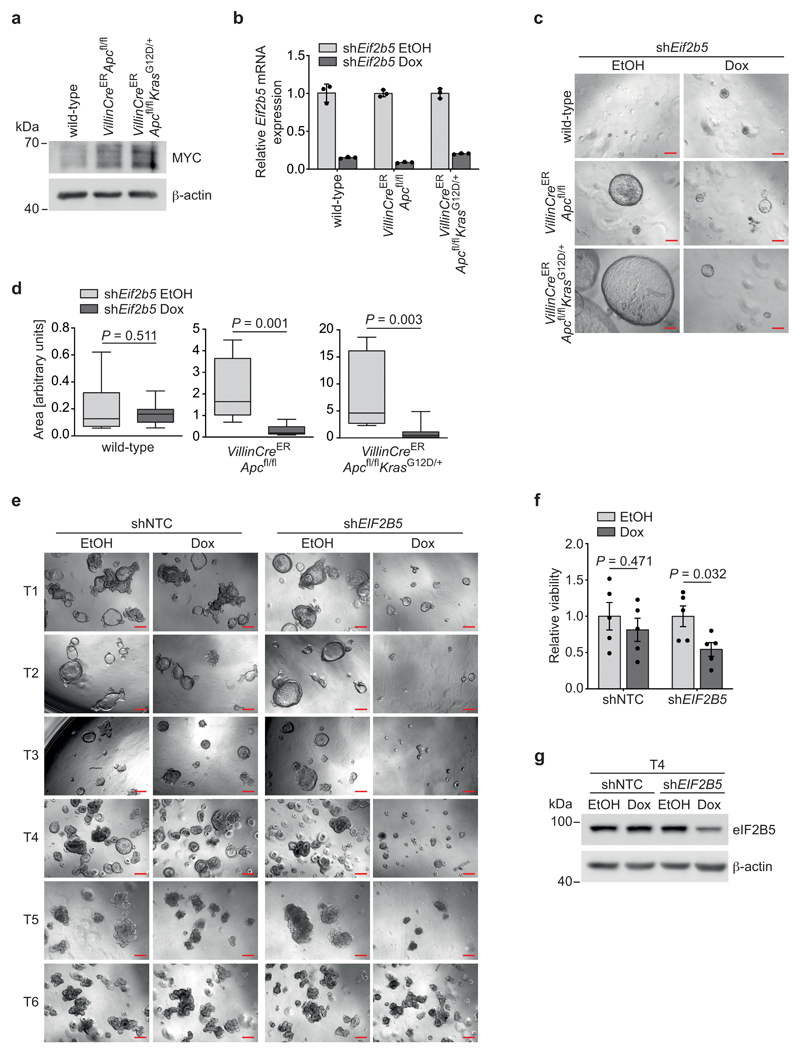
To demonstrate the effects of eIF2B5 depletion in a genetically defined setting, we used intestinal organoids [43, 44], generated from wild-type, VillinCreERApcfl/fl or VillinCreERApcfl/flKrasG12D/+ mice and recombined them ex vivo by addition of 4-hydroxytamoxifen (4-OHT). Accordingly, MYC protein was induced in Cre-recombined organoids relative to wild-type counterparts (Extended Data 6a). Doxycycline-inducible eIF2B5 knockdown had no effect on the size of wild-type organoids, but dramatically reduced the growth of VillinCreERApcfl/fl and VillinCreERApcfl/flKrasG12D/+ organoids (Extended Data 6b,c,d), arguing that eIF2B5 levels are critical for the growth of Apc-deleted organoids. To validate our findings in a human setting, we used a panel of six patient-derived CRC organoids. All five APC-mutated organoids showed a reduction in viability after eIF2B5 knockdown, whereas one APC wild-type organoid did not (Extended Data 6e,f,g).
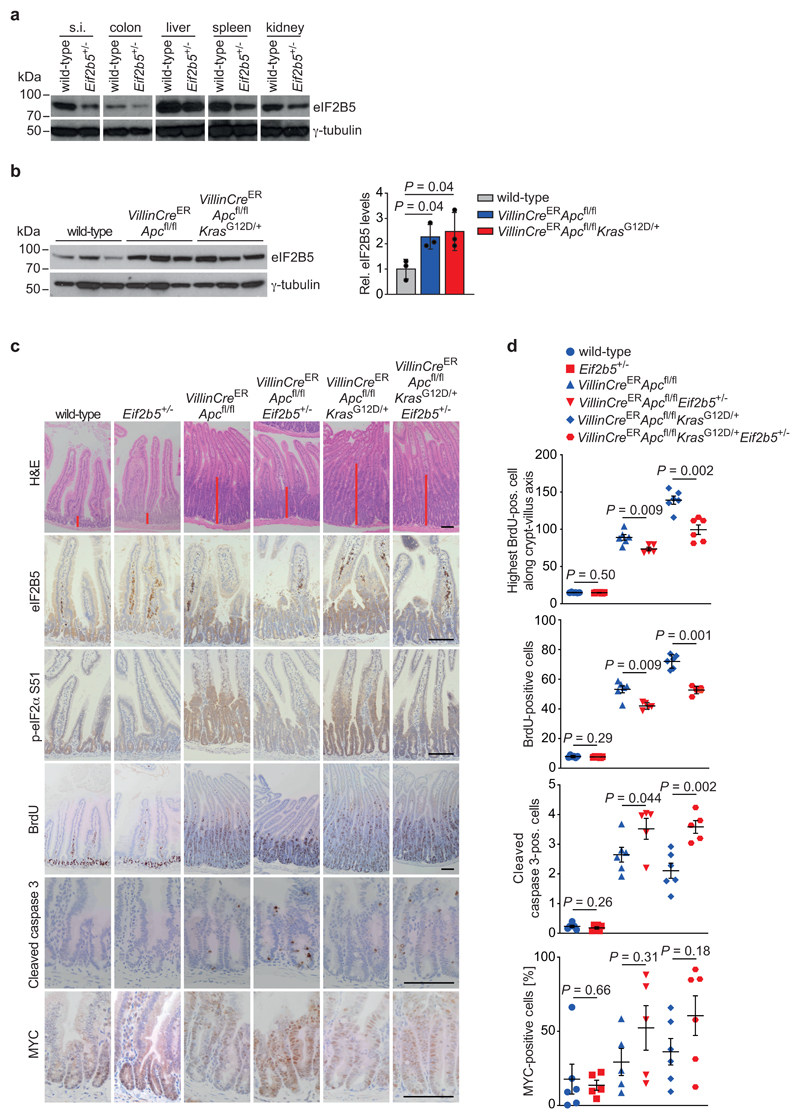
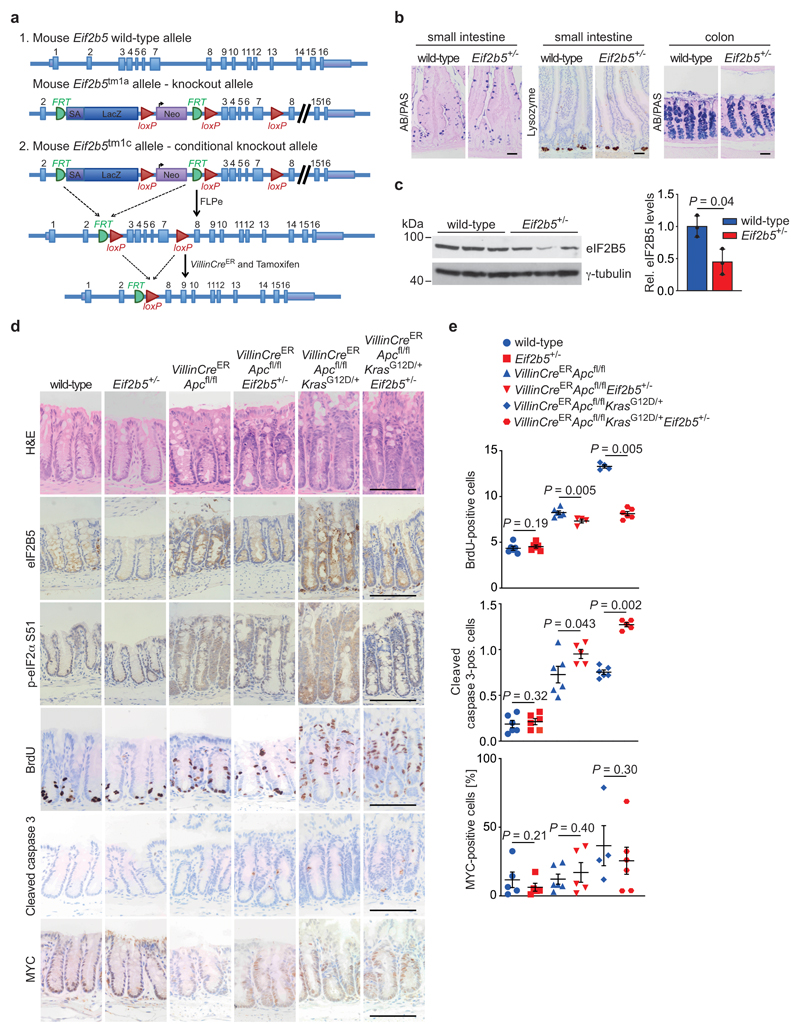
Since a complete Eif2b5 knockout is embryonically lethal [26], we characterized mice, in which one Eif2b5 allele has been disrupted by integration of a gene-trap vector generating Eif2b5+/tm1a(EUCOMM)Wtsi mice, hereafter designated Eif2b5+/- (Extended Data 7a). Eif2b5+/- mice were born viable, at normal Mendelian ratios, were phenotypically indistinguishable from their Eif2b5+/+ littermates and displayed normal intestinal tissue architecture with no changes in cell size, survival, proliferation or differentiation (Extended Data 7b). Relative to wild-type littermates, Eif2b5+/- mice displayed an approximately 50% reduction in eIF2B5 protein levels in all analysed organs as well as in intestinal epithelial extracts (Fig. 6a and Extended Data 7c). These findings demonstrate that a 50% reduction in eIF2B5 is compatible with normal organismal development and physiology.
Figure 6. Physiological eIF2B5 levels are required for tumourigenesis driven by loss of Apc.
(a) Immunoblot of small intestine (s.i.), colon, liver, spleen and kidney from wild-type and Eif2b5+/- mice. Analysis was done once with one mouse per genotype.
(b) Immunoblot of intestinal epithelial extracts from mice of the indicated genotypes (left). Each lane represents one separate mouse of the relevant group. Immunoblot was performed once. Quantification of eIF2B5 protein levels, normalised to γ-tubulin (right). Data show mean ± s.d. (n = 3 biologically independent mice); one-tailed Mann-Whitney U test.
(c) Representative H&E-, eIF2B5-, p-eIF2α S51-, BrdU-, cleaved caspase 3-, and MYC-stained sections of small intestines from mice of the indicated genotypes. Mice were sampled four and three days post-induction, as described in Methods. Red bars indicate the length of the crypt (top panel). Scale bars = 100 μm.
(d) Graphs documenting the position of the highest BrdU-positive cell along the crypt-villus axis (top panel), the total number of cells staining positive for BrdU per half crypt (top middle panel), and the total number of cells per full crypt staining positive for cleaved caspase 3 (bottom middle panel) or MYC (bottom panel) in small intestines from mice of the indicated genotypes. Data were scored in 25 crypts per mouse in at least three biologically independent mice (n = 3 for highest BrdU-positive cell in wild-type and Eif2b5+/-, n = 5 for highest BrdU-positive cell in VillinCreERApcfl/flEif2b5+/-, n = 5 for BrdU staining in VillinCreERApcfl/flEif2b5+/-, n = 5 for cleaved caspase 3 staining in VillinCreERApcfl/flEif2b5+/- and VillinCreERApcfl/flKrasG12D/+Eif2b5+/-, n = 5 for MYC staining in Eif2b5+/-, VillinCreERApcfl/fl and VillinCreERApcfl/flEif2b5+/- mice, n = 6 for all other stainings and genotypes). Data show mean ± s.e.m.; one-tailed Mann-Whitney U.
Unprocessed immunoblots are shown in Source Data Figure 6.
To determine whether eIF2B5 levels are critical for colorectal tumour development driven by Apc loss, we used mice carrying the conditional knockout Apc580s allele alone or in combination with a conditional allele encoding oncogenic KrasG12D (VillinCreERApcfl/fl or VillinCreERApcfl/flKrasG12D/+) [9, 45–47]. Apc deletion and Kras mutation increased eIF2B5 protein levels more than two-fold in small intestinal epithelial extracts, similar to what we observed in human tumours (Fig. 6b). Histological staining confirmed reduced expression of eIF2B5 in intestinal epithelia of Eif2b5+/- mice (Fig. 6c and Extended Data 7d). Levels of p-eIF2α were low in crypts in wild-type epithelia of small intestine and colon, whereas p-eIF2α was clearly detectable upon Apc deletion with or without activation of KrasG12D, consistent with previous data that eIF2α phosphorylation increases during tumourigenesis (Fig. 6c and Extended Data 7d) [28]. In both genetic backgrounds, p-eIF2α staining intensity was reduced in Eif2b5+/- mice relative to Eif2b5+/+ counterparts, supporting the tissue culture data (Fig. 6c and Extended Data 7d). Loss of Apc led to massive tissue growth and a corresponding increase in BrdU incorporation in the intestine of Eif2b5+/+ mice, which were further enhanced upon simultaneous activation of oncogenic KrasG12D (Fig. 6c,d and Extended Data 7d,e). These effects were significantly suppressed in the intestine of Eif2b5+/-mice, both in the absence or presence of oncogenic KrasG12D (Fig. 6c,d and Extended Data 7d,e). Cleaved caspase 3 increased robustly in VillinCreERApcfl/flEif2b5+/- and VillinCreERApcfl/flKrasG12DEif2b5+/- compared to their Eif2b5+/+ counterparts (Fig. 6c,d and Extended Data 7d,e). Loss of Apc increases MYC levels which are further enhanced by introduction of a KrasG12D allele in Eif2b5+/+ mice [9, 48]. While corresponding Eif2b5+/- mice show a further increase of MYC-positive cells, this did not reach statistical significance (Fig. 6c,d and Extended Data 7d,e). Therefore, the basic mechanism we describe also operates in these cells; possibly, other ISR target proteins contribute to apoptosis induction aside from MYC.
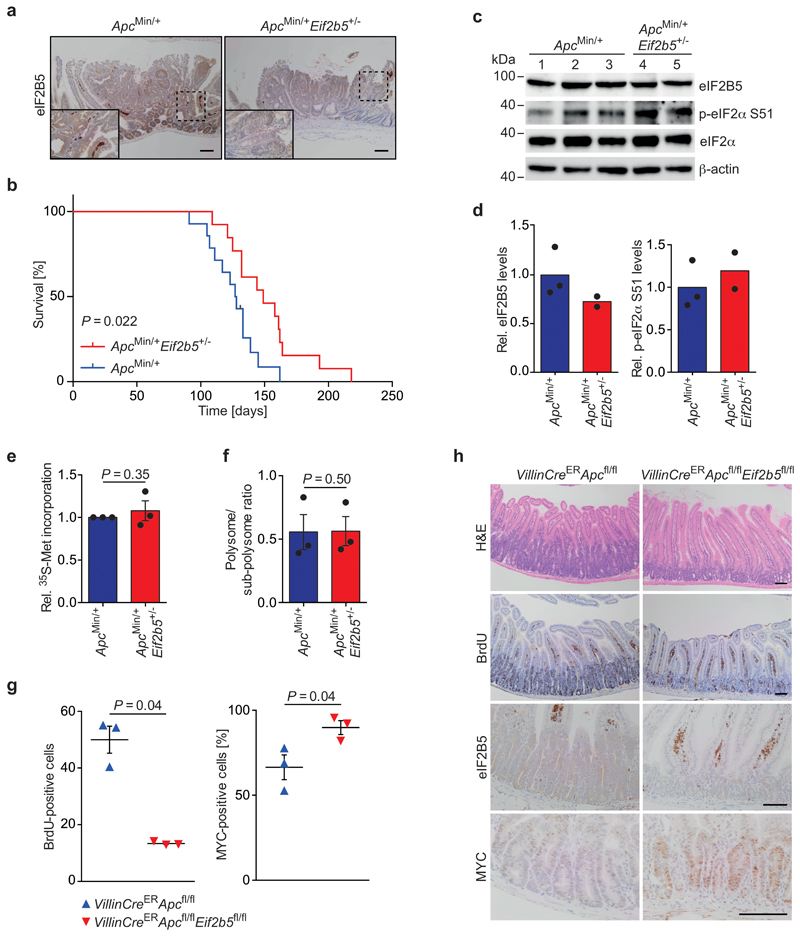
To analyse the impact of eIF2B5 on long-term survival in an Apc-deficient mouse model, we crossed ApcMin/+ [49] mice to Eif2b5+/- animals. Relative to ApcMin/+ littermates, ApcMin/+Eif2b5+/- animals had a significantly extended lifespan (median survival: 149 versus 127.5 days; Extended Data 8a,b). Importantly, organoids established from outgrowing tumours of both genotypes revealed no difference in p-eIF2α levels, protein synthesis rates and polysome/sub-polysome ratio (Extended Data 8c-f). Furthermore, Eif2b5+/- tumours restored eIF2B5 expression to approximately 70% of wild-type levels, indicating that significant compensation had taken place during tumour evolution (Extended Data 8c,d).
Finally, acute deletion of both alleles of Eif2b5 in VillinCreERApcfl/fl mice decreased cell proliferation and concomitantly increased MYC expression (Extended Data 8g,h), confirming that targeting eIF2B5 can strongly affect tumour growth and raising the possibility that MYC translation is largely independent of eIF2B5 in vivo.
Targeting PKR and GCN2 opens a therapeutic window for APC loss-driven CRC
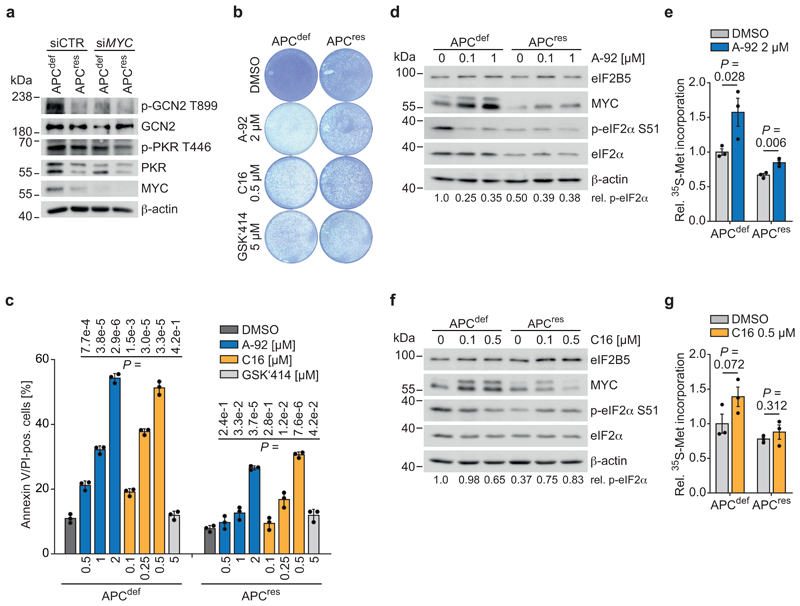
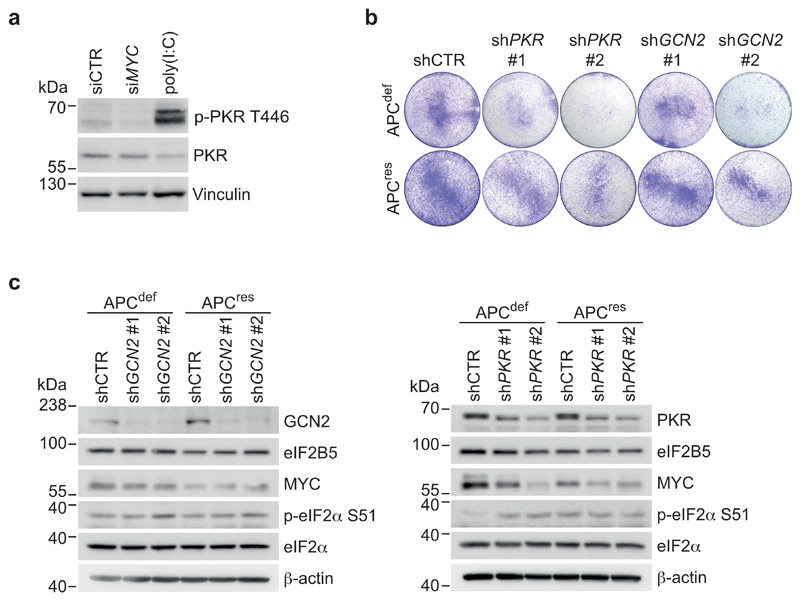
Since eIF2B5 cannot currently be targeted by small molecules, we tested whether inhibiting eIF2α phosphorylation can achieve similar therapeutic efficacy. Four kinases (EIF2AK1-4) phosphorylate eIF2α in response to distinct stresses [50]. Of these, HRI (heme-regulated inhibitor; EIF2AK1) restricts globin translation in erythrocytes upon heme depletion, and PERK (EIF2AK3) is activated in response to ER stress (see above). We therefore focused on PKR (EIF2AK2), activated by double-stranded RNA, and on GCN2 (EIF2AK4), activated by depletion of amino acids and uncharged tRNA pools [50]. Using antibodies that detect the phosphorylated, active forms, we found that GCN2 and, to a lesser degree, PKR are activated in APCdef compared to APCres cells (Fig. 7a). Intriguingly, MYC knockdown reduced the levels of phosphorylated PKR and essentially abolished GCN2 phosphorylation (Fig. 7a and Extended Data 9a).
Figure 7. Inhibition of PKR and GCN2 phenocopies eIF2B5 knockdown.
(a) Immunoblot of APCdef and APCres cells upon siRNA-mediated knockdown of MYC (96 h ethanol or doxycycline, respectively), representative of two independent experiments with similar results. siRNA transfections were carried out using siCTR as non-targeting control or siMYC for 72 h.
(b) Crystal violet staining of APCdef and APCres cells (seven days ethanol or doxycycline, respectively) in the presence of the following eIF2α kinase inhibitors for 96 h: A-92 (GCN2 inhibitor), C16 (PKR inhibitor), GSK2606414 (PERK inhibitor, designated GSK‘414), representative of three independent experiments with similar results. DMSO was used as solvent control.
(c) Annexin V/PI FACS analysis of APCdef and APCres cells (five days ethanol or doxycycline, respectively) treated with DMSO or inhibitors of GCN2 (A-92), PKR (C16), or PERK (GSK'414) for 48 h at the indicated concentrations. Data show mean ± s.d. (n = 3 biologically independent experiments); unpaired, two-tailed t-test.
(d) Immunoblot of APCdef and APCres cells (72 h ethanol or doxycycline, respectively) after DMSO or A-92 treatment (2 h), representative of two independent experiments with similar results. p-eIF2α S51 levels, relative to total eIF2α levels, are shown below the immunoblot.
(e) 35S-methionine labelling of APCdef and APCres cells (96 h ethanol or doxycycline, respectively) treated with DMSO or GCN2 inhibitor A-92 for 48 h. Incorporated radioactivity was measured by scintillation counting. Data show mean ± s.e.m. (n = 3 biologically independent experiments); unpaired, two-tailed t-test.
(f) Immunoblots of APCdef and APCres cells (72 h ethanol or doxycycline, respectively) after DMSO or C16 treatment (2 h), representative of two independent experiments with similar results. p-eIF2α S51 levels, relative to total eIF2α levels, are shown below the immunoblot.
(g) 35S-methionine labelling of APCdef and APCres cells (96 h ethanol or doxycycline, respectively) treated with DMSO or PKR inhibitor C16 for 48 h. Incorporated radioactivity was measured by scintillation counting. Data show mean ± s.e.m. (n = 3 biologically independent experiments); unpaired, two-tailed t-test.
Unprocessed immunoblots are shown in Source Data Figure 7.
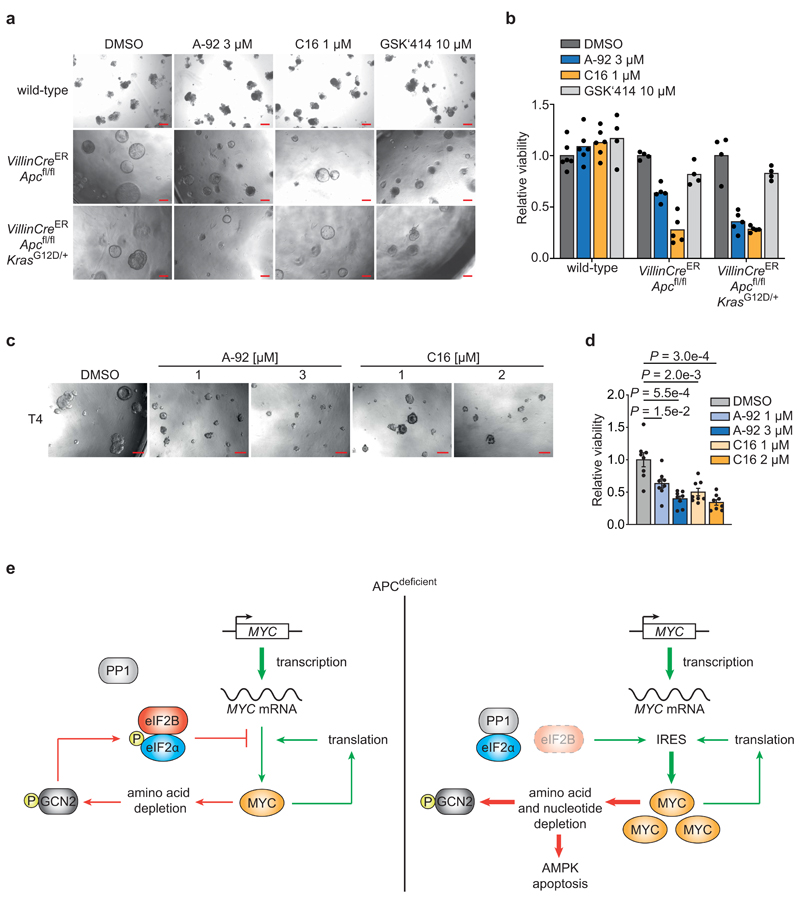
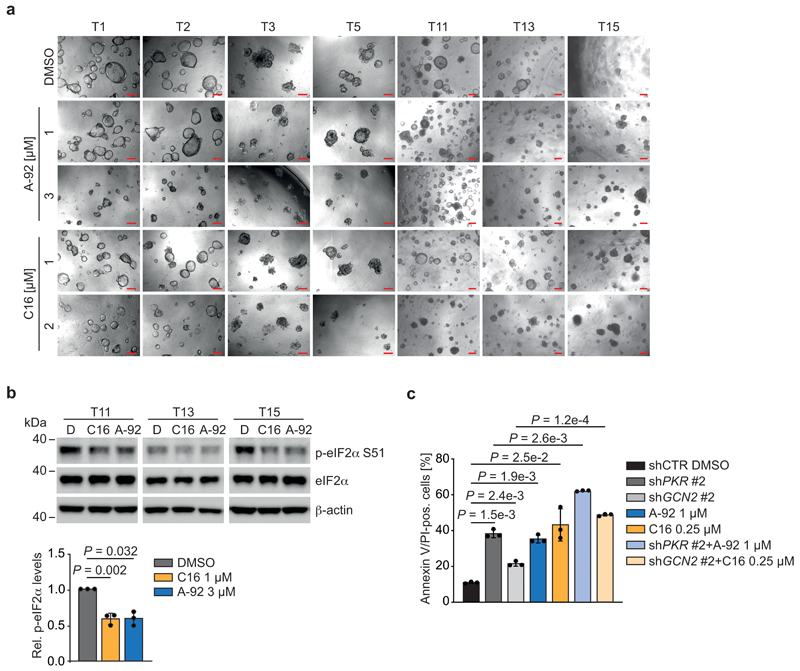
Individual PKR or GCN2 knockdown suppressed the growth of APCdef cells to a variable extent (Extended Data 9b). However, genetic depletion of either GCN2 or PKR did not decrease p-eIF2α levels (Extended Data 9c), arguing that cells compensate for the lack of either kinase during genetic suppression. To test whether an acute inhibition of either kinase activity can mimic eIF2B5 depletion, we used small molecule inhibitors of GCN2 (A-92), PKR (C16), or PERK (GSK2606414, hereafter GSK'414) [50]. GCN2 or PKR inhibition suppressed the growth of APCdef cells, but had only minor effects on APCres cells (Fig. 7b). Both inhibitors induced apoptosis in a dose-dependent manner in APCdef cells, but to a much lesser degree in APCres cells, whereas inhibition of PERK had minor to no effects (Fig. 7c). In addition, A-92 reduced p-eIF2α levels, increased protein synthesis rates and induced MYC expression in APCdef cells, thereby phenocopying the effects of eIF2B5 depletion (Fig. 7d,e). These effects were less pronounced in response to PKR inhibition (Fig. 7f,g). Importantly, treatment of VillinCreERApcfl/fl or VillinCreERApcfl/flKrasG12D/+ organoids with GCN2 or PKR inhibitors suppressed organoid viability, whereas wild-type organoids were not affected (Fig. 8a,b). Similarly, eight APC-mutated patient-derived organoid lines were sensitive to GCN2 and PKR inhibition (Fig. 8c,d and Extended Data 10a). Furthermore, both inhibitors reduced p-eIF2α levels in three human organoid lines, validating their on-target activity (Extended Data 10b). Finally, combining inhibitors with shRNAs that deplete the kinase not targeted by the inhibitor led to additive effects in apoptosis induction (Extended Data 10c). We concluded that primarily inhibition of GCN2, and to a lesser extent PKR, phenocopies eIF2B5 depletion and suppresses the growth of APC-mutated CRC.
Figure 8. Targeting PKR and GCN2 activity opens a therapeutic window in APC-loss driven CRC.
(a) Growth of murine organoids upon GCN2, PKR or PERK inhibition. Wild-type, VillinCreERApcfl/fl or VillinCreERApcfl/flKrasG12D/+ organoids were grown for 72 h, then treated with A-92, C16 or GSK‘414 for 72 h. DMSO was used as solvent control. Representative pictures of one organoid line of each genotype. Scale bars = 200 μM.
(b) Viability of organoids treated as described in (a) assessed using CellTiter Blue assay. Data show mean of at least four technical replicates (black dots) of one line each, representative of two biologically independent organoid lines per genotype and experiments with similar results.
(c) Growth of one patient-derived organoid line treated with GCN2 (A-92) or PKR (C16) inhibitors. T4 organoid line was grown for two days, and then treated with DMSO, A-92 or C16 for 96 h at the indicated concentrations. Representative pictures from one experiment are shown. Scale bars = 200 μM.
(d) Quantification of viability of eight patient-derived CRC organoid lines assessed by CellTiter Blue assay. Organoids were treated as described in (c). Data show mean ± s.e.m (n = 8 independent organoid lines; T1, T2, T3, T4, T5, T11, T13, T15); unpaired, two-tailed t-test.
(e) Model explaining our findings. A MYC/GCN2/eIF2α negative feedback loop limits protein synthesis to prevent MYC-dependent apoptosis in APC-deficient cells. In APC-proficient cells, transcription of the MYC gene is strongly suppressed, hence the dependence on this negative feedback loop is not shown.
Discussion
Loss of APC increases global translation rates, leading to a MYC-dependent transcriptional upregulation of multiple genes encoding proteins involved in mRNA translation. Using a newly-established APC-deficient CRC cell line that can be induced to re-express full-length APC, we uncovered a negative feedback loop which limits protein synthesis to prevent MYC-dependent apoptosis. We show that this is a vulnerability of APC-deficient CRC cells that can be targeted using small molecules.
Specifically, we found that the survival of APC-deficient cells strictly depends on physiological levels of the translation initiation factor eIF2B5. eIF2B5 depletion reduces the initiation of mRNA translation leading to an ISR that involves a stress-related translation program. In parallel, eIF2B5 depletion enhances MYC translation via a stress-responsive IRES in the 5'-UTR of the MYC mRNA. Induction of apoptosis upon eIF2B5 depletion depends on MYC upregulation; other proteins translated as part of the ISR may also contribute. In culture, eIF2B5 depletion induces apoptosis selectively in APC-deficient cells since loss of APC upregulates MYC mRNA levels [8]. Accordingly, Eif2b5+/- mice show a normal development but a strongly impaired hyperproliferation in response to Apc loss correlating with increased apoptosis.
The eIF2B complex binds tightly to eIF2 when eIF2α is phosphorylated [24], preventing dephosphorylation of eIF2α. In tumour cells, a significant fraction of eIF2α is phosphorylated and hence tightly bound to eIF2B. As a consequence, eIF2B5 depletion leads to increased rather than decreased, overall protein synthesis rates. This increase, in combination with a MYC-driven induction of genes encoding nucleotide biosynthesis enzymes, causes an imbalance in amino acid and nucleotide pools and strains cellular energy resources, leading to activation of AMPK upon eIF2B5 depletion in APC-deficient cells. Activation of AMPK is a critical mediator of MYC-driven apoptosis in epithelial cells [51, 52], suggesting that it contributes to MYC-dependent apoptosis upon eIF2B5 depletion.
Deregulated protein synthesis and the perturbance of amino acid pools activate the GCN2 kinase, which binds uncharged tRNAs in response to decreased amino acid levels and phosphorylates eIF2α [53]. Deregulation of MYC broadly stimulates RNA synthesis by all three RNA polymerases [17], suggesting that GCN2 provides a negative feedback signal that restricts MYC translation to couple MYC-driven RNA synthesis to the availability of amino acids (Fig. 8e). This notion is supported by previous observations implicating GCN2 in the control of MYC translation [54]. MYC also contributes to the activation of PKR and inhibition of PKR partially mimics the phenotype of GCN2 inhibition. Importantly, small molecule inhibitors of GCN2 and, to a lesser degree, of PKR phenocopies eIF2B5 depletion, arguing that inhibitors of either kinase are valid tools for the therapy of APC-deficient CRC. Since transcription of MYC is almost universally deregulated in human tumours, strategies that disrupt the negative MYC/GCN2/eIF2α feedback loop to induce apoptosis may be broadly applicable in human tumours.
Methods
Cell culture and reagents
HEK293T and HCT116 cells were cultivated in DMEM (#41966052, Thermo Fisher Scientific), SW480 and HT29 cells were cultivated in RPMI 1640 (#21875091, Thermo Fisher Scientific), supplemented with 10 % heat-inactivated FBS (#P30-2302, Pan Biotech) and 1% penicillin/streptomycin (#P4333, Sigma). All cell lines were purchased from ATCC. L17 R-spondin-producing cells were maintained in DMEM with 1 mg/ml G418 (#4727878001, Sigma). L17 R-spondin cells were a gift from Owen Sansom (Beatson Institute, Glasgow). All cell lines were authenticated via STR analysis in 2014.
Where specified, the following reagents were added: doxycycline (#D9891, Sigma), tunicamycin (#T7765, Sigma), cycloheximide (#C7698, Sigma), harringtonine (#sc-204771, Santa Cruz Biotechnology), 4-hydroxytamoxifen (#94873, Sigma), poly(I:C) (#tlrl-pic, Invivogen), GSK2606414 (Axon Medchem), A-92 (#2720, Axon Medchem), imidazolo-oxindole PKR inhibitor C16 (#I9785, Sigma).
Lentiviral transduction and transfection
All shRNA experiments were carried out by stable lentiviral transduction. Lentiviruses were generated by transfection of HEK293T cells with LeGO-iG2 or pInducer together with packaging plasmids psPAX.2 and pMD.2G. shRNA sequences for pInducer were from [60]. Plasmids psPAX.2 and pMD2.G were a gift from Didier Trono (Addgene plasmid # 12260; http://n2t.net/addgene:12260; RRID: Addgene_12260 and Addgene plasmid # 12259; http://n2t.net/addgene:12259; RRID: Addgene_12259). LeGO-iG2 was a gift from Boris Fehse (Addgene plasmid # 27341; http://n2t.net/addgene:27341; RRID:Addgene_27341) [61]. shRNA sequences are listed in Supplementary Table 5. Infections were carried out using 8 μg/ml polybrene (#107689, Sigma). Two days after infection, cells were selected with 5 μg/ml blasticidin (#ant-bl, Invivogen), 2 μg/ml puromycin (#ant-pr, Invivogen) or 600 μg/ml hygromycin (#ant-hg, Invivogen), and pools of selected cells were used for downstream analyses. For transient depletion experiments, cells were transfected with siRNAs (Dharmacon) using Lipofectamine RNAiMAX (#13778030, Thermo Fisher Scientific) according to the manufacturer´s instructions. siRNA sequences are listed in Supplementary Table 6.
Fluorescence-activated cell sorting (FACS) and cell staining
Crystal violet staining was carried out using 0.1% crystal violet in 20% ethanol. Propidium iodide (PI) and annexin V/PI FACS analysis was performed as previously described [62].
shRNA-resistant EIF2B5mut-HA overexpression
The EIF2B5 coding sequence with an N-terminal HA-tag was designed such, that it was resistant to knockdown by shEIF2B5 #1 and shEIF2B5 #3. Therefore, six silent mutations were introduced into the targeting sequence of shEIF2B5 #3 (5’-tgcatgtcaccgcaaaagagta-3’). shEIF2B5 #1 targets the 3’UTR of EIF2B5. This construct was integrated into a lentiviral overexpression vector pLV-Bsd_SV40 (VectorBuilder).
Generation of SW480TetOnAPC cells
For stable expression of the Tet activator, SW480 cells were transfected with pTet-On Advanced (Clontech #631018) and selected with 800 μg/ml G418. A single cell clone was selected using a luciferase reporter assay (SW480TetOn). The APC coding sequence (from plasmid pSAR-MT-APC, a gift from Bert Vogelstein (Addgene plasmid #16487; http://n2t.net/addgene:16487; RRID:Addgene_16487), was ligated into the pTRE2pur (Clontech #631013) yielding pTRE2purAPC. The correct sequence and orientation were verified by Sanger sequencing (LGC Genomics). SW480TetOn cells were transfected with pTRE2purAPC, selected with 2 μg/ml puromycin and single cell clones were generated (SW480TetOnAPC) (see Extended Data 1a). For induction of APC expression, cells were treated with 0.5 μg/ml doxycycline.
CRISPR/Cas9-mediated deletion of the MYC IRES
Short guide (sg) RNAs targeting the MYC 5’UTR (c11, b2; see Extended Data 5b) were designed [63]. The following sgRNA sequences were used: c11_forward 5’-caccgctgtagtaattccagcgag-3’, c11_reverse 5’-aaacctcgctggaattactacagc-3’, b2_forward 5’-caccgcagaatagcctccccgcgt-3’, b2_reverse 5’-aaacacgcggggaggctattctg-3’. Complementary oligonucleotides were annealed and inserted into pSpCas9(BB)-2A-GFP (PX458). pSpCas9(BB)-2A-GFP (PX458) was a gift from Feng Zhang (Addgene plasmid #48138; http://n2t.net/addgene:48138; RRID:Addgene_48138) [63]. For transient expression of Cas9 and sgRNAs, SW480TetOnAPC cells were transfected with the pX458 constructs and selected for GFP-positive cells. Single cell clones were isolated and screened for a 200 bp deletion via PCR with specific primers (for: gaagggcagggcttctcag; rev: gcattcgactcatctcagcatt).
Anchorage-independent growth
6-well plates were coated with 500 μl poly-HEMA (20 mg/ml in ethanol), plates were washed with PBS. Then, 5% methylcellulose was added to 65 °C preheated medium, diluted to a 2% solution with DMEM and cooled down. An aliquot of the solution was centrifuged for 15 min at 3500 rpm, then 500 μl methylcellulose supernatant was mixed with 500 μl DMEM containing 1000 cells and transferred to coated 6-well plates. The number of colonies was counted and colony size was assessed using ImageJ.
DECIPHER shRNA library screen
9 x 10⁷ SW480TetOnAPC cells were infected with the DECIPHER shRNA Library Module I (Cellecta) at a MOI of 0.7. Cells were treated with 0.5 μg/ml doxycycline or ethanol 12 h post-infection. Cells were cultured for 15 days, split every third day and re-seeded. Aliquots of cells were flash-frozen in liquid nitrogen. On day 15, cells were harvested and genomic DNA was isolated by adding 5 ml resuspension buffer R3 including RNase A (#K210007, PureLink™ HiPure Plasmid purification kit, Invitrogen) and 250 μl of 10% SDS. After 5 min incubation at room temperature, DNA was sheared using ultrasound at 20% amplitude for 5 s with a sonifier (Branson); then, 5 ml phenol-chloroform-isoamylalcohol (25/24/1) was added. After centrifugation for 60 min at 8700 rpm, the upper phase was transferred to a new tube, then 0.5 ml of 3 M sodium acetate, 50 μg/ml of Glycoblue™ (#AM9515, Thermo Fisher Scientific) and an equal volume of isopropanol were added. After incubation overnight at 4 °C, the solution was centrifuged at 8700 rpm at 4 °C for 30 min. The DNA pellet was washed with 70% ethanol and then resuspended in injection-grade water at a final concentration of 2 mg/ml.
shRNA-specific barcodes were amplified from the genomic DNA by PCR with first-round amplification primers (forward 5’-caagcaaaagacggcatacgaga-3’ and reverse 3’-ggttcagagttctacagtccgaaacc-5’). Custom barcodes were added using second-round amplification primers (forward 5’-caagcagaagacggcatacgaga-3’ and 3’ aatgatacggcgaccaccgagaXXXggttcagagttctacagtccgaaacc-5’, XXX individual 3 bp index) and the following PCR master mix: 2 μl of first-round PCR product, 2.5 mM MgCl2, 2.5 μl of 10 μM primer (forward and reverse), 1 μl of 10 mM dNTPs, 10 μl of HF buffer, 0.5 μl of Phusion polymerase (#F530S, Thermo Fisher Scientific), and 50 μl of water. Thermal profile was: 98 °C 2 min, 16 repeats of 98 °C 30 s, 65 °C 10 s, 72 °C 10 s, final elongation of 68 °C 2 min. The final PCR product was purified by agarose gel electrophoresis (142 bp product was excised) and subsequent DNA purification (#K0691, GeneJet Gel Extraction Kit, Thermo Fisher Scientific). Samples were pooled and sequenced on an Illumina GenomeAnalyzer IIx following the manufacturer’s recommendations. Data were analysed using edgeR [64] implemented in the Galaxy project platform [65].
Immunofluorescence staining and high-content imaging
Cells were cultivated in 96-well plates and fixed in 3.7% PFA for 10 min. After washing with PBS, cells were permeabilized with 0.2% Triton X-100/PBS and blocked in 3% BSA/PBS. After washing with PBS, nuclei were stained with 2.5 μg/ml Hoechst 33342 (#14533, Sigma) for 5 min. Images were acquired using the Operetta™ High-Content Screening System (PerkinElmer) with the following settings: objective: 20 x WD; optical mode: non-confocal; excitation: 50%. Ten images per well were acquired and analysis was performed with the HarmonyR High-Content Imaging and Analysis Software (PerkinElmer).
35S-methionine labelling and immunoprecipitation
Cells were cultured in methionine-free medium (#R7513, Sigma) supplemented with 10% dialyzed FBS (#F0392, Sigma) and 1% GlutaMAX™ (#35050061, ThermoFisher) for 30 min. 1 μCi/ml of 35S-methionine (#SCIS-103, Hartmann Analytic) was added for 1 h. After NaOH-mediated cell lysis and TCA precipitation, incorporated 35S-methionine was measured by scintillation counting using a 300 SL counter (Hidex). Counts were normalised to protein concentration. Pulse labelling following immunoprecipitation of MYC was performed as described previously [66].
Analysis of 35S-methionine incorporation in organoids was performed as described previously [11].
Polysome profiling and harringtonine run-off
Polysome profiling was performed as described previously [16].
For run-off assay, cells were treated with 2 μg/ml harringtonine for 0 s or 180 s, before adding 100 μg/ml cycloheximide for 3 minutes.
Preparation of cell extracts for LC-MS (liquid chromatography-mass spectrometry) analysis
Strata® C18-E (100 mg/1 ml columns) (Phenomenex) were activated with 1 ml CH3CN (#100030, Merck) and equilibrated with 1 ml MeOH/H2O (80/20). 106 cells were washed with 154 mM NH4OAc (#101116, Merck). After harvest, 500 μl of 10 μM lamivudine in MeOH/H2O (80/20) was added and samples were sonicated in an ultrasound water bath. After centrifugation for 2 min at 14,000 rpm, supernatants were transferred to equilibrated Strata® C18-E columns and eluates were collected. Pellets of the centrifuged cell extracts were resuspended in 500 μl MeOH/H2O (80/20), centrifuged and the supernatant transferred to the respective Strata® columns. The combined eluates were evaporated using a SpeedVac.
LC-MS analysis
Dry cell extracts were dissolved in 250 μl CH3CN/5 mM NH4OAc (95/5) for amino acid analysis or in 100 μl CH3CN/5 mM NH4OAc (25/75) for nucleotide analysis. Mobile phase A consisted of 5 mM NH4OAc in CH3CN/H2O (95/5), mobile phase B consisted of 5 mM NH4OAc in acetonitrile/water (5/95). Samples were applied to the RSLC HILIC column (2.2 μM particles, 50 x 2.1 mm; Thermo Fisher Scientific) at 30 °C. Analysis was done using a Dionex Ultimate 3000 UHPLC system hyphenated with a Q Exactive mass spectrometer (QE-MS) equipped with a HESI probe (Thermo Fisher Scientific). The LC gradient program was: 0% solvent B for 1 min, a linear increase to 40% solvent B within 5 min, then maintaining 40% B for 13 min, returning to 0% B in 1 min and 5 min 0% solvent B for column equilibration before each injection. The flow rate was maintained at 350 μl/min, the eluent was directed to the electrospray ionization (ESI) source of the QE-MS. MS parameters: Heater temperature, 120 °C; sheath gas, 30; auxiliary gas, 10; sweep gas, 3; spray voltage, 3.6 kV; capillary temperature, 320 °C; S-lens, 55. A full scan range from 72 to 244 m/z (mass-to-charge ratio) for amino acid analysis or 317 to 550 m/z for nucleotide analysis with alternating ion modes was used. The resolution was set to 70000. The maximum injection time was 200 ms. Peaks corresponding to the calculated masses (multiple ion monitoring (MIM) +/- H+ ± 2 mmU) were integrated using TraceFinder™ software (Thermo Fisher Scientific).
Immunoblotting
Cells were lysed in RIPA buffer (50 mM Tris pH 7.5, 150 mM NaCl, 1% NP-40, 0.5% DOC, 0.1% SDS) containing protease inhibitors (#P8340, Sigma) and phosphatase inhibitors (#P5726, #P0044, Sigma). Cleared protein lysates were separated by SDS-PAGE and transferred to a PVDF membrane (Millipore). Images were taken using LAS3000 imager (Fuji). All primary antibodies are listed in Supplementary Table 7.
RNA isolation, quantitative PCR (qPCR) and RNA-sequencing
RNA isolation, qPCR and RNA sequencing were performed as described previously [62]. Primers used for qPCR are listed in Supplementary Table 8.
RNA-sequencing library quality and concentration were determined using the Experion™ chip electrophoresis system (Bio-Rad). Libraries were sequenced on an Illumina Genome Analyzer IIx following the manufacturer’s instructions.
For RNA-sequencing analysis, reads were aligned to the human genome (hg19) with Bowtie v0.12.8 using default parameters. Mapped reads per gene (Ensembl GRCh37, release 74) were counted using the “summarizeOverlaps” function in the GenomicAlignments R package. Non-expressed genes were removed (mean read count per gene over all samples >1) and TMM normalisation was performed with EdgeR. GSEA was performed with the C2, C5 and Hallmark collections from the MSigDB v6.0 with default parameters and 1000 permutations.
eIF2α immunoprecipitation (IP)
Cells were lysed in lysis buffer (50 mM Tris pH 7.4, 150 mM NaCl, 2 mM MgOAc, 0.1% NP-40, 1 mM DTT, protease and phosphatase inhibitors) and sonified (3 x 10 s pulse, 20% amplitude). 20 μl Protein A-coupled Dynabeads (#10001D, Thermo Fisher Scientific) per IP were washed in blocking solution (5 mg/ml BSA/PBS) and 2 μg of eIF2α antibody (Bethyl A300-721A) or non-specific rabbit IgG antibody were coupled to the beads overnight at 4 °C. Antibody-coupled beads were incubated with 1 mg protein lysate overnight at 4 °C. Beads were washed five times with lysis buffer. Eluates were boiled with 40 μl 2 x SDS Laemmli buffer for subsequent SDS-PAGE and immunoblotting; 2-5% of the lysate was loaded as input.
Mouse experiments
All experiments were performed in accordance with UK Home Office regulations under licence 70/8646, which undergoes local ethical review at Glasgow University. Male and female C57BL/6J mice were used for induction (>20 g from 6 to 12 weeks of age). The alleles used were as follows: VillinCreER, Apc580S, KrasG12D and ApcMin [45–47, 67]. Acute recombination in the conditional alleles was induced using a single intraperitoneal injection of 80 mg/kg tamoxifen for two consecutive days and mice were sacrificed four days post-induction. If a KrasG12D allele was present, recombination was induced using a single intraperitoneal injection of 80 mg/kg tamoxifen and mice were sacrificed three days post-induction. ApcMin/+ mice were aged until they showed clinical signs (anaemia, hunching and/or weight loss). The study is compliant with all relevant ethical regulations regarding animal research.
Generation of Eif2b5+/- mice
An ES cell clone (EPD0116_1_G09; a subclone of the JM8.N4 ES cell line) carrying a targeted knockout-first, conditional-ready allele of Eif2b5 (Eif2b5tm1a(EUCOMM)Wtsi) was imported from the International Mouse Phenotyping Consortium (IMPC). Genomic DNA from the imported cell line was initially analysed for appropriate insertion of the targeting vector by PCR screening on both the 5’ and 3’ sides (5’: CTTCTCAGATCTGTGTTGTTAGTGTAGC and CACAACGGGTTCTTCTGTTAGTCC; 5.3 kb. 3’: CATGTCTGGATCCGGGGGTACCGCGTCGAG and CACTCTCTGCAGTACCAGGAGTGCATGGC; 7.6 kb). The presence of the isolated 3’ loxP was also confirmed by screening (TGGAGAGGTGGTTGAGATGG and CCTGGTGCTGGGACTGTAAG; 303 bp). Mouse lines were generated by microinjection of the ES cells into BALB/c blastocysts. After transfer of the injected embryos into pseudopregnant CD-1 females, chimeric offspring were identified by their black coat color and were backcrossed to C57BL6/J. Germline offspring were again identified by their black coat color and the inheritance of the modified allele was confirmed with the 3’ loxP primers described above.
Heterozygous Eif2b5+/tm1a(EUCOMM)Wtsi (hereafter designated as Eif2b5+/-) were subsequently crossed with a mouse line expressing FLPe (Tg(ACTFLPe)9205Dym) to delete the selectable marker cassette by recombination at the FRT sites. This generated the conditional allele (Eif2b5tm1c(EUCOMM)Wtsi) with loxP sites flanking exons 3 to 7 of the Eif2b5 gene. Appropriate deletion of the cassette was verified by PCR (using primers TTAGTTTCAAGCCCACAGTAAGTTC and CTTTAAACACCGTAACATGGAAAAC; 318 bp).
In accordance with the 3Rs, the smallest sample size was chosen that could give a significant difference. Given the robust phenotypes of the Apcfl/fl model, and our prediction that Eif2b5 was essential, the minimum sample size assuming no overlap in control versus experimental is three animals per group. No randomization was used and the experimenter was blinded to genotypes.
Immunohistochemistry (IHC)
IHC was performed on formalin-fixed intestinal sections (proximal 10 cm) using standard techniques. All primary antibodies are listed in Supplementary Table 7. Staining was performed on at least four mice of each genotype. Representative images are shown for each staining.
Assaying apoptosis, proliferation, and crypt length
Cleaved caspase-3 levels were assessed by counting the number of cleaved caspase-3-positive cells per crypt. 25 crypts were scored from at least five mice from each genotype. Cell proliferation was assessed by measuring BrdU incorporation. Mice were intraperitoneally injected with 250 μl of BrdU (Amersham Biosciences) 2 h before being sacrificed. For analysis of BrdU-positive cells, 25 half crypts were scored from at least four mice of each genotype.
Image analysis
For the quantification of MYC staining, intestinal slides were scanned on an SCN400 F slide scanner (Leica) and analysed in HALO™ v2.0 Image Analysis Software (Indica Labs). Areas were identified as epithelium, then individual crypts were manually scored for the percentage of epithelial cells exhibiting nuclear MYC staining. For each condition, 25 full crypts were scored from at least four mice of each genotype.
Epithelial extraction
Isolation of small intestinal crypts for immunoblotting was performed as described previously [11].
Crypt culture
Small intestines were isolated from wild-type, VillinCreERApcfl/fl or VillinCreERApcfl/flKrasG12D/+ mice. Wild-type or VillinCreERApcfl/fl mice were sacrificed four days post-induction, whereas VillinCreERApcfl/flKrasG12D/+ mice were sacrificed three days post-induction. Small intestines were isolated, opened longitudinally and washed with PBS. Crypts were isolated and propagated as previously described [44].
Patient-derived intestinal organoid culture
Isolation and culture of patient-derived organoids (T1-T6) was approved by the ethic committee of the University of Würzburg (#142/16-ge). All patients gave written consent prior to surgery. Organoid isolation and culture were performed as described elsewhere [68]. T11, T13, T15 patient-derived organoids have been previously described [68]. The study is compliant with all relevant ethical regulations regarding research involving human participants.
Viability assay of murine and patient-derived organoids
For analysis of viability of murine organoids, organoids were mechanically disrupted and centrifuged at 800 rpm for 3 min. The cell pellet was resuspended in 1 ml TrpLE™ Express (#12604013, Thermo Fisher Scientific) with 100-200 U DNAse (#4716728001, Sigma) for 1 h at 37 °C. Cells were passed through a 40 μM strainer and single cells were counted and then seeded 10,000 cells/well (VillinCreERApcfl/flKrasG12D/+) or 30,000 cells/well (VillinCreERApcfl/fl) [45–47] in 50 μl Matrigel/PBS (1:1 mixture) in a 96-well plate. Drugs were added three days post-seeding, viability assayed six days post-seeding using CellTiter-Blue (#G8080, Promega). For analysis of patient-derived organoids and wild-type murine organoids, organoids were dissociated by mechanical disruption and seeded in 96-well plates. Drugs were added two days post-seeding and viability was assayed using CellTiter-Blue.
Panel sequencing of patient-derived organoids
DNA was extracted using the QIAamp DNA Mini Kit (#51304, Qiagen). Libraries were prepared with the Ion AmpliSeq Cancer Hotspot Panel v2 (#4475346, Thermo Fisher Scientific) and the Ion AmpliSeq Library Kit 2.0 (#4475345, Thermo Fisher Scientific). Libraries were templated and enriched with the Ion OneTouch 2 and the Ion OneTouch ES automated systems (Thermo Fisher Scientific). Sequencing was performed using semiconductor-sequencing technology (Ion PGM). Data were analysed using the Torrent Server VariantCaller version 5.6 and the Ion Reporter version 5.6 (Thermo Fisher Scientific). Results of the panel sequencing are listed in Supplementary Table 9.
Ribosomal profiling
Ribosomal profiling (Ribo-seq) was performed using the ARTseq-TM Ribosome Profiling kit from Illumina (#RPHMR12126, Illumina) according to the manufacturer's instructions [30]. For final amplification of the library, 12 PCR cycles were run with subsequent library purification. The quality and quantity of the samples were determined using a Fragment Analyzer (Advanced Analytical Technologies).
Reads were mapped against the human genome (hg38) using STAR [69] and processed based on annotations from Ensembl (v86). A generative model was fitted to the observed positions of annotated codons in strongly translated ORFs. Translated ORFs were determined and each ORF was quantified using the number of reads mapped to its codons.
For corresponding RNA-sequencing analysis, reads were mapped against the human genome (hg38) using STAR. Then, reads per gene were counted when they were consistent with at least one transcript annotated in Ensembl v86.
Statistics and Reproducibility
For in vitro experiments, at least three biologically independent experiments were performed unless stated otherwise. As indicated in the figure legends, data are presented as mean ± s.d. or s.e.m of three biologically independent experiments or samples, or as one representative analysis ± s.d. or s.e.m. Statistical analyses were performed using Prism 8 (GraphPad), Excel (Microsoft) and R. Statistical significance was tested by unpaired, two-tailed Student’s t-test, one-tailed Mann-Whitney U, one-way ANOVA or Log rank test as indicated in the figure legends. A P value less than 0.05 was considered statistically significant.
Extended Data
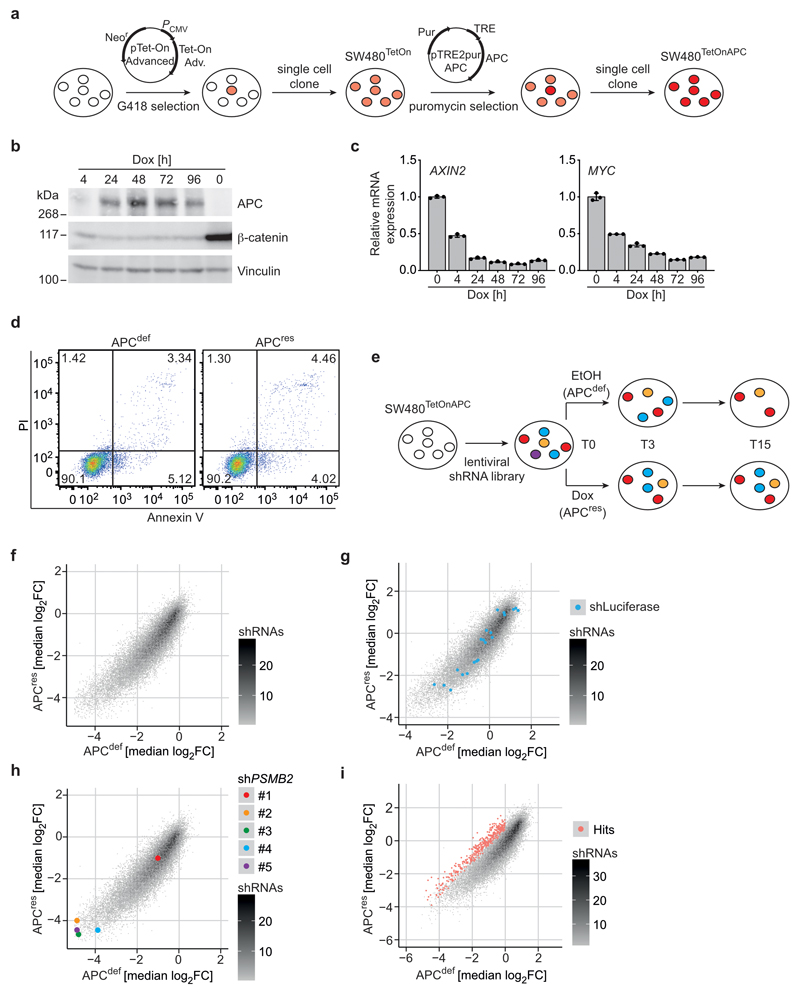
Extended Data Fig. 1. An shRNA screen identifies eIF2B5 as a survival factor in APCdef cells.
(a) Diagram illustrating the generation of SW480TetOnAPC cells.
(b) Immunoblot of APCdef (ethanol) and APCres cells (doxycycline for the indicated time points), representative of two independent experiments with similar results.
(c) Relative mRNA expression of AXIN2 and MYC determined via qPCR treated as described in (a). Data show mean ± s.d. (n = 3 technical replicates), representative of two independent experiments with similar results.
(d) Annexin V/PI FACS analysis of APCdef and APCres cells (72 h ethanol or doxycycline, respectively), representative of three independent experiments with similar results. Numbers represent percentage of cells in each quadrant.
(e) Outline of shRNA screen. T0, T3 and T15 indicate time points (days) when cells were harvested for library preparation.
(f) Plot showing median log2 fold change of all shRNAs included in the screen in APCres versus APCdef cells (n = 3 biologically independent experiments).
(g) Plot showing median log2 fold change as described in (f) with shRNAs targeting luciferase displayed in blue.
(h) Plot showing median log2 fold change as described in (f) with shRNAs targeting PSMB2 displayed in colour.
(i) Plot showing median log2 fold change as described in (f) with shRNAs identified as specifically depleted in APCdef cells displayed in red.
Unprocessed immunoblots are shown in Source Data Extended Data 1.
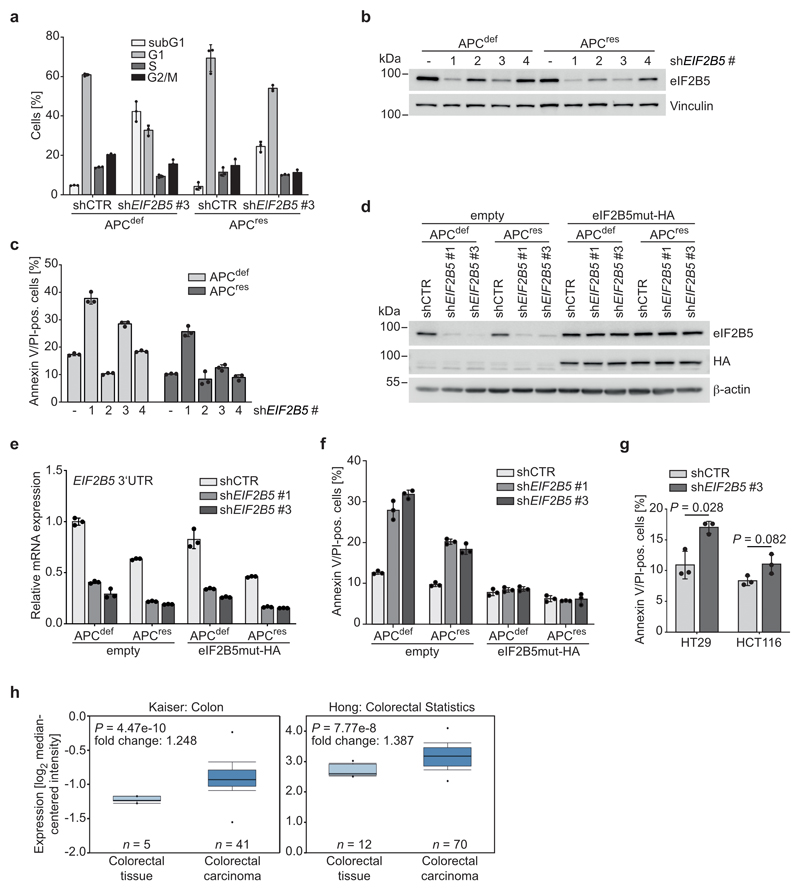
Extended Data Fig. 2. Apoptosis induction upon eIF2B5 knockdown in APCdef cells is an on-target effect.
(a) PI cell cycle FACS analysis of shCTR-transduced or eIF2B5-depleted APCdef and APCres cells (six days ethanol or doxycycline, respectively). Data show mean ± s.d. (n = 3 technical replicates), representative of two independent experiments with similar results.
(b) Immunoblot of shCTR-transduced (-) or eIF2B5-depleted APCdef and APCres cells (96 h ethanol or doxycycline, respectively), representative of two independent experiments with similar results.
(c) Annexin V/PI FACS analysis of shCTR-transduced (-) or eIF2B5-depleted APCdef and APCres cells treated as described in (b). Data show mean ± s.d. (n = 3 technical replicates), representative of two independent experiments with similar results.
(d) Immunoblot of control (“empty”) and eIF2B5mut-HA overexpressing shCTR-transduced or eIF2B5-depleted APCdef and APCres cells (96 h ethanol or doxycycline, respectively), representative of two independent experiments with similar results.
(e) mRNA expression of endogenous EIF2B5 of cells described in (d). Primers targeting the EIF2B5 3’UTR were used. Data show mean ± s.d. (n = 3 technical replicates), representative of two independent experiments with similar results.
(f) Annexin V/PI FACS analysis of cells described in (d). Data show mean ± s.d. (n = 3 technical replicates), representative of two independent experiments with similar results.
(g) Annexin V/PI FACS analysis of shCTR-transduced or eIF2B5-depleted HT29 and HCT116 cells. Data show mean ± s.d. (n = 3 biologically independent experiments); unpaired, two-tailed t-test.
(h) Box plots of EIF2B5 mRNA expression in normal colorectal tissue and colorectal carcinoma of two independent datasets from Oncomine (n = number of biologically independent samples). Data sets are taken from “Kaiser” [56]; “Hong” [57]. Points: minimum and maximum, whiskers: 10th and 90th percentile, box: 25th and 75th percentile, line: median; unpaired t-test.
Unprocessed immunoblots are shown in Source Data Extended Data 2.
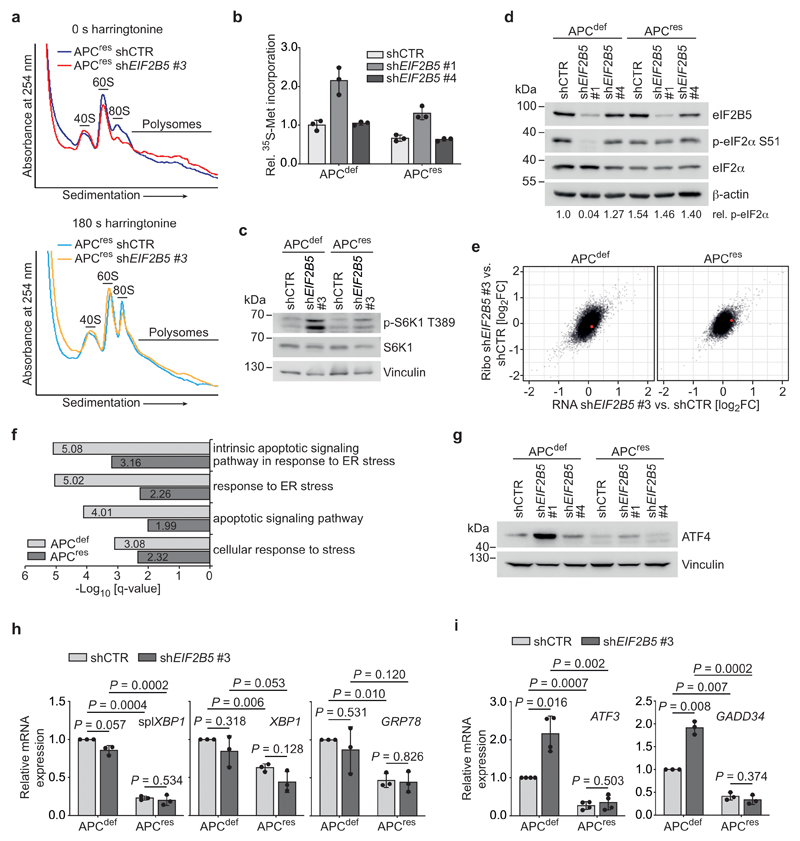
Extended Data Fig. 3. eIF2B5 depletion induces an ISR.
(a) Polysome profiling of shCTR-transduced and eIF2B5-depleted APCres cells (72 h doxycycline) incubated with harringtonine for 0 s (upper) and 180 s (lower). Data (0 s harringtonine) are representative of three independent experiments with similar results, 180 s harringtonine assay was performed once.
(b) 35S-methionine labelling of shCTR-transduced or eIF2B5-depleted APCdef and APCres cells (96 h ethanol or doxycycline, respectively). Incorporated radioactivity was measured by scintillation counting. Data represent mean ± s.d. (n = 3 technical replicates), representative of two independent experiments with similar results.
(c) Immunoblots of cells described in (b), representative of two independent experiments with similar results.
(d) Immunoblots of cells described in (b), representative of two independent experiments with similar results. p-eIF2α S51 levels, relative to total eIF2α, are shown below the immunoblot.
(e) Plots documenting mean log2 fold change of total mRNA (x-axis, “RNA”) and ribosome-associated mRNA (y-axis, “Ribo”) of eIF2B5-depleted APCdef and APCres cells (96 h ethanol or doxycycline, respectively). MYC is highlighted in red (n = 3 biologically independent experiments).
(f) Gene ontology (GO) analyses of ribosomal profiling data from (e). P values, adjusted for multiple testing, are shown for over-representation of GO terms among genes upregulated after eIF2B5 knockdown in APCdef and APCres cells. P values were calculated using GOrilla [58, 59].
(g) Immunoblot of cells as described in (b), representative of two independent experiments with similar results.
(h) mRNA expression of spliced XBP1, GRP78 and unspliced XBP1 of cells described in (b). Data show mean ± s.d. (n = 3 biologically independent experiments); unpaired, two-tailed t-test.
(i) mRNA expression of ATF3 and GADD34 of cells described in (b). Data show mean ± s.d. (ATF3 n = 4, GADD34 n = 3 biologically independent experiments); unpaired, two-tailed t-test.
Unprocessed immunoblots are shown in Source Data Extended Data 3.
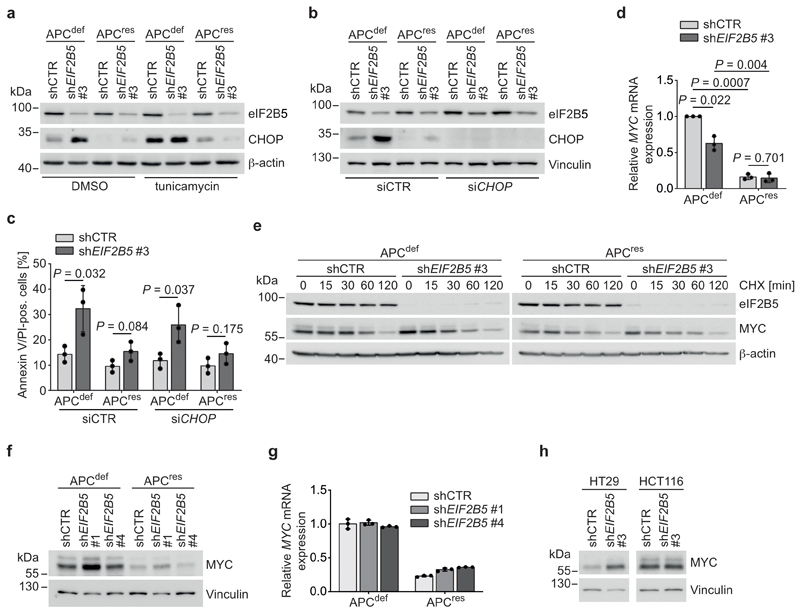
Extended Data Fig. 4. The ISR induced by eIF2B5 depletion is MYC-dependent.
(a) Immunoblot of shCTR-transduced or eIF2B5-depleted APCdef and APCres cells (96 h ethanol or doxycycline, respectively), representative of two independent experiments with similar results. For ISR induction, cells were treated with 1 μg/ml tunicamycin (3 h), DMSO was used as solvent control.
(b) Immunoblot of shCTR-transduced or eIF2B5-depleted APCdef and APCres cells upon CHOP depletion (96 h ethanol or doxycycline, respectively), representative of three independent experiments with similar results. siRNA transfections were carried out using siCTR as non-targeting control or siCHOP for 72 h.
(c) Annexin V/PI FACS analysis of cells treated as described in (b). Data show mean ± s.d. (n = 3 biologically independent experiments); unpaired, two-tailed t-test.
(d) qPCR documenting MYC expression in shCTR-transduced or eIF2B5-depleted APCdef and APCres cells (96 h ethanol or doxycycline, respectively). Data show mean ± s.d. (n = 3 biologically independent experiments); unpaired, two-tailed t-test.
(e) Immunoblot of shCTR-transduced or eIF2B5-depleted APCdef and APCres cells (72 h ethanol or doxycycline, respectively) after cycloheximide (CHX) pulse chase. Experiment was performed once. Cells were treated with 100 μg/ml CHX for the indicated time points.
(f) Immunoblot of shCTR-transduced or eIF2B5-depleted APCdef and APCres cells (72 h ethanol or doxycycline, respectively), representative of three independent experiments with similar results.
(g) qPCR documenting MYC expression in shCTR-transduced or eIF2B5-depleted APCdef and APCres cells treated as described in (f). Data represent mean ± s.d. (n = 3 technical replicates), representative of two independent experiments with similar results.
(h) Immunoblot of shCTR-transduced or eIF2B5-depleted HT29 and HCT116 cells, representative of two independent experiments with similar results.
Unprocessed immunoblots are shown in Source Data Extended Data 4.
Extended Data Fig. 5. eIF2B5 depletion regulates IRES-mediated translation of MYC.
(a) Immunoblot of SW480 cells after DMSO (-) or cymarine (+) treatment (100 nM, 24 h), representative of two independent experiments with similar results. Quantification of MYC, Cyclin E and c-Fos, relative to Vinculin, is shown below the immunoblot.
(b) Schematic diagram of the MYC IRES sequence. Position of used sgRNAs for deletion of the IRES as well as primers for detection by PCR and expected size of the PCR products are indicated.
(c) Agarose gel electrophoresis of PCR products from MYC IRES undeleted (CTR) and deleted (sgMYC IRES) cells. The primer pair used is shown in (b). PCR was performed once as control for deletion.
(d) Immunoblot of control (CTR) and MYC IRES deleted (sgMYC IRES) APCdef and APCres cells, transduced with shCTR or shEIF2B5 #3 (72 h ethanol or doxycycline, respectively), representative of two independent experiments with similar results.
(e) mRNA expression of ATF3 and GADD34 in shCTR and eIF2B5-depleted APCdef and APCres cells upon MYC depletion (96 h ethanol or doxycycline, respectively). siRNA transfections were carried out using siCTR as non-targeting control or siMYC for 72 h. Data represent mean ± s.d. (n = 3 technical replicates), representative of two independent experiments with similar results.
Unprocessed immunoblots are shown in Source Data Extended Data 5.
Extended Data Fig. 6. eIF2B5 depletion suppresses growth of Apc-deleted murine organoids and patient-derived organoids.
(a) Immunoblot of wild-type, VillinCreERApcfl/fl and VillinCreERApcfl/flKrasG12D/+ murine intestinal organoids. Immunoblot was performed once.
(b) mRNA expression of Eif2b5 in wild-type, VillinCreERApcfl/fl and VillinCreERApcfl/flKrasG12D/+ murine intestinal organoids infected with a doxycycline-inducible shRNA targeting Eif2b5. Organoids were treated with ethanol as solvent control or 1 μg/ml doxycycline for 72 h. Data represent mean ± s.d. (n = 3 technical replicates), representative of two independent experiments with similar results.
(c) Growth of murine intestinal organoids (wild-type, VillinCreERApcfl/fl and VillinCreERApcfl/flKrasG12D/+) as described in (b). Single cells were seeded and one day later treated with ethanol or 1 μg/ml doxycycline for six days. A representative picture is shown for each genotype. Scale bars = 200 μM.
(d) Size of murine intestinal organoids from (c). Data represent mean ± s.e.m. (at least n = 9 biologically independent samples). Whiskers: minimum and maximum, box: 25th and 75th percentile, line: median; unpaired, two-tailed t-test.
(e) Growth of shNTC-transduced or eIF2B5-depleted patient-derived CRC organoids, representative of three independent experiments with similar results. Six patient-derived organoid (T1-T5: APC-mutated; T6: APC wild-type) lines were infected with a doxycycline-inducible non-targeting control (shNTC) or an shRNA targeting EIF2B5. Organoids were treated with ethanol or 1 μg/ml doxycycline for six to seven days. Scale bars = 200 μM.
(f) Quantification of viability of shNTC-transduced or eIF2B5-depleted patient-derived CRC organoids (T1, T2, T3, T4, T5) from (e). Data show mean ± s.e.m. (n = 5 biologically independent organoid lines); unpaired, two-tailed t-test.
(g) Immunoblot of one patient-derived CRC organoid (T4) infected and treated as described in (e), representative of two independent experiments with similar results.
Unprocessed immunoblots are shown in Source Data Extended Data 6.
Extended Data Fig. 7. Eif2b5 heterozygosity suppresses hyperproliferation upon loss of Apc in colon.
(a) Illustration of generation of Eif2b5 knockout mice used in the study.
(b) Immunohistochemical AB/PAS and lysozyme staining of wild-type and Eif2b5+/- mice in small intestinal and colon tissue, representative of three biologically independent mice of each genotype with similar results (n = 3). AB/PAS staining represents goblet cells, lysozyme staining represents Paneth cells. Scale bars = 50 μm.
(c) Immunoblot of intestinal epithelial extracts from mice of the indicated genotypes. Each lane represents one separate mouse from the relevant group (left). Immunoblot was performed once. Quantification of eIF2B5 protein levels, normalised to (γ-tubulin (right). Data show mean ± s.d. (n = 3 biologically independent mice); one-tailed Mann-Whitney U test.
(d) Representative H&E-, eIF2B5-, p-eIF2α S51-, BrdU-, cleaved caspase 3- and MYC-stained sections of colons from mice of the indicated genotypes. Scale bars = 100 μm.
(e) Graphs documenting the number of cells positive for BrdU, cleaved caspase 3, and MYC in immunostained colon sections from mice of the indicated genotypes. The number of BrdU-positive cells per half crypt (top panel), and the number of cells per full crypt staining positive for cleaved caspase 3 (middle panel) or MYC (bottom panel), were scored in 25 crypts per mouse in at least four biologically independent mice (n = 4 for BrdU staining of VillinCreERApcfl/flEif2b5+/- and VillinCreERApcfl/flKrasG12D/+, n = 5 for cleaved caspase 3 staining of VillinCreERApcfl/flEif2b5+/- and VillinCreERApcfl/flKrasG12D/+Eif2b5+/-, n = 4 for MYC staining of VillinCreERApcfl/flKrasG12D/+, n = 5 for MYC staining of wild-type, Eif2b5+/- and VillinCreERApcfl/fl, n = 6 for all other stainings and genotypes). Data show mean ± s.e.m.; one-tailed Mann-Whitney U or one-way ANOVA test.
Unprocessed immunoblots are shown in Source Data Extended Data 7.
Extended Data Fig. 8. Eif2b5 is haplo-insufficient for intestinal tumourigenesis driven by Apc loss.
(a) Immunohistochemical staining of eIF2B5 in ApcMin/+ and ApcMin/+Eif2b5+/- small intestines, representative of three biologically independent mice each with similar results. Scale bars = 100 μm.
(b) Kaplan-Meier curve of ApcMin/+ (n = 14 biologically independent mice) compared with ApcMin/+Eif2b5+/- (n = 13 biologically independent mice) mice. One of the ApcMin/+ mice was censored due to a mammary tumour. P value was calculated using a Log-rank test.
(c) Immunoblot of organoids established from outgrowing tumours of ApcMin/+ and ApcMin/+Eif2b5+/- mice. Each lane represents one mouse (ApcMin/+ n = 3, ApcMin/+Eif2b5+/- n = 2 biologically independent mice). Immunoblot was performed once.
(d) Quantification of eIF2B5 levels, relative to β-actin, and p-eIF2α S51 levels, relative to total eIF2α, of organoids described in (c). Data show mean ± s.d. (ApcMin/+ n = 3, ApcMin/+Eif2b5+/- n = 2 biologically independent mice).
(e) 35S-methionine labelling of organoids described in (c). Incorporated radioactivity was measured by scintillation counting. Data show mean of ± s.d. (n = 3 biologically independent mice); one-tailed Mann Whitney U test.
(f) Quantification of polysome to sub-polysome fractions in polysome profiles from organoids described in (c). Data show mean of ± s.d. (n = 3 biologically independent mice); one-tailed Mann Whitney U test.
(g) Graphs documenting the number of BrdU-positive cells per half crypt, and number of MYC-positive cells per full crypt from mice of the indicated genotypes in the small intestine. Data were scored in 25 crypts per mouse. Data show mean ± s.e.m. (n = 3 biologically independent mice); one-tailed Mann Whitney U test.
(h) Representative H&E-, BrdU-, eIF2B5- and MYC-stained sections of small intestines from mice of the indicated genotypes. Mice were sampled four days post-induction. Scale bars = 100 μM.
Unprocessed immunoblots are shown in Source Data Extended Data 8.
Extended Data Fig. 9. Depletion of PKR and GCN2 kinase is compensated over time.
(a) Immunoblots of APCdef cells upon knockdown of MYC, representative of two independent experiments with similar results. siRNA transfections were carried out using siCTR as non-targeting control or siMYC for 72 h. As positive control for PKR activation, cells were treated with poly(I:C) (2 μg/ml, 4 h).
(b) Crystal violet staining of shCTR-transduced, PKR- or GCN2-depleted APCdef and APCres (six days ethanol or doxycycline, respectively), representative of three independent experiments with similar results. Two independent shRNAs for both PKR and GCN2 were used.
(c) Immunoblots of shCTR-transduced, PKR- or GCN2-depleted APCdef and APCres cells (96 h ethanol or doxycycline, respectively), representative of three independent experiments with similar results.
Unprocessed immunoblots are shown in Source Data Extended Data 9.
Extended Data Fig. 10. Inhibition of PKR and GCN2 reduces viability and p-eIF2α levels in patient-derived CRC organoids.
(a) Growth of patient-derived CRC organoids treated with GCN2 and PKR inhibitors, representative of three independent experiments with similar results. Seven different patient-derived organoid lines were grown for two or three days, and then treated with A-92 or C16 for 96 h at the indicated concentrations. DMSO was used as solvent control. Scale bars = 200 μM.
(b) Immunoblot of three patient-derived CRC organoid lines (upper). Organoids were treated with C16 (1 μM) or A-92 (3 μM) for 6 h. DMSO (D) was used as solvent control. Quantification of p-eIF2α S51 levels, normalised to eIF2α (lower). Data show mean ± s.d. (n = 3 biologically independent organoid lines); unpaired, two-tailed t-test.
(c) Annexin V/PI FACS of shCTR-transduced, PKR- or GCN2-depleted APCdef cells (96 h ethanol) after treatment with DMSO, A-92 or C16 for 48 h. Data shown mean ± s.d. (n = 3 biologically independent experiments); unpaired, two-tailed t-test.
Unprocessed immunoblots are shown in Source Data Extended Data 10.
Supplementary Material
Acknowledgements
This study was supported by grants from the Else-Kröner-Fresenius Foundation (2015_A57 to A.W.), the interdisciplinary center for clinical research of the Medical Faculty Würzburg (IZKF B-186 and B-335 to A.W.), European Research Council Grants “AuroMYC” (Advanced Grant to M.E.) and "ColonCan" (Starting Grant to O.J.S; 311301), a Cancer Research UK Grand Challenge grant (A25045 to O.J.S.), Cancer Research UK core funding (A17196 and A21139 to O.J.S) and the Deutsche Forschungsgemeinschaft (DFG) (WO 2108/1-1 to E.W., FOR2314 and KFO DFG EI 222/8-1 grants to M.E., FOR2314 and KFO DFG WI 5037/2-2 to A.W.) and the Wilhelm Sander-Stiftung (to M.E). S.W. is supported by the Comprehensive Cancer Center program of the German Cancer Aid (Deutsche Krebshilfe). Additional personal financial support was given by Mr. Kratz. The technical expertise of Sabine Roth, Barbara Bauer, Hecham Marouf and Cornelius Schneider is gratefully acknowledged. The invaluable support of the Histology Service, the Biological Services Unit, and all the core services at the Cancer Research UK Beatson Institute is greatly appreciated (Cancer Research UK core grant C596/A17196).
Footnotes
Data availability
RNA–seq data and ribosomal profiling data that support the findings of this study have been deposited in the Gene Expression Omnibus (GEO) under accession code GSE106858. Mass spectrometry data that support the findings of this study have been deposited in figshare.com under the title of this manuscript (A MYC/GCN2/eIF2a negative feedback loop limits protein synthesis to prevent MYC dependent apoptosis in colorectal cancer) by the author Werner Schmitz (https://figshare.com/articles/A_MYC_GCN2_eIF2a_negative_feedback_loop_limits_protein_synthesis_to_prevent_MYCdependent_apoptosis_in_colorectal_cancer_Fig_5a/9878723 and https://figshare.com/articles/A_MYC_GCN2_eIF2a_negative_feedback_loop_limits_protein_synthesis_to_prevent_MYCdependent_apoptosis_in_colorectal_cancer_Fig_5c/9878717). All other data supporting the findings of this study are available from the corresponding author on reasonable request.
Author contributions
S.S., D.G., F.W.U., O.J.S, M.E. and A.W. conceived the project and directed experiments. Experiments were performed by S.S., D.G., F.W.U., S.D., M.P., N.M., S.B., C.F., F.C.W., C.P.A., A.B., R.J., C.S.-V., K.M., W.S., J.R.P.K., D.S., A.R. and A.W. Data were analysed and interpreted by S.S., D.G., F.W.U., S.D., M.P., C.P.A., F.E., W.S., E.W., A.S., A.R., O.J.S., M.E., A.W. Bioinformatical analysis was done by F.W.U., C.P.A., S.W. and F.E. Administrative, technical, or material support was given by M.E.D., S.B., F.C.W., G.V., N.V., C.O., E.W., D.S., C.-T.G., A.R., O.J.S. and M.E. S.S., D.G., E.W., C.-T.G., O.J.S., M.E. and A.W. wrote the manuscript. All authors reviewed and approved the manuscript.
Competing Interests
The authors declare no competing interests.
References
- 1.Truitt ML, et al. Differential Requirements for eIF4E Dose in Normal Development and Cancer. Cell. 2015;162(1):59–71. doi: 10.1016/j.cell.2015.05.049. [DOI] [PMC free article] [PubMed] [Google Scholar]
- 2.Jackson RJ, Hellen CU, Pestova TV. The mechanism of eukaryotic translation initiation and principles of its regulation. Nat Rev Mol Cell Biol. 2010;11(2):113–27. doi: 10.1038/nrm2838. [DOI] [PMC free article] [PubMed] [Google Scholar]
- 3.Pakos-Zebrucka K, et al. The integrated stress response. EMBO Rep. 2016;17(10):1374–1395. doi: 10.15252/embr.201642195. [DOI] [PMC free article] [PubMed] [Google Scholar]
- 4.Jennings MD, et al. Fail-safe control of translation initiation by dissociation of eIF2alpha phosphorylated ternary complexes. Elife. 2017;6 doi: 10.7554/eLife.24542. [DOI] [PMC free article] [PubMed] [Google Scholar]
- 5.Kenner LR, et al. eIF2B-catalyzed nucleotide exchange and phosphoregulation by the integrated stress response. Science. 2019;364(6439):491–495. doi: 10.1126/science.aaw2922. [DOI] [PMC free article] [PubMed] [Google Scholar]
- 6.Adomavicius T, et al. The structural basis of translational control by eIF2 phosphorylation. Nat Commun. 2019;10(1) doi: 10.1038/s41467-019-10167-3. 2136. [DOI] [PMC free article] [PubMed] [Google Scholar]
- 7.CancerGenomeAtlasNetwork. Comprehensive molecular characterization of human colon and rectal cancer. Nature. 2012;487(7407):330–7. doi: 10.1038/nature11252. [DOI] [PMC free article] [PubMed] [Google Scholar]
- 8.van de Wetering M, et al. The beta-catenin/TCF-4 complex imposes a crypt progenitor phenotype on colorectal cancer cells. Cell. 2002;111(2):241–50. doi: 10.1016/s0092-8674(02)01014-0. [DOI] [PubMed] [Google Scholar]
- 9.Sansom OJ, et al. Myc deletion rescues Apc deficiency in the small intestine. Nature. 2007;446(7136):676–9. doi: 10.1038/nature05674. [DOI] [PubMed] [Google Scholar]
- 10.Dow LE, et al. Apc Restoration Promotes Cellular Differentiation and Reestablishes Crypt Homeostasis in Colorectal Cancer. Cell. 2015;161(7):1539–1552. doi: 10.1016/j.cell.2015.05.033. [DOI] [PMC free article] [PubMed] [Google Scholar]
- 11.Faller WJ, et al. mTORC1-mediated translational elongation limits intestinal tumour initiation and growth. Nature. 2015;517(7535):497–500. doi: 10.1038/nature13896. [DOI] [PMC free article] [PubMed] [Google Scholar]
- 12.Truitt ML, Ruggero D. New frontiers in translational control of the cancer genome. Nat Rev Cancer. 2017;17(5):332. doi: 10.1038/nrc.2017.30. [DOI] [PubMed] [Google Scholar]
- 13.Truitt ML, Ruggero D. New frontiers in translational control of the cancer genome. Nat Rev Cancer. 2016;16(5):288–304. doi: 10.1038/nrc.2016.27. [DOI] [PMC free article] [PubMed] [Google Scholar]
- 14.Barna M, et al. Suppression of Myc oncogenic activity by ribosomal protein haploinsufficiency. Nature. 2008;456(7224):971–5. doi: 10.1038/nature07449. [DOI] [PMC free article] [PubMed] [Google Scholar]
- 15.Thoreen CC, et al. A unifying model for mTORC1-mediated regulation of mRNA translation. Nature. 2012;485(7396):109–13. doi: 10.1038/nature11083. [DOI] [PMC free article] [PubMed] [Google Scholar]
- 16.Wiegering A, et al. Targeting Translation Initiation Bypasses Signaling Crosstalk Mechanisms That Maintain High MYC Levels in Colorectal Cancer. Cancer Discov. 2015;5(7):768–81. doi: 10.1158/2159-8290.CD-14-1040. [DOI] [PMC free article] [PubMed] [Google Scholar]
- 17.Dang CV. MYC on the path to cancer. Cell. 2012;149(1):22–35. doi: 10.1016/j.cell.2012.03.003. [DOI] [PMC free article] [PubMed] [Google Scholar]
- 18.Sansom OJ, et al. Loss of Apc in vivo immediately perturbs Wnt signaling, differentiation, and migration. Genes Dev. 2004;18(12):1385–90. doi: 10.1101/gad.287404. [DOI] [PMC free article] [PubMed] [Google Scholar]
- 19.Willert J, et al. A transcriptional response to Wnt protein in human embryonic carcinoma cells. BMC Dev Biol. 2002;2:8. doi: 10.1186/1471-213x-2-8. [DOI] [PMC free article] [PubMed] [Google Scholar]
- 20.Bild AH, et al. Oncogenic pathway signatures in human cancers as a guide to targeted therapies. Nature. 2006;439(7074):353–7. doi: 10.1038/nature04296. [DOI] [PubMed] [Google Scholar]
- 21.Hanahan D, Weinberg RA. Hallmarks of cancer: the next generation. Cell. 2011;144(5):646–74. doi: 10.1016/j.cell.2011.02.013. [DOI] [PubMed] [Google Scholar]
- 22.Faux MC, et al. Restoration of full-length adenomatous polyposis coli (APC) protein in a colon cancer cell line enhances cell adhesion. J Cell Sci. 2004;117(Pt 3):427–39. doi: 10.1242/jcs.00862. [DOI] [PubMed] [Google Scholar]
- 23.Rosenbluh J, et al. beta-Catenin-driven cancers require a YAP1 transcriptional complex for survival and tumorigenesis. Cell. 2012;151(7):1457–73. doi: 10.1016/j.cell.2012.11.026. [DOI] [PMC free article] [PubMed] [Google Scholar]
- 24.Jennings MD, Pavitt GD. A new function and complexity for protein translation initiation factor eIF2B. Cell Cycle. 2014;13(17):2660–5. doi: 10.4161/15384101.2014.948797. [DOI] [PMC free article] [PubMed] [Google Scholar]
- 25.Pavitt GD. Regulation of translation initiation factor eIF2B at the hub of the integrated stress response. Wiley Interdiscip Rev RNA. 2018:e1491. doi: 10.1002/wrna.1491. [DOI] [PubMed] [Google Scholar]
- 26.Hart T, et al. High-Resolution CRISPR Screens Reveal Fitness Genes and Genotype-Specific Cancer Liabilities. Cell. 2015;163(6):1515–26. doi: 10.1016/j.cell.2015.11.015. [DOI] [PubMed] [Google Scholar]
- 27.Fresno M, Jimenez A, Vazquez D. Inhibition of translation in eukaryotic systems by harringtonine. Eur J Biochem. 1977;72(2):323–30. doi: 10.1111/j.1432-1033.1977.tb11256.x. [DOI] [PubMed] [Google Scholar]
- 28.Lobo MV, et al. Levels, phosphorylation status and cellular localization of translational factor eIF2 in gastrointestinal carcinomas. Histochem J. 2000;32(3):139–50. doi: 10.1023/a:1004091122351. [DOI] [PubMed] [Google Scholar]
- 29.Crouch D, Safer B. The association of eIF-2 with Met-tRNAi or eIF-2B alters the specificity of eIF-2 phosphatase. J Biol Chem. 1984;259(16):10363–8. [PubMed] [Google Scholar]
- 30.Ingolia NT, et al. The ribosome profiling strategy for monitoring translation in vivo by deep sequencing of ribosome-protected mRNA fragments. Nat Protoc. 2012;7(8):1534–50. doi: 10.1038/nprot.2012.086. [DOI] [PMC free article] [PubMed] [Google Scholar]
- 31.Rubio CA, et al. Transcriptome-wide characterization of the eIF4A signature highlights plasticity in translation regulation. Genome Biol. 2014;15(10):476. doi: 10.1186/s13059-014-0476-1. [DOI] [PMC free article] [PubMed] [Google Scholar]
- 32.Hinnebusch AG. Translational regulation of GCN4 and the general amino acid control of yeast. Annu Rev Microbiol. 2005;59:407–50. doi: 10.1146/annurev.micro.59.031805.133833. [DOI] [PubMed] [Google Scholar]
- 33.Gardner BM, et al. Endoplasmic reticulum stress sensing in the unfolded protein response. Cold Spring Harb Perspect Biol. 2013;5(3):a013169. doi: 10.1101/cshperspect.a013169. [DOI] [PMC free article] [PubMed] [Google Scholar]
- 34.Hetz C, Chevet E, Oakes SA. Proteostasis control by the unfolded protein response. Nat Cell Biol. 2015;17(7):829–38. doi: 10.1038/ncb3184. [DOI] [PMC free article] [PubMed] [Google Scholar]
- 35.Jiang HY, et al. Activating transcription factor 3 is integral to the eukaryotic initiation factor 2 kinase stress response. Mol Cell Biol. 2004;24(3):1365–77. doi: 10.1128/MCB.24.3.1365-1377.2004. [DOI] [PMC free article] [PubMed] [Google Scholar]
- 36.Zinszner H, et al. CHOP is implicated in programmed cell death in response to impaired function of the endoplasmic reticulum. Genes Dev. 1998;12(7):982–95. doi: 10.1101/gad.12.7.982. [DOI] [PMC free article] [PubMed] [Google Scholar]
- 37.Murphy DJ, et al. Distinct thresholds govern Myc's biological output in vivo. Cancer Cell. 2008;14(6):447–57. doi: 10.1016/j.ccr.2008.10.018. [DOI] [PMC free article] [PubMed] [Google Scholar]
- 38.Shi Y, et al. Therapeutic potential of targeting IRES-dependent c-myc translation in multiple myeloma cells during ER stress. Oncogene. 2016;35(8):1015–24. doi: 10.1038/onc.2015.156. [DOI] [PMC free article] [PubMed] [Google Scholar] [Retracted]
- 39.Stoneley M, et al. c-Myc protein synthesis is initiated from the internal ribosome entry segment during apoptosis. Mol Cell Biol. 2000;20(4):1162–9. doi: 10.1128/mcb.20.4.1162-1169.2000. [DOI] [PMC free article] [PubMed] [Google Scholar]
- 40.Didiot MC, et al. Identification of cardiac glycoside molecules as inhibitors of c-Myc IRES-mediated translation. J Biomol Screen. 2013;18(4):407–19. doi: 10.1177/1087057112466698. [DOI] [PubMed] [Google Scholar]
- 41.Berg JM, Tymoczko JL, Stryer L. Biochemistry. Sixth ed. Vol. 1. New York: W. H. Freeman and company; 2007. (pagination multiple). [Google Scholar]
- 42.Zuber J, et al. RNAi screen identifies Brd4 as a therapeutic target in acute myeloid leukaemia. Nature. 2011;478(7370):524–8. doi: 10.1038/nature10334. [DOI] [PMC free article] [PubMed] [Google Scholar]
- 43.van de Wetering M, et al. Prospective derivation of a living organoid biobank of colorectal cancer patients. Cell. 2015;161(4):933–45. doi: 10.1016/j.cell.2015.03.053. [DOI] [PMC free article] [PubMed] [Google Scholar]
- 44.Sato T, et al. Single Lgr5 stem cells build crypt-villus structures in vitro without a mesenchymal niche. Nature. 2009;459(7244):262–5. doi: 10.1038/nature07935. [DOI] [PubMed] [Google Scholar]
- 45.el Marjou F, et al. Tissue-specific and inducible Cre-mediated recombination in the gut epithelium. Genesis. 2004;39(3):186–93. doi: 10.1002/gene.20042. [DOI] [PubMed] [Google Scholar]
- 46.Shibata H, et al. Rapid colorectal adenoma formation initiated by conditional targeting of the Apc gene. Science. 1997;278(5335):120–3. doi: 10.1126/science.278.5335.120. [DOI] [PubMed] [Google Scholar]
- 47.Jackson EL, et al. Analysis of lung tumor initiation and progression using conditional expression of oncogenic K-ras. Genes Dev. 2001;15(24):3243–8. doi: 10.1101/gad.943001. [DOI] [PMC free article] [PubMed] [Google Scholar]
- 48.Adhikary S, Eilers M. Transcriptional regulation and transformation by Myc proteins. Nat Rev Mol Cell Biol. 2005;6(8):635–45. doi: 10.1038/nrm1703. [DOI] [PubMed] [Google Scholar]
- 49.Su LK, et al. Multiple intestinal neoplasia caused by a mutation in the murine homolog of the APC gene. Science. 1992;256(5057):668–70. doi: 10.1126/science.1350108. [DOI] [PubMed] [Google Scholar]
- 50.Donnelly N, et al. The eIF2alpha kinases: their structures and functions. Cell Mol Life Sci. 2013;70(19):3493–511. doi: 10.1007/s00018-012-1252-6. [DOI] [PMC free article] [PubMed] [Google Scholar]
- 51.Haikala HM, et al. Pharmacological reactivation of MYC-dependent apoptosis induces susceptibility to anti-PD-1 immunotherapy. Nat Commun. 2019;10(1):620. doi: 10.1038/s41467-019-08541-2. [DOI] [PMC free article] [PubMed] [Google Scholar]
- 52.Nieminen AI, et al. Myc-induced AMPK-phospho p53 pathway activates Bak to sensitize mitochondrial apoptosis. Proc Natl Acad Sci U S A. 2013;110(20):E1839–48. doi: 10.1073/pnas.1208530110. [DOI] [PMC free article] [PubMed] [Google Scholar]
- 53.Castilho BA, et al. Keeping the eIF2 alpha kinase Gcn2 in check. Biochim Biophys Acta. 2014;1843(9):1948–68. doi: 10.1016/j.bbamcr.2014.04.006. [DOI] [PubMed] [Google Scholar]
- 54.Yue M, et al. Oncogenic MYC Activates a Feedforward Regulatory Loop Promoting Essential Amino Acid Metabolism and Tumorigenesis. Cell Rep. 2017;21(13):3819–3832. doi: 10.1016/j.celrep.2017.12.002. [DOI] [PubMed] [Google Scholar]
- 55.Subramanian A, et al. Gene set enrichment analysis: a knowledge-based approach for interpreting genome-wide expression profiles. Proc Natl Acad Sci U S A. 2005;102(43):15545–50. doi: 10.1073/pnas.0506580102. [DOI] [PMC free article] [PubMed] [Google Scholar]
- 56.Kaiser S, et al. Transcriptional recapitulation and subversion of embryonic colon development by mouse colon tumor models and human colon cancer. Genome Biol. 2007;8(7):R131. doi: 10.1186/gb-2007-8-7-r131. [DOI] [PMC free article] [PubMed] [Google Scholar]
- 57.Hong Y, et al. A 'metastasis-prone' signature for early-stage mismatch-repair proficient sporadic colorectal cancer patients and its implications for possible therapeutics. Clin Exp Metastasis. 2010;27(2):83–90. doi: 10.1007/s10585-010-9305-4. [DOI] [PubMed] [Google Scholar]
- 58.Eden E, et al. GOrilla: a tool for discovery and visualization of enriched GO terms in ranked gene lists. BMC Bioinformatics. 2009;10:48. doi: 10.1186/1471-2105-10-48. [DOI] [PMC free article] [PubMed] [Google Scholar]
- 59.Eden E, et al. Discovering motifs in ranked lists of DNA sequences. PLoS Comput Biol. 2007;3(3):e39. doi: 10.1371/journal.pcbi.0030039. [DOI] [PMC free article] [PubMed] [Google Scholar]
- 60.Fellmann C, et al. Functional identification of optimized RNAi triggers using a massively parallel sensor assay. Mol Cell. 2011;41(6):733–46. doi: 10.1016/j.molcel.2011.02.008. [DOI] [PMC free article] [PubMed] [Google Scholar]
- 61.Weber K, et al. A multicolor panel of novel lentiviral "gene ontology" (LeGO) vectors for functional gene analysis. Mol Ther. 2008;16(4):698–706. doi: 10.1038/mt.2008.6. [DOI] [PubMed] [Google Scholar]
- 62.Herold S, et al. Recruitment of BRCA1 limits MYCN-driven accumulation of stalled RNA polymerase. Nature. 2019;567(7749):545–549. doi: 10.1038/s41586-019-1030-9. [DOI] [PMC free article] [PubMed] [Google Scholar]
- 63.Ran FA, et al. Genome engineering using the CRISPR-Cas9 system. Nature Protocols. 2013;8(11):2281–2308. doi: 10.1038/nprot.2013.143. [DOI] [PMC free article] [PubMed] [Google Scholar]
- 64.Dai Z, et al. edgeR: a versatile tool for the analysis of shRNA-seq and CRISPR-Cas9 genetic screens. F1000Res. 2014;3:95. doi: 10.12688/f1000research.4204. [DOI] [PMC free article] [PubMed] [Google Scholar]
- 65.Afgan E, et al. The Galaxy platform for accessible, reproducible and collaborative biomedical analyses: 2018 update. Nucleic Acids Res. 2018;46(W1):W537–W544. doi: 10.1093/nar/gky379. [DOI] [PMC free article] [PubMed] [Google Scholar]
- 66.Dejure FR, et al. The MYC mRNA 3'-UTR couples RNA polymerase II function to glutamine and ribonucleotide levels. EMBO J. 2017;36(13):1854–1868. doi: 10.15252/embj.201796662. [DOI] [PMC free article] [PubMed] [Google Scholar]
- 67.Moser AR, Pitot HC, Dove WF. A dominant mutation that predisposes to multiple intestinal neoplasia in the mouse. Science. 1990;247(4940):322–4. doi: 10.1126/science.2296722. [DOI] [PubMed] [Google Scholar]
- 68.Vlachogiannis G, et al. Patient-derived organoids model treatment response of metastatic gastrointestinal cancers. Science. 2018;359(6378):920–926. doi: 10.1126/science.aao2774. [DOI] [PMC free article] [PubMed] [Google Scholar]
- 69.Dobin A, et al. STAR: ultrafast universal RNA-seq aligner. Bioinformatics. 2013;29(1):15–21. doi: 10.1093/bioinformatics/bts635. [DOI] [PMC free article] [PubMed] [Google Scholar]
Associated Data
This section collects any data citations, data availability statements, or supplementary materials included in this article.


