

Abstract
Aims
We sought to evaluate the relationship between left atrial (LA) mechanical dyssynchrony and history of stroke or transient ischaemic attack (TIA) in patients with atrial fibrillation (AF). We hypothesized that mechanical dyssynchrony of the LA is associated with history of stroke/TIA independent of LA function and Cardiac failure, Hypertension, Age, Diabetes, Stroke/transient ischaemic attack (TIA), VAscular disease, and Sex category (CHA2DS2-VASc) score in patients with AF.
Methods and results
We conducted a cross-sectional study of 246 patients with a history of AF (59 ± 10 years, 29% female, 26% non-paroxysmal AF) referred for catheter ablation to treat drug-refractory AF who underwent preablation cardiac magnetic resonance (CMR) in sinus rhythm. Using tissue-tracking CMR, we measured the LA longitudinal strain and strain rate in each of 12 equal-length segments in two- and four-chamber views. We defined indices of LA mechanical dyssynchrony, including the standard deviation of the time to the peak longitudinal strain (SD-TPS). Patients with a prior history of stroke or TIA (n = 23) had significantly higher SD-TPS than those without (n = 223) (39.9 vs. 23.4 ms, P < 0.001). Multivariable analysis showed that SD-TPS was associated with stroke/TIA after adjusting for the CHA2DS2-VASc score, LA minimum index volume, and the peak LA longitudinal strain (P < 0.001). The receiver-operating characteristics curve showed that SD-TPS identified patients with stroke/TIA more accurately than CHA2DS2-VASc score alone (c-statistics: 0.82 vs. 0.75, P < 0.001).
Conclusion
Higher mechanical dyssynchrony of the LA during sinus rhythm is associated with a history of stroke/TIA in patients with AF.
Keywords: atrial fibrillation, dyssynchrony, left atrium, stroke, transient ischaemic attack
Introduction
Stroke is the leading cause of long-term disability and a major cause of health care resource consumption worldwide.1 Atrial fibrillation (AF) is a powerful risk factor of stroke, and patients with AF-related stroke have a higher disease severity, worse outcomes in terms of disability, morbidity, and mortality compared with individuals without a history of AF.2 The current approach to estimating the risk of stroke in patients with a history of AF is the Cardiac failure, Hypertension, Age, Diabetes, Stroke/transient ischaemic attack (TIA), VAscular disease, and Sex category [CHA2DS2-VASC] scoring system, and oral anticoagulation is recommended for those with a score of 2 or greater.3 Although the CHA2DS2-VASc score has been epidemiologically derived and validated,4 no direct mechanistic link between the CHA2DS2-VASc and AF-related stroke has been identified. In fact, the CHA2DS2-VASc score is associated with stroke even in patients without a history of AF.5 Therefore, the CHA2DS2-VASc score may be viewed as a general marker of unhealthy phenotype. This may explain why the CHA2DS2-VASc scoring fails to identify a large number of high-risk individuals.6 Besides, the CHA2DS2-VASc system does not protect individuals with subclinical AF, where a stroke is the first manifestation of AF.7 Clearly, there is an unmet clinical need for an improved risk-stratification paradigm for AF-related stroke.
Recently, we demonstrated that depressed left atrial (LA) reservoir function during sinus rhythm quantified by tissue-tracking cardiac magnetic resonance (CMR) is associated with a history of stroke/TIA in patients with AF, independent of the CHA2DS2-VASc score.8 These findings support a hypothesis that LA function may play a central role in the mechanism of AF-related stroke. Nevertheless, the precise mechanism as to how depressed LA function leads to thrombogenesis remains unclear.
In this study, as a first step to further dissect the mechanism of thrombogenesis when LA function is depressed, we aimed to investigate the potential role of mechanical dyssynchrony of LA during sinus rhythm. We hypothesized that mechanical dyssynchrony of the LA quantified by CMR is significantly associated with stroke or TIA independent of LA function in patients with a history of AF.
Methods
Please refer to the supplemental material for detailed methods (Supplementary data online, Appendix S1).
Study population
We performed a cross-sectional study using a prospectively enrolled database of patients referred to the Johns Hopkins Hospital for catheter ablation of symptomatic drug-refractory AF between June 2010 and December 2015. The patients underwent preprocedural CMR to acquire 3D anatomy of the left atrium, which was incorporated into an electroanatomical mapping system to guide catheter ablation of AF. Out of a total of 373 patients with available CMR image and without a history of prior AF or LA flutter ablation, 127 patients were excluded because either the presence of motion artifact, AF during CMR scan, and poor image quality. Moreover, subjects were excluded because of prior diagnosis of severe mitral disease. Additional information regarding patients excluded from the analysis is described in Supplementary data online, Table S1. A total of 246 patients were included in the final analysis, with (n = 23; Stroke group) and without (n = 223; Control group) history of stroke/TIA before CMR. The patients with persistent AF were placed on antiarrhythmic medications and referred for external cardioversion 3–4 weeks before CMR. The Johns Hopkins Institutional Review Board approved this study and all the patients provided written consent.
LA dyssynchrony analysis
Please refer to the supplemental material for detailed CMR protocol (Supplementary data online, Appendix S1). Multimodality tissue tracking software (MTT, version 6.1, Toshiba, Japan) was used to quantify the LA longitudinal strains and strain rates in two-chamber and four-chamber views. The accuracy and reproducibility of MTT have been validated previously.8,9 Briefly, an experienced operator, blinded to the group, defined the LA endocardial and epicardial borders at the LA end diastole (Figure 1). The confluence of the pulmonary veins and LA appendage were excluded as appropriate. The software automatically propagates endocardial/epicardial borders over the entire cardiac cycle using a template matching algorithm.8 Finally, the operator verified the quality of the tracking generated by MTT. The software automatically divides the LA into six equal-length segments in each of the two- and four-chamber views, creating a total of 12 segments (Figure 1). Longitudinal strain and strain rate were calculated within each of the 12 segments (Figure 2). Based on those curves we defined five indices of LA mechanical dyssynchrony as follows:10,11
Figure 1.

Quantification of LA regional function using cine CMR. (A) Two-chamber view with six equi-length segments; (B) Four-chamber view with six equi-length segments.
Figure 2.
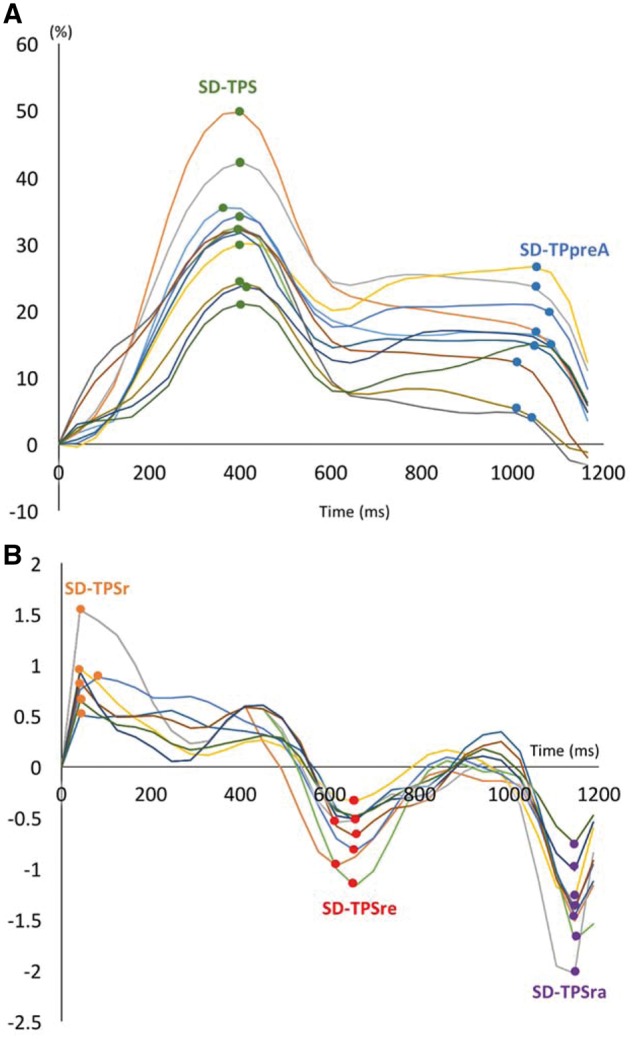
Strain and strain rate curves for all 12 segments. (A) Strain curves for 12 segments. Green dot, time-to-peak (TP) strain for each segment; Blue dot, time-to-peak preatrial strain (TPSpreA) for each segment. (B) Strain rate curves for 12 segments. Orange dots, time-to-peak strain rate (TPSR) for each segment; Red dot, time-to-peak LV early diastole (TPSRe); Purple dot, time-to-peak LA contraction (TPSRa). Dyssynchrony was measured as standard deviation (SD) of TPS, TPSpreA, TPSR, TPSRe, and TPSRa.
SD-time-to-peak strain (SD-TPS): Standard deviation of the time to the peak longitudinal strain in 12 segments. This index quantifies mechanical dyssynchrony of the LA reservoir function.
SD-time-to-peak preatrial contraction strain (SD-TPSpreA): Standard deviation of the time-to-the peak preatrial contraction strain in 12 segments. This index quantifies mechanical dyssynchrony of the LA reservoir and conduit function.
SD-time-to-peak strain rate (SD-TPSR): Standard deviation of the time to the peak strain rate in 12 segments.
SD-time-to-peak early diastolic strain rate (SD-TPSRe): Standard deviation of the time to the peak early diastolic strain rate in 12 segments.
SD-time-to-peak late diastolic strain rate (SD-TPSRa): Standard deviation of the time to the peak late diastolic strain rate in 12 segments.
A higher value of each index reflects a greater degree of mechanical dyssynchrony. We also presented the values of LA dyssynchrony as percentage (SD, %) of R–R′ interval. Similar assessment of LA dyssynchrony has been published and validated before using 3D-echocardiogram against standard 2D echocardiogram, in a population of individuals with paroxysmal and persistent AF against healthy subjects.10 Out of a total of 5904 segments, 86 (1.45%) were excluded from analysis because these segments lacked well-defined peaks in the strain/strain rate curves.
Statistical analysis
Baseline patient demographics are presented as mean + SD or percentage and are compared using Student's t-test or χ2 and Fisher’s exact test as appropriate. Multivariable logistic regression was used to assess the effects of LA dyssynchrony on the likelihood that the patient has a history of stroke/TIA. Results are presented as odds ratio (OR). Model 1: unadjusted, Model 2: adjusted for the CHA2DS2-VASC score before stroke; Model 3: Model 2+ LA minimum volume (Vmin), Model 4: Model 3 + Maximum longitudinal LA strain (Smax). Bootstrapping confidence intervals (CI) using Bias-corrected algorithm (n = 500 replications) were calculated based on the final model. Since the number of patients with history of stroke was substantially lower than those without, we also performed a propensity score matching analysis. We applied greedy nearest neighbour matching within a specified calliper width (0.1) without replacement for forming pairs of patients with and without history of stroke matched on the propensity score. We performed two different matching: one based only on the CHA2DS2-VASC score and the other based on the CHA2DS2-VASC score, LA minimum volume and LA peak longitudinal strain. After matching, logistic regression was used to compare the odds of stroke in both groups. Sensitivity analysis including time from AF diagnosis to the procedure, type of AF, and left ventricular ejection fraction (LVEF) in multivariable logistic models were also performed. Receiver operating characteristic (ROC) curves were generated to evaluate the additional value of mechanical dyssynchrony in predicting stroke/TIA beyond the CHA2DS2-VASC score. We performed chi-squared statistics to compare two different values of area under the curve (AUC). The 0.05 significance level was used for all hypothesis tests, and all t-tests were 2-sided. The statistical computations were performed using the STATA software (version 12.0, StataCorp, College Station, TX, USA).
Results
Patient demographics
Table 1 summarizes participant’s clinical characteristics. There were 71 (29%) female patients, and the average age was 59 ± 10 years (range 20–83). The stroke group was older (mean 67.9 vs. 58.7, P< 0.001) with the higher CHA2DS2-VASC score before stroke (2.65 vs. 1.39, P < 0.001) and the higher prevalence of coronary artery disease (CAD) (21.7% vs. 9.0%, P = 0.054) and diabetes (21.7% vs. 10.0%, P = 0.015) compared with the control group. In the stroke group, 6 patients (26%) were on anticoagulation prior to stroke/TIA, and 11 patients (48%) started anticoagulation after stroke/TIA. The timing of anticoagulation initiation for the remaining six patients (26%) in the stroke groups is unknown. According to the standard of peri-procedural care for catheter ablation of AF, all patients with or without a history of stroke/TIA were on anticoagulation at the time of cardiac MRI and the ablation procedure. Supplementary data online, Table S1 summarizes the clinical characteristics of patients excluded from analysis due to AF at the time of cardiac MRI. The clinical characteristics of the patients included in and excluded from the analysis was similar, except for the prevalence of non-paroxysmal AF (52.8% vs. 26.4%, P < 0.001), history of hypertension (64.6% vs. 45.1%, P < 0.001), and ACEI/ARB use (40.1% vs. 29.7%, P = 0.037).
Table 1.
Baseline characteristics
| Stroke, n = 23 | Control, n = 223 | P | |
|---|---|---|---|
| Clinical | |||
| Age (years) | 67.9 ± 7.3 | 58.7 ± 10.4 | <0.001 |
| Body mass index (kg/m2) | 27.2 ± 4.3 | 28.9 ± 5.5 | 0.171 |
| Female, n (%) | 10 (43.5) | 61 (27.4) | 0.104 |
| Persistent AF, n (%) | 7 (30.4) | 58 (26.0) | 0.210 |
| Heart failure, n (%) | 3 (13.0) | 23 (10.3) | 0.719 |
| Coronary artery disease/ vascular disease, n (%) | 5 (21.7) | 20 (9.0) | 0.054 |
| Diabetes mellitus, n (%) | 5 (21.7) | 22 (10.0) | 0.015 |
| Hypertension, n (%) | 13 (57.0) | 98 (44.0) | 0.249 |
| CHA2DS2-VASC, (Before stroke) | 2.65 ± 1.3 | 1.39 ± 1.3 | <0.001 |
| CHA2DS2-VASC (Before stroke), n (%) | |||
| 0 | 2 (8.7) | 70 (31.4) | |
| 1 | 1 (4.3) | 64 (28.7) | |
| 2 | 9 (39.1) | 43 (19.3) | |
| 3 | 2 (8.7) | 29 (13.0) | |
| 4 | 9 (39.1) | 13 (5.8) | |
| 5 | 2 (0.9) | ||
| 6 | 2 (0.9) | ||
| AF diagnosis (years) | 5.9 ± 4.1 | 4.9 ± 5.8 | 0.065 |
| Obstructive sleep apnea, n (%) | 3 (6.8) | 20 (10.6) | 0.582 |
| Medication | |||
| ACEI/ARBS, n (%) | 9 (39.1) | 64 (29.0) | 0.311 |
| Beta-Blockers, n (%) | 13 (57.0) | 112 (50.2) | 0.719 |
| Ca-channel blockers, n (%) | 7 (30.4) | 47 (21.1) | 0.364 |
| Anticoagulant use, total (%) | 23 (100) | 193 (87.0) | 0.073 |
| Number of antiarrhythmic drugs | 1.4 ± 0.8 | 1.3 ± 0.8 | 0.432 |
Data are presented as mean ± standard deviation, n (%), or median.
ACEI/ARB, angiotensin-converting enzyme inhibitor/angiotensin receptor blockers; AF, atrial fibrillation.
LA mechanical dyssynchrony and stroke
Patients in the stroke group had the higher maximum and minimum LA volumes, lower total EF, passive EF, and SRmax and SRe values (Table 2). There was no significant difference in the extent of LA fibrosis quantified by LGE between the stroke and the control groups (16 [5–35] vs. 11 [6–18] %LA extent; P = 0.220). In contrast, SD-TPS (Figure 2) and SD-TPSpreA in the stroke group were significantly higher than that of the control group (median 39.9 vs. 23.4 ms, P < 0.001 for SD-TPS and 42.8 vs. 32.5 ms, P = 0.034 for SD-TPSpreA), SD-TPS and SD-TPSpreA as percentage of R–R′ interval were also significant different between groups. Other dyssynchrony parameters were also higher in the stroke group than in the control group. However, the difference did not reach statistical significance (Table 2).
Table 2.
LA functional parameters by groups
| Stroke/TIA, n = 23 |
Control, n = 223 |
||||
|---|---|---|---|---|---|
| Mean | 95% CI | Mean | 95% CI | P | |
| LA structure | |||||
| Minimum LA volume index, mm3/m2 | 32.8 ± 13.5 | 27.0–38.5 | 23.6 ± 10.1 | 22.3–25.0 | <0.001 |
| Maximum LA volume index, mm3/m2 | 50.3 ± 13.8 | 44.3–56.2 | 42.8 ± 13.1 | 41.1–44.6 | 0.010 |
| LA function | |||||
| Total LAEF, % | 36.6 ± 14.5 | 30.3–42.9 | 46.2 ± 10.1 | 44.9–47.5 | <0.001 |
| Passive LAEF, % | 16.3 ± 6.3 | 13.4–19.3 | 21.3 ± 7.7 | 20.3–22.3 | 0.005 |
| Active LAEF, % | 27.4 ± 13.9 | 20.9–33.9 | 31.8 ± 10.5 | 30.4–33.1 | 0.083 |
| Smax, % | 19.5 ± 8.4 | 15.9–23.1 | 25.4 ± 8.1 | 24.3–26.5 | 0.001 |
| SpreA, % | 11.1 ± 5.3 | 8.9–13.5 | 12.8 ± 4.9 | 12.1–13.5 | 0.131 |
| SRmax | 1.3 ± 0.7 | 1.0–1.6 | 1.6 ± 0.8 | 1.5–1.7 | 0.029 |
| SRe | −0.9 ± 0.5 | −1.1–-0.7 | −1.3 ± −0.6 | −1.4–-1.3 | 0.002 |
| SRa | −1.4 ± 0.7 | −1.7–-1.2 | −1.6 ± 0.8 | −1.7–-1.5 | 0.213 |
| LVEF, % | 53.3 ± 11.0 | 46.3–60.2 | 57.4 ± 7.1 | 56.1–58.8 | 0.070 |
| Median | IQR | Median | IQR | P | |
| Dyssynchrony | |||||
| SD-TPS (ms) | 39.9 | 31.8–53.1 | 23.4 | 18.2–32.4 | <0.001 |
| SD-TPS, % | 4.1 | 3.2–5.5 | 2.4 | 1.8–3.2 | <0.001 |
| SD-TPSpreA (ms) | 42.8 | 34.1.–56.4 | 32.5 | 25.6–46.7 | 0.034 |
| SD-TPSpreA, % | 4.4 | 2.9–5.3 | 3.3 | 2.5–4.9 | 0.041 |
| SD-TPSR (ms) | 84.4 | 57.2–101.4 | 73.3 | 57.0–95.2 | 0.225 |
| SD-TPSR, % | 8.5 | 6.9–9.8 | 7.4 | 5.7–10.2 | 0.255 |
| SD-TPSRe (ms) | 29.7 | 22.1–40.0 | 23.6 | 16.6–30.8 | 0.060 |
| SD-TPSRe, % | 2.9 | 2.2–5.2 | 2.3 | 1.8–3.1 | 0.011 |
| SD-TPSRa (ms) | 38.8 | 28.4–58.0 | 33.3 | 25.4–44.7 | 0.155 |
| SD-TPSRa (%) | 3.7 | 2.9–4.9 | 2.3 | 4.5–4.9 | 0.218 |
| A fibrosis (total 122) | Stroke/TIA, n = 11 | Control, n = 111 | |||
| Median | IQR | Median | IQR | P | |
| LGE extent (% LA surface) | 16 | 5–35 | 11 | 6–18 | 0.220 |
Data are presented as median (IQR, interquartile range), or mean ± standard deviation (SD).
CI, confidence interval; LA, left atrium; LAEF, LA emptying fraction; LVEF, left ventricular ejection fraction; Smax, maximum longitudinal LA strain; SRmax, peak longitudinal strain rate; SRe, early diastolic strain rate; SRa, late diastolic strain rate; TPS, time-to-peak strain; TPSpreA, time-to-peak preatrial contraction strain; TPSR, time-to-peak strain rate at left ventricular systole; SpreA, preatrial contraction strain.
LA dyssynchrony and clinical characteristics
The distribution of the stroke/TIA and control group patients among the percentiles of SD-TPS is shown in Figure 3 (Grade II: ≤33rd, Grade II: 33rd–66th, and Grade III: ≥66th). The relationship between SD-TPS grade and clinical variables is shown in Table 3. After correction for multiple comparison, patients with higher SD-TPS grades were older (Grade I: 56.6 ±9.7 vs. grade III: 63.2 ± 9.7 years; P < 0.001) and were more likely to have a history of stroke or TIA (P = <0.001).
Figure 3.

SD-TPS: stroke vs. controls. Patients with history of stroke had significantly higher SD-TPS (ms). Two-sample Kolmogorov–Smirnov test.
Table 3.
Participant’s characteristics according to grade of dyssynchrony
| Grade 1, n = 82 | Grade 2, n = 82 | Grade 3, n = 82 | P | |
|---|---|---|---|---|
| Clinical | ||||
| Age, years (SD) | 56.6 (9.7) | 58.8 (11.0) | 63.2 (9.7) | <0.001* |
| Body mass index, kg/m2 (SD) | 29.1 (6.3) | 29.4 (5.3) | 27.7 (4.3) | 0.172 |
| Female, n | 30 | 21 | 20 | 0.137 |
| Persistent, n | 23 | 18 | 24 | 0.530 |
| Heart failure, n | 11 | 6 | 9 | 0.427 |
| Coronary artery disease/vascular disease, n | 7 | 4 | 14 | 0.033 |
| Diabetes mellitus, n | 8 | 12 | 7 | 0.423 |
| Hypertension, n | 34 | 40 | 37 | 0.678 |
| Age >75, n | 3 | 3 | 14 | 0.002 |
| CHA2DS2-VASC,: Categories | 0.101 | |||
| CHA2DS2-VASC: 0 | 28 | 26 | 16 | |
| CHA2DS2-VASC: 1 | 20 | 24 | 20 | |
| CHA2DS2-VASC ≥ 2 | 33 | 32 | 47 | |
| Stroke/TIA, n | 1 | 4 | 18 | <0.001* |
| SD-TPS (ms) (IQR) | 16.3 (14.0–18.9) | 24.3 (22.7–27.7) | 37.7 (33.0–46.2) | <0.001* |
| SD-TPS, % (IQR) | 1.7 (1.5–2.0) | 2.4 (2.1–2.9) | 3.9 (3.2–4.9) | <0.001* |
Data are presented as mean ± standard deviation, n, or median.
P after Bonferroni’s correction.
Univariable and multivariable analyses
In Model 1, a univariable (unadjusted) analysis identified higher the CHA2DS2-VASC scores before stroke/TIA, minimum LA volume, maximum longitudinal LA strain (Smax), SD-TPS (ms and %), SD-TPSpreA, SD-TPSR, and SD-TPSRe as significant contributors to stroke/TIA. In addition, patients with Grade 1 had protective odds of stroke when compared with Grade 3, G1 vs. G3 = 22.1, P = 0.003 (Table 4). After adjusting for CHA2DS2-VASC and LA structural and functional parameters, SD-TPS remained significant (Table 4, Model 4). We also performed multivariable analysis with 122 patients for whom LGE was available. SD-TPS remained independently associated with stroke after adjusting for LGE (Supplementary data online, Appendix S2). The propensity score matching analysis showed that LA mechanical dyssynchrony remained significantly associated with stroke when the score was matched based only on the CHA2DS2-VASC score [n = 23 in each group, OR 3.5 (95% CI 1.5–8.2), P = 0.005], and when the score was matched based on the CHA2DS2-VASC score, Vmin and Smax [n = 18 in each group, OR 2.2 (95% CI 1.2–3.9), P = 0.007]. Logistic regression including time from AF diagnosis to the procedure, type of AF, and LVEF did not change our main findings (Supplementary data online, Tables S3 and S4).
Table 4.
Univariable and multivariable analyses
| Model 1 |
Model 2 |
Model 3 |
Model 4 |
||||||
|---|---|---|---|---|---|---|---|---|---|
| Unadjusted |
CHA2DS2-VASC prior to Stroke/TIA |
Model 2 + Vmin |
Model 3 + Smax |
||||||
| OR | P | OR | P | OR | P | OR | 95% CI | P | |
| Clinical | |||||||||
| CHA2DS2-VASC, prior toStroke/TIA | 1.82 | <0.001 | |||||||
| AF type (persistent) | 1.24 | 0.647 | |||||||
| MRI parameter | |||||||||
| Vmin | 1.04 | 0.013 | 1.05 | 0.005 | |||||
| Smax (%) | 0.90 | 0.001 | 0.92 | 0.012 | 0.95 | 0.139 | |||
| SD-TPS (%) | 1.80 | <0.001 | 1.80 | <0.001 | 1.80 | <0.001 | 1.84 | 1.33–2.56 | 0.006 |
| SD-TPS (ms) | 1.09 | <0.001 | 1.09 | <0.001 | 1.08 | <0.001 | 1.09 | 1.04–1.13 | <0.001 |
| SD-TPS (2 vs. 1) | 4.10 | 0.211 | 4.95 | 0.165 | 4.50 | 0.197 | 4.51 | 1.12–42 | 0.084 |
| SD-TPS (3 vs. 1) | 22.1 | 0.003 | 24.2 | 0.003 | 19.9 | 0.005 | 18.7 | 6.55–75 | <0.001 |
| SD-TPSpreA | 1.02 | 0.010 | 1.02 | 0.044 | 1.01 | 0.173 | |||
| SD-TPSR | 1.01 | 0.035 | 1.00 | 0.060 | |||||
| SD-TPSRe | 1.03 | 0.005 | 1.03 | 0.042 | 1.02 | 0.118 | |||
| SD-TPSRa | 1.01 | 0.226 | |||||||
OR, odds ratio; Bootstrap 95% confidence interval (CI), bias-corrected; Vmin, minimum indexed LA volume; Smax, maximum longitudinal LA strain; SRmax, peak longitudinal strain rate; SRe, early diastolic strain rate; SRa, late diastolic strain rate; TPS, time-to-peak strain; TPSpreA, time-to-peak preatrial contraction strain; TPSR, time-to-peak strain rate at left ventricular systole; SpreA, preatrial contraction strain.
Model 1: Unadjusted.
Model 2: Adjusted for CHA2DS2-VASC prior to stroke/TIA.
Model 3: Adjusted for model 2 and minimum LA volume.
Model 4: Adjusted for model 3 and maximum longitudinal strain.
LA dyssynchrony and modified CHA2D-VASC score
Figure 5 shows the result of ROC curve analyses based on a risk stratification scheme using clinical predictors of stroke, not including stroke itself (CHA2D-VASc), scoring system and the grade of dyssynchrony defined by SD-TPS: Cardiac failure (+1 point), Hypertension (+1 point), Age (65–74: +1 point, ≥75: +2 points), VAscular disease (+1 point), Sex category (+1 point), and SD-TPS grade (Grade = 3: +1). This new scheme showed higher OR (2.10 vs. 1.84, P = 0.001) and the higher C-statistics: 0.82 vs. 0.75, P < 0.001 compared with the CHA2D-VASc score alone. In addition, the AUC for SD-TPS (=0.83) was higher than the AUC for other parameters of LA structure and function: Smax (=0.68), maximum LA volume (Vmax) (=0.65), and Vmin (=0.70).
Figure 5.

Receiver operating characteristics (ROC). Blue line, CHA2DS2-VASC before stroke; red line, CHA2DS2-VASC before stroke. +Dyssynchrony grades; green line, reference.
Discussion
In this cross-sectional study, we found that LA mechanical dyssynchrony during sinus rhythm is independently associated with a history of stroke/TIA in patients with AF. The value of LA mechanical dyssynchrony using 3D echocardiogram in predicting recurrence after catheter ablation of AF has been reported.12 However, to our knowledge this is the first study to demonstrate the association between LA mechanical dyssynchrony and stroke/TIA using CMR.
LA mechanical dyssynchrony as a mechanism of intracardiac thrombogenesis
Currently, there is an ongoing paradigm shift in our understanding of the mechanisms of stroke in patients with AF. The classic paradigm is that AF produces stasis of blood within the LA, which causes thrombus formation and embolism in the brain. In contrast, a new paradigm is that alterations in LA structure and function during sinus rhythm are causally related to thrombo-embolism, and AF is not mechanistically responsible for the thrombo-embolic events;13,14 In fact, indices of LA structural remodelling, including larger LA size,15–17 larger extent of LA fibrosis,18 lower LA function,8,19 and lower LA appendage function20 in sinus rhythm are known markers of stroke. We did not find significant difference in LA fibrosis between the stroke group and the control group. One possible explanation to account for this finding is a relatively small sample size of the patients who underwent LGE. Another possible explanation is that LA mechanical dyssynchrony may sensitively detect subtle changes in LA architecture that is not captured by LGE. In fact, multivariable analysis showed that LA dyssynchrony remained significant after adjusting for LA fibrosis. Our findings contribute to the new paradigm by providing a possible mechanistic link as to how abnormal LA structure and function during sinus rhythm, a solid mechanics process, alter the LA regional blood flow, a fluid mechanics process, to cause intracardiac thrombosis. Our results indicate that SD-TPS is significantly higher in the stroke group compared with the control group (Figures 3 and 4). The lack of coordination during the reservoir phase of may slow down the regional blood flow in the vicinity of the LA wall and promote seeding of thrombus. This is consistent with a seemingly counterintuitive findings that individuals with the LA appendage closure device are more likely to have ischaemic stroke,21 suggesting that not all the thrombus originates from the LA appendage.
Figure 4.

Frequency (%) of each grade of dyssynchrony among study population. Grades according to percentiles of SD-TPS. Grade I: ≤33rd; Grade II: 33rd–66th and Grade III: ≥66th. Fisher’s exact test.
Clinical implications
The CHADS2 and CHA2DS2-VASC scoring systems have only a modest discriminatory ability to assess the risk of stroke in patients with AF,22,23 with c-statistics ranging from 0.56 (modified CHADS2) to 0.69 (CHA2DS2-VASC). The discriminatory ability of the CHA2DS2-VASC scoring system can be improved by adding the Smax.8,24 Our study demonstrated that LA dyssynchrony further improves the discriminatory ability as evidenced by a significant increase in C-statistics (0.82 vs. 0.75, P < 0.001) and OR (2.10 vs. 1.84, P = 0.001). Therefore, LA dyssynchrony may find its role in the clinical conundrum with the patients with the CHA2DS2-VASC score of 1. Although the current guidelines do not strongly recommend chronic oral anticoagulation for those patients,3 a large retrospective study showed that those subjects had a significantly higher risk of stroke compared with the general population (HR: 2.38–2.25).6 The clinical outcomes of those patients can also be improved by oral anticoagulation.25 Since individuals with the CHA2DS2-VASC score of 1 represent a heterogeneous population,6 assessment of LA dyssynchrony may help distinguish high-risk from low-risk individuals (Figure 5).
Limitations
This study represents a single-centre, retrospective, cross-sectional analysis of patients referred for catheter ablation of AF. Therefore, there is a non-negligible chance of selection bias. We also exclude 127 patients which may have introduced additional bias into our results. However, we believe the bias is minimum because the clinical characteristics of patients included in and excluded from the analysis were similar except for the type of AF, history of hypertension, and ACEI/ARB use (Supplementary data online, Table S1). Also, CMR was not performed at the time of stroke/TIA, and the time from stroke to CMR could not be determined from the records. Moreover, the stroke mechanism in each patient is unclear from the record. For the dyssynchrony analysis, we used only two- and four-chamber cine CMR, which was included in a routine image-acquisition protocol. Therefore, it is possible that our analysis underestimated the degree of dyssynchrony by missing regions that were not covered by those two views. Since the strain was 2D and was obtained only in the in-plane directions, the strain values may have been underestimated compared with those in 3D strains. Besides, the CMR temporal resolution may also explain our lower values of dyssynchrony compared with 3D echocardiogram.10 Despite these potential causes of underestimation, our analysis demonstrated a significant association between LA dyssynchrony and a prior history of stroke. Therefore, we believe that the advantage of our approach outweighs the disadvantage of including more views to assess the whole LA deformation, which would increase the scan time and post-processing burden.
Conclusions
Higher mechanical dyssynchrony of the LA during sinus rhythm is associated with a history of stroke/TIA in patients with AF. Mechanical dyssynchrony of the LA may contribute to thrombogenesis by promoting a reduction of regional blood flow within the LA due to a loss of co-ordinated contraction.
Supplementary data
Supplementary data are available at European Heart Journal - Cardiovascular Imaging online.
Supplementary Material
Acknowledgements
We thank Ela Chamera and Jason Ortman for helping with image data management.
Conflict of interest: None declared.
Funding
This work was supported by research grants from the W.W. Smith Charitable Trust (to H.A.), the Magic That Matters Fund for Cardiovascular Research (to H.A.), the Zegar Family Foundation (to H.A.), the Johns Hopkins University Institute of Clinical and Translational Research (to H.A.), the Edward St. John Foundation for AF Research (to H.C.), The Roz and Marvin H Weiner and Family Foundation (to H.C.), The Dr. Francis P. Chiaramonte Foundation (to H.C.), The Marilyn and Christian Poindexter Arrhythmia Research Fund (to H.C.), and The Norbert and Louise Grunwald Cardiac Arrhythmia Research Fund (to H.C.).
References
- 1. Mozaffarian D, Benjamin EJ, Go AS, Arnett DK, Blaha MJ, Cushman M. et al. Executive summary: heart disease and stroke statistics-2016 update: a report from the American Heart Association. Circulation 2016;133:447–54. [DOI] [PubMed] [Google Scholar]
- 2. Lin HJ, Wolf PA, Kelly-Hayes M, Beiser AS, Kase CS, Benjamin EJ. et al. Stroke severity in atrial fibrillation. The Framingham Study. Stroke 1996;27:1760–4. [DOI] [PubMed] [Google Scholar]
- 3. January CT, Wann LS, Alpert JS, Calkins H, Cigarroa JE, Cleveland JC Jr. et al. 2014 AHA/ACC/HRS guideline for the management of patients with atrial fibrillation: a report of the American College of Cardiology/American Heart Association Task Force on Practice Guidelines and the Heart Rhythm Society. J Am Coll Cardiol 2014;64:e1–76. [DOI] [PubMed] [Google Scholar]
- 4. Lip GY, Nieuwlaat R, Pisters R, Lane DA, Crijns HJ.. Refining clinical risk stratification for predicting stroke and thromboembolism in atrial fibrillation using a novel risk factor-based approach: the euro heart survey on atrial fibrillation. Chest 2010;137:263–72. [DOI] [PubMed] [Google Scholar]
- 5. Mitchell LB, Southern DA, Galbraith D, Ghali WA, Knudtson M, Wilton SB. et al. Prediction of stroke or TIA in patients without atrial fibrillation using CHADS2 and CHA2DS2-VASc scores. Heart 2014;100:1524–30. [DOI] [PubMed] [Google Scholar]
- 6. Chao TF, Liu CJ, Wang KL, Lin YJ, Chang SL, Lo LW. et al. Should atrial fibrillation patients with 1 additional risk factor of the CHA2DS2-VASc score (beyond sex) receive oral anticoagulation? J Am Coll Cardiol 2015;65:635–42. [DOI] [PubMed] [Google Scholar]
- 7. Healey JS, Connolly SJ, Gold MR, Israel CW, Van Gelder IC, Capucci A. et al. Subclinical atrial fibrillation and the risk of stroke. N Engl J Med 2012;366:120–9. [DOI] [PubMed] [Google Scholar]
- 8. Inoue YY, Alissa A, Khurram IM, Fukumoto K, Habibi M, Venkatesh BA. et al. Quantitative tissue-tracking cardiac magnetic resonance (CMR) of left atrial deformation and the risk of stroke in patients with atrial fibrillation. J Am Heart Assoc 2015;4:e001844. [DOI] [PMC free article] [PubMed] [Google Scholar]
- 9. Zareian M, Ciuffo L, Habibi M, Opdahl A, Chamera EH, Wu CO. et al. Left atrial structure and functional quantitation using cardiovascular magnetic resonance and multimodality tissue tracking: validation and reproducibility assessment. J Cardiovasc Magn Reson 2015;17:52.. [DOI] [PMC free article] [PubMed] [Google Scholar]
- 10. Mochizuki A, Yuda S, Oi Y, Kawamukai M, Nishida J, Kouzu H. et al. Assessment of left atrial deformation and synchrony by three-dimensional speckle-tracking echocardiography: comparative studies in healthy subjects and patients with atrial fibrillation. J Am Soc Echocardiogr 2013;26:165–74. [DOI] [PubMed] [Google Scholar]
- 11. Dell'Era G, Rondano E, Franchi E, Marino PN.. Novara Atrial Fibrillation Study G. Atrial asynchrony and function before and after electrical cardioversion for persistent atrial fibrillation. Eur J Echocardiogr 2010;11:577–83. [DOI] [PubMed] [Google Scholar]
- 12. Kobayashi Y, Okura H, Kobayashi Y, Okawa K, Banba K, Hirohata A. et al. Assessment of atrial synchrony in paroxysmal atrial fibrillation and impact of pulmonary vein isolation for atrial dyssynchrony and global strain by three-dimensional strain echocardiography. J Am Soc Echocardiogr 2014;27:1193–9. [DOI] [PubMed] [Google Scholar]
- 13. Piccini JP, Daubert JP.. Atrial fibrillation and stroke: it's not necessarily all about the rhythm. Heart Rhythm 2011;8:1424–5. [DOI] [PubMed] [Google Scholar]
- 14. Kamel H, Okin PM, Elkind MS, Iadecola C.. Atrial fibrillation and mechanisms of stroke: time for a new model. Stroke 2016;47:895–900. [DOI] [PMC free article] [PubMed] [Google Scholar]
- 15. Benjamin EJ, D'agostino RB, Belanger AJ, Wolf PA, Levy D.. Left atrial size and the risk of stroke and death. The Framingham Heart Study. Circulation 1995;92:835–41. [DOI] [PubMed] [Google Scholar]
- 16. Kizer JR, Bella JN, Palmieri V, Liu JE, Best LG, Lee ET. et al. Left atrial diameter as an independent predictor of first clinical cardiovascular events in middle-aged and elderly adults: the Strong Heart Study (SHS). Am Heart J 2006;151:412–8. [DOI] [PubMed] [Google Scholar]
- 17. Tsang TS, Abhayaratna WP, Barnes ME, Miyasaka Y, Gersh BJ, Bailey KR. et al. Prediction of cardiovascular outcomes with left atrial size: is volume superior to area or diameter? J Am Coll Cardiol 2006;47:1018–23. [DOI] [PubMed] [Google Scholar]
- 18. Daccarett M, Badger TJ, Akoum N, Burgon NS, Mahnkopf C, Vergara G. et al. Association of left atrial fibrosis detected by delayed-enhancement magnetic resonance imaging and the risk of stroke in patients with atrial fibrillation. J Am Coll Cardiol 2011;57:831–8. [DOI] [PMC free article] [PubMed] [Google Scholar]
- 19. Russo C, Jin Z, Liu R, Iwata S, Tugcu A, Yoshita M. et al. LA volumes and reservoir function are associated with subclinical cerebrovascular disease: the CABL (Cardiovascular Abnormalities and Brain Lesions) study. JACC Cardiovasc Imaging 2013;6:313–23. [DOI] [PMC free article] [PubMed] [Google Scholar]
- 20. Al-Issa A, Inoue Y, Cammin J, Tang Q, Nazarian S, Calkins H. et al. et al. Regional function analysis of left atrial appendage using motion estimation CT and risk of stroke in patients with atrial fibrillation. Eur Heart J Cardiovasc Imaging 2015;17:788–796. [DOI] [PMC free article] [PubMed] [Google Scholar]
- 21. Holmes DR Jr, Reddy VY.. Left atrial appendage and closure: who, when, and how. Circ Cardiovasc Interv 2016;9:e002942.. [DOI] [PubMed] [Google Scholar]
- 22. Fang MC, Go AS, Chang Y, Borowsky L, Pomernacki NK, Singer DE.. Comparison of risk stratification schemes to predict thromboembolism in people with nonvalvular atrial fibrillation. J Am Coll Cardiol 2008;51:810–5. [DOI] [PMC free article] [PubMed] [Google Scholar]
- 23. Baruch L, Gage BF, Horrow J, Juul-Moller S, Labovitz A, Persson M. et al. Can patients at elevated risk of stroke treated with anticoagulants be further risk stratified? Stroke 2007;38:2459–63. [DOI] [PubMed] [Google Scholar]
- 24. Obokata M, Negishi K, Kurosawa K, Tateno R, Tange S, Arai M. et al. Left atrial strain provides incremental value for embolism risk stratification over CHA(2)DS(2)-VASc score and indicates prognostic impact in patients with atrial fibrillation. J Am Soc Echocardiogr 2014;27:709–16.e4. [DOI] [PubMed] [Google Scholar]
- 25. Fauchier L, Lecoq C, Clementy N, Bernard A, Angoulvant D, Ivanes F. et al. Oral anticoagulation and the risk of stroke or death in patients with atrial fibrillation and one additional stroke risk factor: the Loire Valley Atrial Fibrillation Project. Chest 2015;4:960–968. [DOI] [PubMed] [Google Scholar]
Associated Data
This section collects any data citations, data availability statements, or supplementary materials included in this article.