

Abstract
Background
The effect of temperature and humidity on the incidence of influenza may differ by climate region. In addition, the effect of diurnal temperature range on influenza incidence is unclear, according to previous study findings.
Objectives
The aim of this study was to analyze the effects of temperature, humidity, and diurnal temperature range on the incidence of influenza in Seoul, Republic of Korea, which is located in a temperate region.
Methods
We used Korean National Health insurance data to assess the weekly influenza incidence between 2010 and 2016, and used meteorological data from Seoul. To investigate the effect of temperature, relative humidity, and diurnal temperature range levels on influenza incidence, we used a distributed lag non‐linear model.
Results
The risk of influenza incidence was significantly increased with low daily temperatures of 0‐5°C and low (30%–40%) or high (70%) relative humidity. We found a positive significant association between diurnal temperature range and influenza incidence in this study.
Conclusions
Influenza incidence increased with low temperature and low/high humidity in a temperate region. Influenza incidence also increased with high diurnal temperature range, after considering temperature and humidity.
Keywords: diurnal temperature range, humidity, influenza, temperature
1. INTRODUCTION
Influenza places a great burden on public health and the economy.1 Various factors affect influenza transmission, including household structure,2 individual behavior,3 and climate variables.4 Previous studies have reported that environmental factors such as temperature, humidity, and precipitation can affect influenza transmission.5 Humidity and temperature conditions contribute to the seasonality of influenza outbreaks6; two types of environmental conditions are associated with influenza outbreaks: “cold‐dry” and “humid‐rainy.”7
Multiple studies have measured the association between low temperatures and influenza infection.8, 9 Several studies have reported the significant effect of temperature on influenza.10, 11 For example, Jaakkola et al8 showed that a 1°C decrease in temperature increased the estimated risk of influenza occurrence by 11% among military conscripts in Finland. However, other studies have found no significant association between temperature and influenza incidence.9
The relationship between humidity and influenza activity is unclear. Shaman et al12 showed that low absolute humidity drives seasonal variations in influenza transmission. The same researchers also reported that influenza activity modulated by seasonal changes in absolute humidity was consistent with the timing of pandemic influenza outbreaks.13, 14 A study based in the United States investigating the effect of humidity and temperature on influenza mortality reported that low absolute humidity was associated with increases in influenza mortality.15 However, one Japanese study reported that the number of patients with influenza increased significantly during times of high relative humidity.16 In addition, several studies did not find a significant association between humidity and influenza activity.10, 17
The association of temperature or humidity with influenza may differ by region. For example, Soebiyanto et al18 reported that seasonal influenza showed a positive association with humidity in El Salvador and Panama but a negative association in Guatemala, which is a similarly temperate region. Another study investigating the relationship between weather factors and influenza epidemics reported different exposure‐response relationships by region.19 Additional studies assessing the effect of weather on influenza in various regions are needed.
Previous works have reported that the diurnal temperature range (DTR) is a risk factor for mortality,20 including respiratory‐related mortality,21 cardiovascular mortality,22, 23 and asthma.24 Although several studies have reported the effect of DTR on influenza hospitalization25 or seasonal influenza,26 research assessing the effect of DTR on influenza is scarce and the findings controversial.
In this study, we aimed to assess the effect of temperature, humidity, and DTR on the incidence of influenza in Seoul, Republic of Korea, which is located in a temperate region.
2. METHODS
2.1. Data collection
We extracted the data of patients diagnosed with influenza between 2010 and 2016 from the database of the Korea National Health Insurance Service (NHIS‐2018‐1‐075). This database includes information of the obligatory national health insurance system, and beneficiaries include nearly the entire Korean population.27
Patients are diagnosed when they visit primary clinics or are admitted to hospitals. We extracted data from patients with disease codes J09 (influenza derived from a specific influenza virus strain), J10 (influenza derived from the influenza virus, strain not identified), and J11 (influenza, virus not identified), according to the Korea Informative Classification of Disease (KOICD).28
In this study, we used influenza incidence in Seoul, the capital of the Republic of Korea. Nearly 10 out of 50 million Koreans reside in Seoul.29 As daily incidence data are not provided in the Korea National Health Insurance Service to protect the personal information of patients, we used weekly influenza incidence data in this study.
Previous studies have shown a relationship between influenza and air pollution. In a Taiwan study, influenza among adults and older people was affected by ambient fine particles.30 A study in China showed that increased air pollutant concentrations were associated with an increase in cases of influenza‐like illness.31 A study by Nakao et al32 using Korean data reported that air pollution causes respiratory symptoms. Therefore, we included air pollution data as a covariate in this study.
Temperature, humidity, and air pollution data were obtained from the Korea Meteorological Administration Web site.13 As Korean meteorological stations only provide data of relative humidity without absolute humidity, relative humidity was used for the present analysis. Seoul meteorological stations provide data of daily temperature and relative humidity. Air pollution data were obtained from Air Quality Information of the Seoul Metropolitan Government.33 Air pollutants included in the analysis were ozone (O3), particulate matter <10 µm in diameter (PM10), nitrogen dioxide (NO2), and sulfur dioxide (SO2). Levels of these pollutants were obtained from the same source. For weekly meteorological data, mean data values in each week were used.
2.2. Statistical analysis
Associations between temperature, humidity, and air pollutants and the incidence of influenza were assessed using Spearman's correlation analysis. To investigate the non‐linear and delayed effects of meteorological factors on influenza incidence, a distributed lag non‐linear model was used. The effects of daily temperature and humidity were assessed using 5 df natural cubic spline for mean temperature and 1 df natural cubic spline for lag up to 2 weeks. The effect of DTR was assumed to be linear, based on previous studies.20 We used lags up to 2 weeks for temperature/humidity10, 17, 34 and DTR.20, 35 PM10, O3, and NO2 were controlled using 3 df natural cubic spline.35
where Yt denotes the influenza incidence count on day t, μt is the expected influenza incidence on day t, and ns (temperature), ns (humidity), and ns (DTR) indicate a natural cubic spline of ambient temperature, relative humidity, and DTR on day t, respectively. COVs are potential confounders including ozone, NO2, SO2, and PM10. After comparison of Poisson, quasi‐Poisson, and negative binomial models, the quasi‐Poisson model was selected based on the residual and assumption tests. The quasi‐Poisson likelihood model was used to consider overdispersion. First, we investigated the effect of temperature and humidity. Subsequently, the effect of DTR was assessed, controlling for temperature and humidity. We reported the relative risk (RR) with 95% confidence intervals (CIs) of temperature, humidity, and change in DTR on influenza incidence with 10°C, 60%, and 8°C as reference values, respectively, which are close to the mean values. Residuals were evaluated to assess adequacy of the model.
For all statistical tests, two‐tailed P < .05 was considered statistically significant. The dlnm package in R software version 3.4.4 (The R Project for Statistical Computing, Vienna, Austria) was used to fit all the models. All analyses were conducted in 2019. For sensitivity analysis, we changed the degrees of freedom for time to control for season, and maximum lag for temperature, humidity, and DTR.
3. RESULTS
3.1. Influenza incidence and weather
Over the length of the observation period (January 3, 2010 to December 31, 2016), the mean weekly incidence of influenza was 3462.5 cases (highest: 100 253 cases). Temperatures ranged from −14.5°C to 31.8°C, and humidity ranged from 23.4% to 94.1%. Average temperature and humidity during this period were 13.0°C and 60.6%, respectively. The DTR was 1.4‐15.6°C with an average 8.4°C. Mean concentrations in Seoul of PM10, O3, NO2, and SO2 were 44.5 μg/m3, 24.5 ppb, 27.6 ppb, and 5.0 ppb (Table 1).
Table 1.
Descriptive statistics of weekly influenza incidence, temperature, humidity, and air pollutant levels in Seoul, Republic of Korea (2010‐2016)
| Mean (SD) | Minimum | Q1 | Q3 | Maximum | ||
|---|---|---|---|---|---|---|
| Cases diagnosed/week (N) | 3462.5 (8548.5) | 200 | 422 | 2439 | 100 253 | |
| Weather | Temperature (°C) | 13.0 (10.8) | −14.5 | 4.1 | 23.0 | 31.8 |
| Humidity (%) | 60.6 (15.1) | 23.4 | 48.5 | 72.8 | 94.1 | |
| DTR (°C) | 8.4 (2.9) | 1.4 | 6.3 | 10.4 | 15.6 | |
| Air pollutant | PM10 (µg/m3) | 44.5 (28.8) | 4.7 | 26.3 | 54.0 | 248.5 |
| Ozone (ppb) | 24.5 (12.6) | 2.9 | 15.3 | 33.2 | 71.1 | |
| NO2 (ppb) | 27.6 (11.4) | 9.0 | 18.9 | 35.0 | 62.1 | |
| SO2 (ppb) | 5.0 (1.6) | 2.2 | 3.9 | 5.8 | 12.5 | |
Number of weeks is 365. There were no missing data.
Abbreviations: DTR, diurnal temperature range; NO2, nitrogen dioxide; PM10, particulate matter <10 µm in diameter; SD, standard deviation; SO2, sulfur dioxide.
Figure 1 shows the trends of daily incidence for influenza, temperature, and humidity. Whereas one peak in influenza outbreaks can be seen in 2011, 2013, and 2014, two peaks are visible in other years. The incidence of influenza was higher during winter months (December‐February) than summer months. Temperature and humidity were highest during June to August, which is the summer season in Korea (Figure 1).
Figure 1.
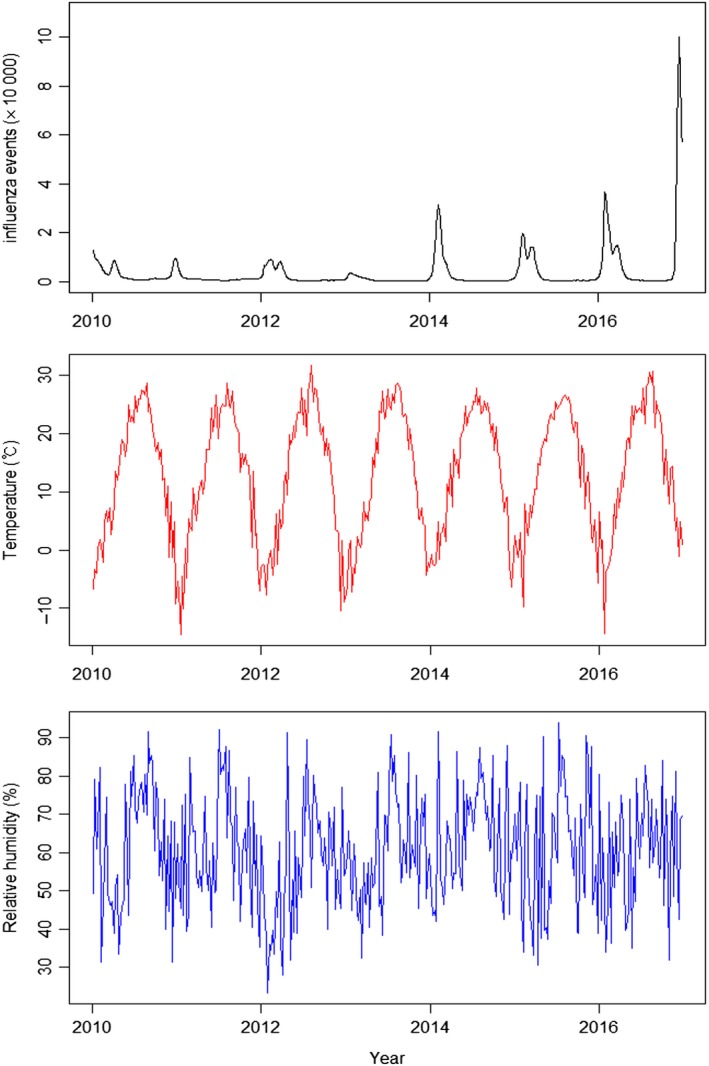
Trends of influenza incidence, temperature, and humidity during 2010‐2016 in Seoul, Republic of Korea
3.1.1. Correlation between influenza incidence and meteorological factors
Influenza incidence was negatively associated with temperature (r = −.70) and humidity (r = −.36). A positive association with influenza incidence was observed for PM10 (r = .38), NO2 (r = .38), and SO2 (r = .39), and weak negative associations were observed for O3 (r = −.20) (Table 2).
Table 2.
Spearman's correlation between meteorological factors and air pollutant levels and influenza incidence
| Influenza | Temperature | Humidity | DTR | PM10 | Ozone | NO2 | SO2 | |
|---|---|---|---|---|---|---|---|---|
| Influenza incidence | 1 | |||||||
| Temperature | −0.70*** | 1 | ||||||
| Humidity | −0.36*** | 0.39*** | 1 | |||||
| DTR | 0.11* | 0.02 | −0.58*** | 1 | ||||
| PM10 | 0.38*** | −0.27*** | −0.24*** | 0.26*** | 1 | |||
| Ozone | −0.20*** | 0.44*** | −0.18*** | 0.32*** | 0.07 | 1 | ||
| NO2 | 0.38*** | −0.40*** | −0.17 | 0.27*** | 0.60*** | −0.42*** | 1 | |
| SO2 | 0.39*** | −0.50*** | −0.35*** | 0.27*** | 0.68*** | −0.13* | 0.67*** | 1 |
Abbreviations: DTR, diurnal temperature range; NO2, nitrogen dioxide; PM10, particulate matter <10 µm in diameter; SO2, sulfur dioxide.
P < .05.
P < .001.
3.1.2. Effects of temperature, humidity, and DTR on influenza incidence
Figure 2 shows the three‐dimensional relationship between weekly meteorological data and influenza cases across 2 lag weeks. Overall, the estimated effects of temperature and humidity on influenza incidence were non‐linear. A visual inspection of the figure suggests that there was increased RR of influenza at low temperatures and a large DTR. The effect of a large DTR decreased over the lag period (Figure 2). With respect to humidity, since data of 6 weeks with over 90% relative humidity showed a high risk of influenza occurrence, the relationship between influenza and humidity lower than 90% was also shown in Figure 2C.
Figure 2.
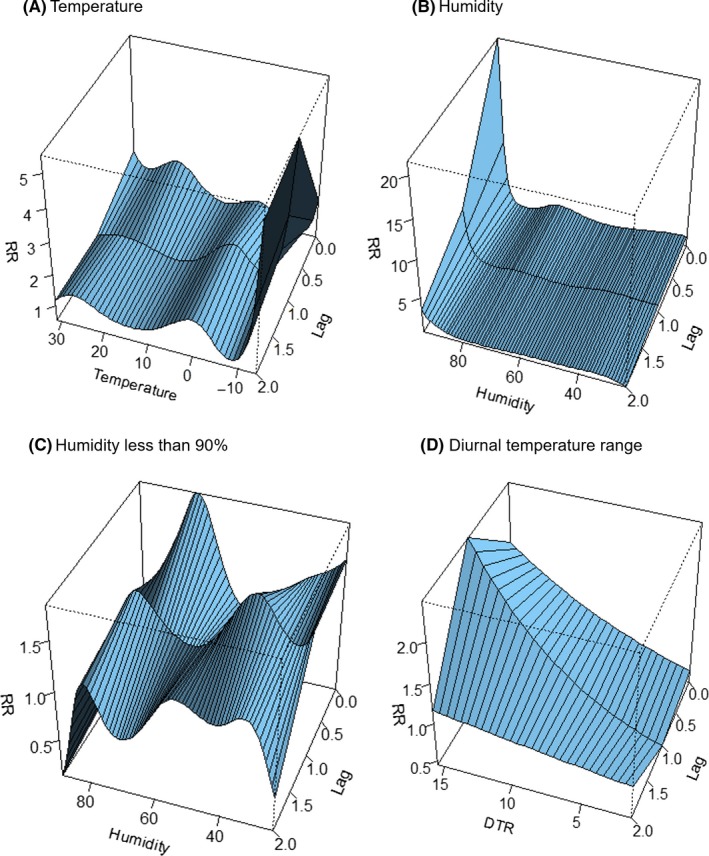
Three‐dimensional plot of relative risk (RR) for temperature (A), humidity (B), and diurnal temperature range (DTR) (C) and lags for influenza incidence
The RR of influenza for specific lag periods (0, 1, and 2 weeks) and specific values of temperature, humidity, and DTR are presented in Table 3. Values of temperature, humidity, and DTR were selected, considering the distribution of each factor. Temperatures lower than the reference value (10°C) were associated with increased influenza incidence across all lag days, and the overall effect was significant only at 0°C (RR: 4.04, 95% CI: 1.25‐13.02) and 5°C (RR: 1.96, 95% CI: 1.09‐3.51), shown in Table 3.
Table 3.
Relative risks with different values of temperature, humidity, and diurnal temperature range for influenza incidence in Seoul, Republic of Korea
| Value | RR (95% CI) | ||||
|---|---|---|---|---|---|
| Lag 0 | Lag 1 wk | Lag 2 wk | Lag 0‐2 wk (Overall effect) | ||
| Temperature (°C) | 0 | 1.26 (0.70, 2.24) | 1.90*(1.04, 3.46) | 1.70 (0.93, 3.08) | 4.04*(1.25, 13.02) |
| 5 | 1.05 (0.75, 1.46) | 1.36 (0.97, 1.90) | 1.38 (0.98, 1.93) | 1.96*(1.09, 3.51) | |
| 15 | 1.48 (0.85, 2.59) | 1.04 (0.58, 1.86) | 0.95 (0.53, 1.69) | 1.46 (0.59, 3.61) | |
| 20 | 1.98 (0.60, 6.47) | 1.23 (0.37, 4.12) | 1.13 (0.34, 3.72) | 2.76 (0.38, 19.79) | |
| Relative humidity (%) | 30 | 1.74*(1.05, 2.87) | 1.48 (0.90, 2.43) | 1.07 (0.64, 1.81) | 2.76*(1.24, 6.13) |
| 40 | 1.25 (0.80, 1.94) | 1.65*(1.11, 2.46) | 1.14 (0.76, 1.71) | 2.34*(1.17, 4.71) | |
| 50 | 0.85 (0.66, 1.11) | 1.25 (0.98, 1.60) | 1.06 (0.83, 1.35) | 1.13 (0.75, 1.72) | |
| 70 | 1.90*(1.37, 2.62) | 1.23 (0.89, 1.70) | 0.83 (0.59, 1.17) | 1.93*(1.08, 3.46) | |
| 80 | 0.84 (0.49, 1.46) | 1.12 (0.67, 1.87) | 0.87 (0.57, 1.33) | 0.83 (0.03, 2.08) | |
| DTR (°C) | 2 | 0.64*(0.46, 0.88) | 0.49*(0.35, 0.68) | 0.88 (0.62, 1.25) | 0.27*(0.15, 0.48) |
| 5 | 0.80*(0.68, 0.94) | 0.70*(0.59, 0.82) | 0.94 (0.79, 1.12) | 0.52*(0.39, 0.70) | |
| 11 | 1.25*(1.06, 1.47) | 1.44*(1.22, 1.69) | 1.07 (0.89, 1.27) | 1.92*(1.44, 2.56) | |
| 14 | 1.57*(1.13, 2.17) | 2.06*(1.48, 2.87) | 1.14 (0.80, 1.62) | 3.67*(2.06, 6.54) | |
For temperature and DTR, 10 and 8°C, which are close to mean values, were used as the reference values, respectively, to calculate RR. For relative humidity, 60% was used as reference.
Abbreviations: CI, confidence interval; DTR, diurnal temperature range; RR, relative risk.
P < .05.
Low humidity (30%) showed increased risk for the current (RR: 1.1, 95% CI: 1.05 − 1.16) periods and overall effect (RR: 2.76, 95% CI: 1.24 − 6.13). Lower relative humidity (40%) than the reference (60%) also showed higher influenza risk (RR: 2.34, 95% CI: 1.17 − 4.71). Although 80% relative humidity showed lower risk of influenza, 70% showed overall increased risk of influenza as compared with 60% (RR: 1.93, 95% CI: 1.08 − 3.46).
The effect of DTR on influenza was significant over short‐term periods, such as lag 0 days, and 1‐2 weeks lag period. For current, lag one, and lag 2 weeks, all DTR values had a significant effect on influenza incidence. A 3°C increase or decrease in DTR was associated with an approximately 30% change in influenza incidence. The overall effect of lower DTR (RR: 0.27, 95% CI: 0.15‐0.48 for DTR 2°C; and RR: 0.52, 95% CI: 0.39‐0.70 for DTR 5°C) as compared with the reference showed decreased risk and that of higher DTR showed increased risk (RR: 1.92, 95% CI: 1.44‐2.56 for DTR 11°C; and RR: 3.67, 95% CI: 2.06‐6.54 for DTR 14°C).
We changed the lag periods for meteorological data, and the effect of these factors and trends were not substantially changed, and the effect of DTR was significant in all models. Changes in the degrees of freedom for seasonal control showed similar results (Figure S1). A residual plot was also created, to check the assumption of analysis (Table S2).
4. DISCUSSION
Studies conducted in temperate regions, such as that of the Republic of Korea, have yielded contrasting results. Whereas several studies have failed to find an effect of temperature9 or humidity,10, 17 other studies have reported an association between temperature and humidity and the incidence of influenza. Sundell et al36 showed that influenza was associated with low temperatures. In the present study, we found that low temperatures were associated with a high incidence of influenza in a temperate region.
Tamerius et al7 reported that cold‐dry and humid‐rainy conditions were associated with seasonal influenza epidemics in temperate and tropical areas. The result of the present study also showed a high risk of influenza with high (70%) or lower (<40%) humidity. An increased risk influenza in high humidity higher than 90% might be contributed by small number of cases, which was only 6 weeks. Despite two previous studies reporting that influenza activity was negatively associated with absolute humidity in temperate regions,15, 37 another study in Japan showed an increased influenza incidence in high humidity.16 Further studies of the association between humidity and influenza incidence in temperate regions are needed.
Even though previous studies have reported the association between DTR and mortality20, 22 and respiratory disease,21, 24 studies investigating the effect of DTR on influenza are rare. One Chinese study reported that DTR was significantly related to influenza seasonality in dry periods but not in humid periods.25 In another study conducted in France, the effect of daily temperature variation on seasonal influenza was not significant.26 The results of that study showed that high DTR was positively associated with influenza incidence even if the temperature is same.
We found that temperature and humidity had a short lagged effect, which was limited in one week, on influenza diagnosis. Tsuchihashi et al10 reported that lower temperatures during the 8 days prior to clinic visits affected influenza infection, and a Chinese study reported a longer incubation period of 13 days prior to disease onset.17 Another Chinese study investigating the impact of temperature on mortality reported that the effects of extremely high temperatures generally persisted for 3 days, whereas the risk with extremely low temperatures could persist for 21 days.34 One study conducted in a temperate region used a lag of 1 week to examine the effects of climate factors on seasonal influenza.26 Further research assessing the lagged effects of temperature and humidity on health is needed.
During 2010‐2016, two peaks of influenza epidemics occurred in 2010, 2012, 2015, and 2016. Influenza A and B are common in Korea. When peaks of influenza A and B differ, the influenza epidemic pattern shows two peaks.38 For example, in early 2012, the first peak was caused by influenza A and the second was owing to influenza B. In 2011, 2013, and 2014, there was one influenza peak. The reason for the presence of only one peak was that the influenza epidemic was only caused by influenza A in 2011 whereas in 2013 and 2014, outbreaks of influenza A and B occurred during similar periods.38
The range of climate factors affecting influenza activity may differ by virus strain. Human infection with avian influenza strain H7N9 has been reported to correlate with temperature (4‐14°C) and relative humidity (65%–95%) whereas infection with H5N1 is correlated with temperature and atmospheric pressure (980‐1025 kPa).39 There is clearly a need to investigate the rates of influenza incidence according to both climate and virus strain.
One limitation of this study is that weekly data rather than daily data were used; daily influenza incidence can reflect the change in daily weather better than weekly influenza incidence. However, this study was focused on the trend of influenza incidence and weather over a long period (ie, 6 years) rather than minor changes over a short duration. Thus, the present results provide information about the association between weather and influenza incidence.
Apart from temperature and humidity, previous studies have reported that seasonal changes in individual behavior and family and social structures5 might be associated with the incidence of influenza. In addition, a recent study showed an association between a decline in vaccination coverage and an increase in influenza incidence.40 We could not control for those factors in this study because of limited data. Social and behavioral factors should be considered in future studies.
CONFLICT OF INTEREST
The author declares that they have no competing interests.
RESEARCH INVOLVING HUMAN PARTICIPANTS AND/OR ANIMALS
The study did not include human participants or animals.
Supporting information
ACKNOWLEDGEMENTS
This work was supported by the National Research Council of Science & Technology (NST) grant by the Korea government (MSIP) (No. CRC‐16‐01‐KRICT) and Korea Institute of Oriental Medicine (G17273).
Park J‐E, Son W‐S, Ryu Y, Choi SB, Kwon O, Ahn I. Effects of temperature, humidity, and diurnal temperature range on influenza incidence in a temperate region. Influenza Other Respi Viruses. 2020;14:11–18. 10.1111/irv.12682
REFERENCES
- 1. Reed C, Chaves SS, Daily Kirley P, et al. Estimating influenza disease burden from population‐based surveillance data in the United States. PLoS ONE. 2015;10(3):e0118369. [DOI] [PMC free article] [PubMed] [Google Scholar]
- 2. Brown CR, McCaw JM, Fairmaid EJ, et al. Factors associated with transmission of influenza‐like illness in a cohort of households containing multiple children. Influenza Other Respir Viruses. 2015;9(5):247‐254. [DOI] [PMC free article] [PubMed] [Google Scholar]
- 3. Kucharski AJ, Kwok KO, Wei V, et al. The contribution of social behaviour to the transmission of influenza A in a human population. PLoS Pathog. 2014;10(6):e1004206. [DOI] [PMC free article] [PubMed] [Google Scholar]
- 4. Liang Y, Fang L, Pan H, et al. PM2.5 in Beijing ‐ temporal pattern and its association with influenza. Environ Health. 2014;13:102. [DOI] [PMC free article] [PubMed] [Google Scholar]
- 5. Pica N, Bouvier NM. Environmental factors affecting the transmission of respiratory viruses. Curr Opin Virol. 2012;2(1):90‐95. [DOI] [PMC free article] [PubMed] [Google Scholar]
- 6. Lowen AC, Steel J. Roles of humidity and temperature in shaping influenza seasonality. J Virol. 2014;88(14):7692‐7695. [DOI] [PMC free article] [PubMed] [Google Scholar]
- 7. Tamerius JD, Shaman J, Alonso WJ, et al. Environmental predictors of seasonal influenza epidemics across temperate and tropical climates. PLoS Pathog. 2013;9(3):e1003194. [DOI] [PMC free article] [PubMed] [Google Scholar]
- 8. Jaakkola K, Saukkoriipi A, Jokelainen J, et al. Decline in temperature and humidity increases the occurrence of influenza in cold climate. Environ Health. 2014;13(1):22. [DOI] [PMC free article] [PubMed] [Google Scholar]
- 9. Azziz Baumgartner E, Dao CN, Nasreen S, et al. Seasonality, timing, and climate drivers of influenza activity worldwide. J Infect Dis. 2012;206(6):838‐846. [DOI] [PubMed] [Google Scholar]
- 10. Tsuchihashi Y, Yorifuji T, Takao S, et al. Environmental factors and seasonal influenza onset in Okayama city, Japan: case‐crossover study. Acta Med Okayama. 2011;65(2):97‐103. [DOI] [PubMed] [Google Scholar]
- 11. Xu Z, Hu W, Williams G, Clements AC, Kan H, Tong S. Air pollution, temperature and pediatric influenza in Brisbane. Australia. Environ Int. 2013;59:384‐388. [DOI] [PubMed] [Google Scholar]
- 12. Shaman J, Pitzer VE, Viboud C, Grenfell BT, Lipsitch M. Absolute humidity and the seasonal onset of influenza in the continental United States. PLoS Biol. 2010;8(2):e1000316. [DOI] [PMC free article] [PubMed] [Google Scholar]
- 13. Korea Meteorological Admistration . Weather Information. 2017. http://www.kma.go.kr/eng/index.jsp. Accessed April 9, 2019.
- 14. Shaman J, Kohn M. Absolute humidity modulates influenza survival, transmission, and seasonality. Proc Natl Acad Sci USA. 2009;106(9):3243‐3248. [DOI] [PMC free article] [PubMed] [Google Scholar]
- 15. Barreca AI, Shimshack JP. Absolute humidity, temperature, and influenza mortality: 30 years of county‐level evidence from the United States. Am J Epidemiol. 2012;176(Suppl 7):S114‐122. [DOI] [PubMed] [Google Scholar]
- 16. Urashima M, Shindo N, Okabe N. A seasonal model to simulate influenza oscillation in Tokyo. Jpn J Infect Dis. 2003;56(2):43‐47. [PubMed] [Google Scholar]
- 17. Zhang YI, Feng C, Ma C, et al. The impact of temperature and humidity measures on influenza A (H7N9) outbreaks‐evidence from China. Int J Infect Dis. 2015;30:122‐124. [DOI] [PubMed] [Google Scholar]
- 18. Soebiyanto RP, Clara W, Jara J, et al. The role of temperature and humidity on seasonal influenza in tropical areas: Guatemala, El Salvador and Panama, 2008–2013. PLoS ONE. 2014;9(6):e100659. [DOI] [PMC free article] [PubMed] [Google Scholar]
- 19. Wang X‐L, Yang L, He D‐H, et al. Different responses of influenza epidemic to weather factors among Shanghai, Hong Kong, and British Columbia. Int J Biometeorol. 2017;61(6):1043‐1053. [DOI] [PubMed] [Google Scholar]
- 20. Lee W‐H, Lim Y‐H, Dang TN, et al. An investigation on attributes of ambient temperature and diurnal temperature range on mortality in five East‐Asian countries. Sci Rep. 2017;7(1):10207. [DOI] [PMC free article] [PubMed] [Google Scholar]
- 21. Luo Y, Zhang Y, Liu T, et al. Lagged effect of diurnal temperature range on mortality in a subtropical megacity of China. PLoS ONE. 2013;8(2):e55280. [DOI] [PMC free article] [PubMed] [Google Scholar]
- 22. Tam WW, Wong TW, Chair SY, Wong AH. Diurnal temperature range and daily cardiovascular mortalities among the elderly in Hong Kong. Arch Environ Occup Health. 2009;64(3):202‐206. [DOI] [PubMed] [Google Scholar]
- 23. Qiu H, Yu I, Tse LA, Tian LW, Wang XR, Wong TW. Is greater temperature change within a day associated with increased emergency hospital admissions for heart failure? Circ Heart Fail. 2013;6(5):930‐935. [DOI] [PubMed] [Google Scholar]
- 24. Xu ZW, Huang CR, Su H, Turner LR, Qiao Z, Tong SL. Diurnal temperature range and childhood asthma: a time‐series study. Environ Health. 2013;12:12. [DOI] [PMC free article] [PubMed] [Google Scholar]
- 25. Li Y, Wang XL, Zheng X. Impact of weather factors on influenza hospitalization across different age groups in subtropical Hong Kong. Int J Biometeorol. 2018;62(9):1615‐1624. [DOI] [PubMed] [Google Scholar]
- 26. Roussel M, Pontier D, Cohen JM, Lina B, Fouchet D. Quantifying the role of weather on seasonal influenza. BMC Public Health. 2016;16:441. [DOI] [PMC free article] [PubMed] [Google Scholar]
- 27. Lee S‐Y, Jung K‐Y, Lee IK, et al. Prevalence of treated epilepsy in Korea based on national health insurance data. J Korean Med Sci. 2012;27(3):285‐290. [DOI] [PMC free article] [PubMed] [Google Scholar]
- 28. Korea Informative Classification of Disease 2016 . http://www.koicd.kr. Accessed October 19, 2018.
- 29. Statistics Korea . Korean Statistical Index. 2017. http://www.index.go.kr. Accessed October 19, 2018.
- 30. Chen C, Hsieh YH, Su HC, Wu JJ. Causality test of ambient fine particles and human influenza in Taiwan: Age group‐specific disparity and geographic heterogeneity. Environ Int. 2018;111:354‐361. [DOI] [PubMed] [Google Scholar]
- 31. Huang L, Zhou L, Chen J, et al. Acute effects of air pollution on influenza‐like illness in Nanjing, China: A population‐based study. Chemosphere. 2016;147:180‐187. [DOI] [PubMed] [Google Scholar]
- 32. Nakao M, Ishihara Y, Kim CH, Hyun IG. The impact of air pollution, including Asian sand dust, on respiratory symptoms and health‐related quality of life in outpatients with chronic respiratory disease in Korea: a panel study. J Prev Med Public Health. 2018;51(3):130‐139. [DOI] [PMC free article] [PubMed] [Google Scholar]
- 33. Seoul Metropolitan Government . Air Quality Information. 2018. http://cleanair.seoul.go.kr. Accessed October 19, 2018.
- 34. Bao J, Wang Z, Yu C, Li X. The influence of temperature on mortality and its Lag effect: a study in four Chinese cities with different latitudes. BMC Public Health. 2016;16:375. [DOI] [PMC free article] [PubMed] [Google Scholar]
- 35. Yang J, Liu H‐Z, Ou C‐Q, et al. Global climate change: Impact of diurnal temperature range on mortality in Guangzhou. China. Environ Pollut. 2013;175:131‐136. [DOI] [PubMed] [Google Scholar]
- 36. Sundell N, Andersson LM, Brittain‐Long R, Lindh M, Westin J. A four year seasonal survey of the relationship between outdoor climate and epidemiology of viral respiratory tract infections in a temperate climate. J Clin Virol. 2016;84:59‐63. [DOI] [PMC free article] [PubMed] [Google Scholar]
- 37. Soebiyanto RP, Gross D, Jorgensen P, et al. Associations between Meteorological Parameters and Influenza Activity in Berlin (Germany), Ljubljana (Slovenia), Castile and Leon (Spain) and Israeli Districts. PLoS ONE. 2015;10(8):e0134701. [DOI] [PMC free article] [PubMed] [Google Scholar]
- 38. World Health Organization . Influenza Laboratory Surveillance Information. 2018. http://apps.who.int/flumart/Default?ReportNo=7. Accessed October 19, 2018.
- 39. Li J, Rao Y, Sun Q, et al. Identification of climate factors related to human infection with avian influenza A H7N9 and H5N1 viruses in China. Sci Rep. 2015;5:18094. [DOI] [PMC free article] [PubMed] [Google Scholar]
- 40. Manzoli L, Gabutti G, Siliquini R, Flacco ME, Villari P, Ricciardi W. Association between vaccination coverage decline and influenza incidence rise among Italian elderly. Euro J Public Health. 2018;28(4):740‐742. [DOI] [PMC free article] [PubMed] [Google Scholar]
Associated Data
This section collects any data citations, data availability statements, or supplementary materials included in this article.
Supplementary Materials