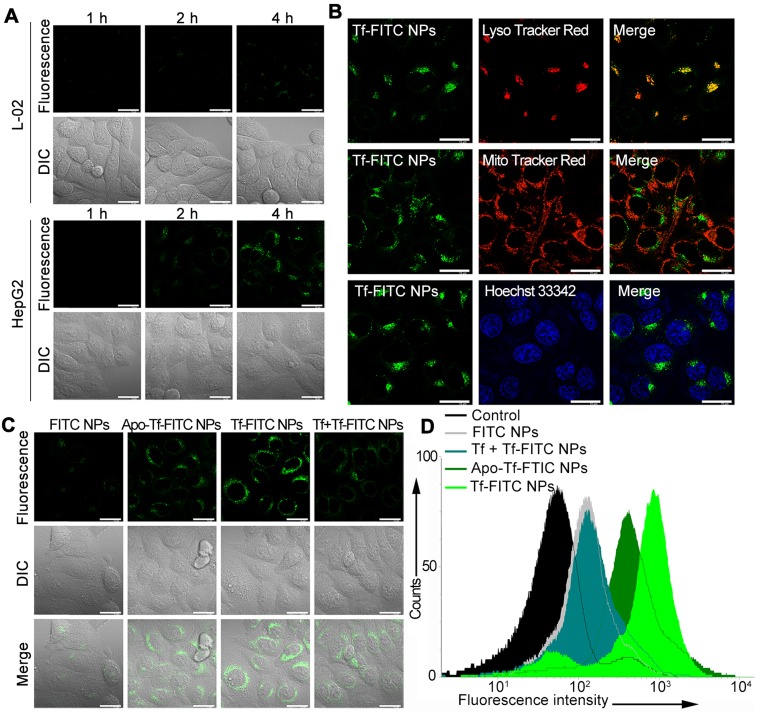
Figure 2.
(A) Confocal fluorescence images of HepG2 and L-02 cells incubated with Tf-FITC NPs for different times. Scale bars: 10 μm. (B) Confocal fluorescence images of HepG2 cells stained with LysoTracker Red, Mito Tracker Red and Hoechst 33342 following incubation with Tf-FITC NPs for 4 h. Scale bars: 10 μm. (C) Confocal fluorescence images of HepG2 cells with different treatments as indicated. Scale bars: 10 μm. (D) Flow cytometric assay for the targeting ability of Tf and iron ions with FITC NPs, Apo-Tf-FITC (preprocessed by deferrization), Tf-FITC NPs, and Tf + Tf-FITC NPs (preincubated with Tf).

