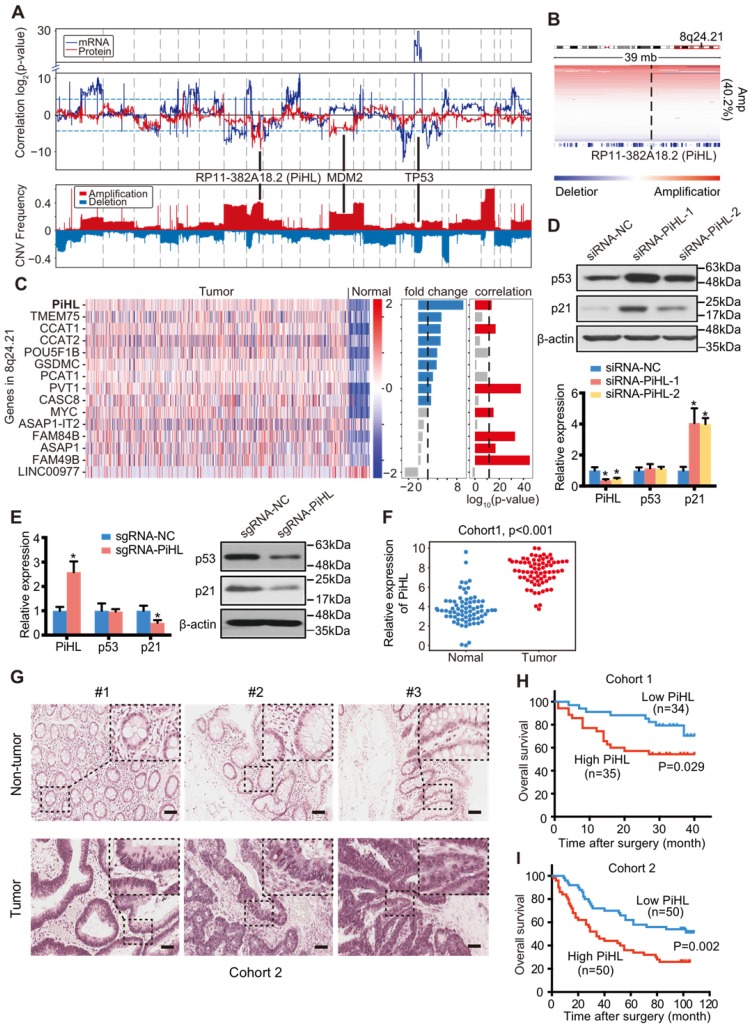
Figure 1.
Identification of p53 protein regulating lncRNAs in CRC. (A) Upper panel: Correlation between genome-wide gene CNV and TP53 mRNA expression (blue line) or p53 protein (red line) level in 169 p53 wild-type samples. Lower panel: CNV frequency of copy number gain and loss in p53 wild-type samples. (B) IGV figures showing the copy number alterations of regions around PiHL in p53 wild-type samples. Amp: amplification. (C) Heatmap showing the gene expression in 466 tumors and 51 normal samples. Fold change of the gene expression of tumor versus normal, correlation of gene expression and its copy number are also plotted on the right of the heatmap. (D) Western blot and qRT-PCR analysis of p53, p21 and PiHL expression. HCT116 cells were transfected with siRNAs for PiHL or siRNA-NC. (E) Western blot and qRT-PCR analysis of p53, p21 and PiHL expression upon single guided RNA (sgRNA) transfection with the SAM system in HCT116 cells. (F) PiHL levels were quantified in 83 pairs of CRC tissues and adjacent normal tissues in cohort 1 using qRT-PCR. β-actin served as the control. Data are shown as mean ± s.e.m.; two-tailed Student's t-test. (G) Representative images of PiHL expression in CRC and adjacent tissues using ISH analysis in cohort 2; n = 100. Scale bar, 100 μm. (H) Kaplan-Meier analyses of the correlation between PiHL RNA levels and overall survival in cohort 1. (I) Kaplan-Meier analyses of the correlation between PiHL RNA levels and overall survival in cohort 2.

