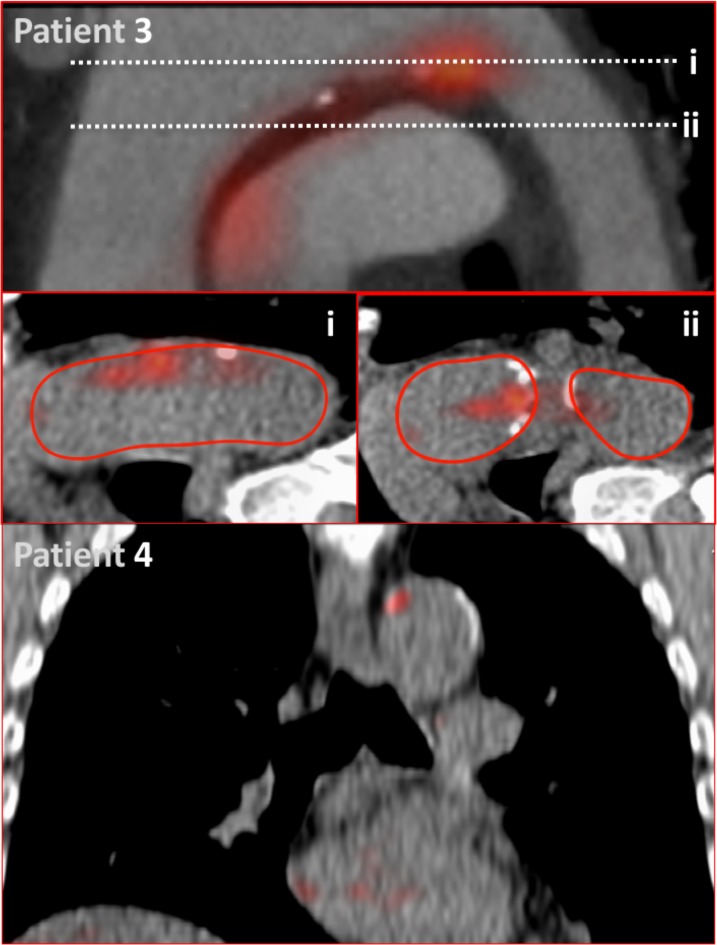
Figure 3.
18F-Fluciclatide aortic uptake. Patient 3: modified coronal view of the aortic arch showing radiotracer uptake at the inner curvature of the aortic arch related to a region of aortic calcification. This activity is demonstrated on axial sections of the aorta (i and ii). Red lines indicate the adventitial borders of the aortic arch used for quantification of PET uptake. Patient 4: sagittal view of the thorax displaying focal 18F-fluciclatide uptake within a region of vascular calcification in the aortic arch.

