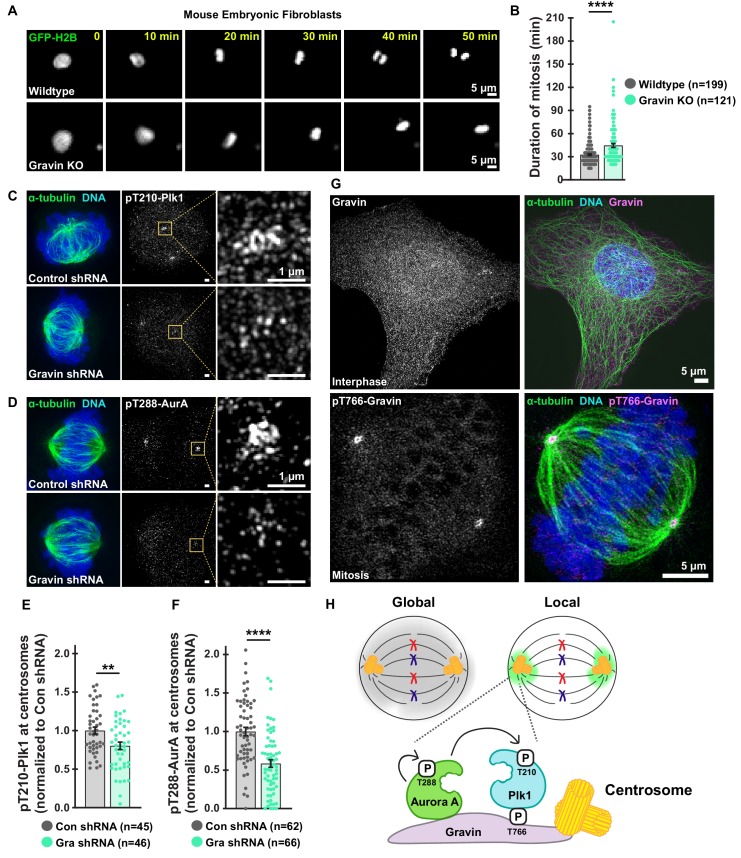
Figure 1. Loss of Gravin perturbs duration of mitosis and accumulation of active mitotic kinases at centrosomes.
(A) Representative time-lapse images of primary MEFs derived from wildtype (top) and Gravin knockout (bottom) cells. Cells transiently expressing GFP-H2B were monitored through mitosis. (B) Quantification of time-lapse experiments depicts duration of mitosis from nuclear envelope breakdown to the onset of anaphase; Wildtype, n = 199, Gravin KO, n = 121, ****p<0.0001. (C, D) Structured illumination microscopy (SIM) of representative mitotic HEK293 cells stably expressing Control or Gravin shRNA. Composite images (left) depict cells stained for α-tubulin (green) and DNA (blue). Immunofluorescence of pT210-Plk1 (C) and pT288-AurA (D) as an index of kinase activity (mid) and 5X magnification of centrosomal pT210-Plk1 (C) and pT288-AurA (D) signals (insets). (E, F) Quantification of centrosomal pT210-Plk1 (E) and pT288-AurA (F) immunofluorescence. Points represent individual cells (n). Data are normalized to Con shRNA; (E) Con shRNA, n = 45, Gra shRNA, n = 46, **p=0.0036; (F) Con shRNA, n = 62, Gra shRNA, n = 66, ****p<0.0001. Experiments were conducted at least three times (N = 3) and P values were calculated by unpaired two-tailed Student’s t-test. Data are mean ± s.e.m. (G) SIM micrographs of Gravin (top, gray and magenta) in interphase and pT766-Gravin (bottom, gray and magenta) in mitotic U2OS cells. Composite images (right) also depict α-tubulin (green) and DNA (blue). (H) Schematic of global drug distribution (gray) vs drug targeting to centrosomes (green). Gravin scaffolds centrosome-localized pools of Plk1 and AurA.


