Abstract
A cost-effective method for serial in vivo imaging of tumor microvasculature has been developed. We evaluated acoustic angiography (AA) for visualizing and assessing non-small cell lung tumor (A549) microvasculature in mice prior to and following tumor vascular disruption by vascular-targeted gold nanoparticles (GNPs) and radiotherapy. Standard B-mode and microbubble-enhanced AA images were acquired at pre- and post-treatment time points. Using these modes, a new metric, 50% Vessel Penetration Depth (VPD50) was developed to characterize the 3D spatial heterogeneity of microvascular networks. We observed an increase in tumor perfusion after radiation-induced vascular disruption, relative to control animals. This was also visualized in vessel morphology mode, which showed a loss in vessel integrity. We found that tumors with poorly perfused vasculature at day 0 exhibited a reduced growth rate over time. This suggested a new method for reducing in-group treatment response variability by using pre-treatment microvessel maps to objectively identify animals for study removal.
Keywords: acoustic angiography, radiation therapy, vascular disruption, microvasculature, gold nanoparticle
Introduction
Tumor microvasculature has been intensively studied for more than four decades (Folkman 1971). The vasculature not only provides the main route by which oxygen and nutrients reach the tumor but also is the pathway used for the dispersion of metastases (Folkman 1971; Folkman 1972). In addition, response of the microvasculature to treatment is observed a few weeks earlier than the shrinkage in tumor volume, thereby providing an early estimation of therapeutic outcome (Brindle 2008; Marcus et al. 2009). Thus, studying the change of tumor microvasculature networks is critical for diagnoses and for evaluating the effects of therapy.
The response of the tumor microvasculature to treatment has been visually assessed using imaging modalities such as MRI (Hoff et al. 2012; O’Connor et al. 2007; Salmon and Siemann 2006; Seshadri and Toth 2009), PET (Kotz et al. 2009), spectral imaging (Wankhede et al. 2010), bioluminescence (BLI) (Alhasan et al. 2012), contrast-enhanced US (Wang et al. 2015), and Power Doppler ultrasound (PD-US) (Alhasan et al. 2012; Gee et al. 2001; Goertz et al. 2002). Hoff et al. used dynamic contrast-enhanced MRI (DCE-MRI) and diffusion-weighted MRI (DW-MRI) for evaluating an inhibitor of Vascular Endothelial Growth Factor (VEGF) (Hoff et al. 2012). However, most of these imaging modalities suffer from a spatial resolution that is too low for delineating the tumor microvasculature (Turkbey et al. 2009). This limitation has constrained prior studies to macroscopic evaluation of the microvessel response, by measuring changes in tumor perfusion (Gee et al. 2001; Goertz et al. 2002; Salmon and Siemann 2006; Seshadri and Toth 2009), optical intensity (Alhasan et al. 2012), and kinetic parameters (Hoff et al. 2012). And although high-resolution microvasculature images have been documented with use of spectral imaging (Wankhede et al. 2010) and PD-US with maximum intensity projection (Alhasan et al. 2012), these techniques have some limitations that are circumvented by the approach used herein: Acoustic Angiography.
Acoustic Angiography (AA) is a relatively new, noninvasive imaging technology that relies on using microbubble contrast agents, has been applied primarily to the study of tumor microvasculature networks of small animals (Dayton et al. 2014; Gessner et al. 2013a). AA utilizes a dual-frequency (transmit-low, receive-high) approach to excite microbubbles near their resonant frequency, thereby generating a superharmonic response allowing delineation of vessels with high spatial resolution and high contrast-to-tissue ratio (Gessner et al. 2012; Gessner et al. 2013b). This is a single-pulse approach to contrast imaging, meaning it does not rely on changes between sequential pulses to derive contrast signal, which makes it insensitive to corruption from motion artefacts (e.g. respiration). This insensitivity to motion is in contrast to power Doppler or image subtraction approaches. Similar to AA, another contrast agent imaging approach “subharmonic imaging” relies on separating tissue from contrast agent signal via the non-linearity in their responses to sound. Instead of receiving at several times the transmit frequency (as in the case of AA), subharmonic imaging receives at 1/2 the transmit frequency, and since microbubbles are most responsive near their resonance, around 1-6 MHz depending on the size and shell composition, sub-harmonic imaging suffers from very poor spatial resolution limiting its utility in preclinical applications. Due to the reliance of AA receiving high frequencies, good spatial resolution is achieved at the expense of poor depth of penetration into tissue, and thus the AA technique is likely limited to imaging preclinical animal models, or superficial clinical targets of a few cm (Shelton et al. 2017). This is not the first study to implement AA to evaluate tumor response to therapy, as previous studies have shown both mouse and rat models responding to anti-angiogenic therapy (Rojas et al. 2018), and broad beam radiation (Kasoji et al. 2018). This study is, however, the first time AA has been used for murine tumor models responding to radiation therapy, as well as in response to nanoparticle based therapies.
Vascular Disrupting Agents (VDAs) are agents that target and destroy tumor blood vessels, shutting down oxygen and nutrient supply to tumors; cells that are in the interior of the tumor and are fed by these vessels eventually starve, causing ischemia or hemorrhagic necrosis (Clémenson et al. 2013; Denekamp et al. 1983; Hori et al. 2002; Siemann 2011; Siemann and Rojiani 2005). Previous in vitro and in vivo studies have demonstrated that gold nanoparticles (GNPs) targeted to the tumor vasculature can be utilized as a VDA, when combined with radiation therapy (RT) (Berbeco et al. 2011; Berbeco et al. 2012; Kunjachan et al. 2015). However, to date, alterations of the tumor microvasculature network that occur after vascular disruptive therapy have not been investigated with the use of AA.
In this study, we used the AA technique to assess the tumor microvasculature in mice prior to and following vascular disruption via targeted GNPs and RT. We have also developed a new metric to characterize and quantify the 3D spatial heterogeneity of tumor microvascular networks. To our knowledge, this is the first study to use AA imaging to investigate mouse tumor models after image-guided RT, and to assess the vascular disruption caused by vascular-targeted GNPs.
Materials and Methods
In vivo studies
All animal studies were approved by Dana-Farber Cancer Institute’s Institutional Animal Care and Use Committee (IACUC) and were in compliance with the Association for the Assessment and Accreditation of Laboratory Animal Care. We used human non-small-cell lung carcinoma cells (A549), grown in vitro in Roswell Park Memorial Institute medium (RPMI-1640; Invitrogen, USA) supplemented with 10% fetal bovine serum (FBS; Invitrogen, USA) and 1% penicillin and streptavidin (Invitrogen, USA). Female athymic nude-FOXn1 mice (Charles River Laboratories, Wilmington, USA) at 4-6 weeks were used and maintained on a standard chow diet. Mice were inoculated subcutaneously in the left dorsolateral flank with 3 × 10⁶ A549 cells (in 100 μl of saline). Nine mice were split into three groups: control (i.e. non-treated), RT alone, and RT with GNPs targeted with cyclic RGD (RGD-GNP). GNPs were delivered by retro-orbital injection to A549 tumor-bearing mice, 24 hrs prior to RT (10 Gy). Image-guided RT was administered using a Small Animal Radiation Research Platform (SARRP; Xstrahl, Inc., Suwanee, GA). Tumor dimensions were measured by caliper every 3-4 days from day 0 (pre-treatment) up to day 62 post-treatment, and volumes were calculated using the formula: volume = (length × width2)/2.
Image acquisition
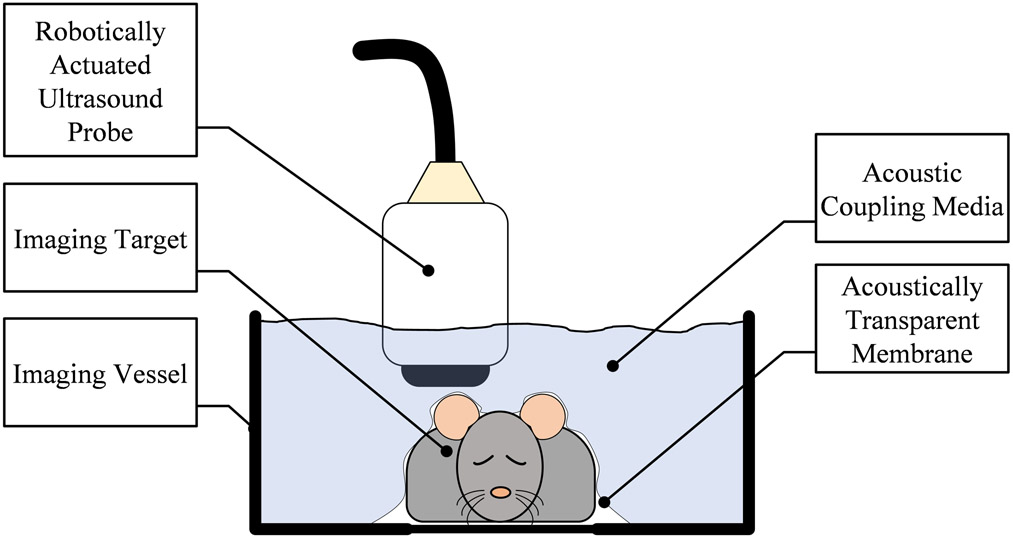
3D B-mode and microbubble-enhanced AA images were acquired, using a prototype robotic ultrasound instrument with an annular dual frequency transducer (SonoVol, Inc., Research Triangle Park, NC) (Czernuszewicz et al. 2018). Figure 1 shows the design of the imaging system. Mice were anesthetized using inhaled isoflurane (2%) and placed in a supine position in an imaging vessel filled with water. The subject was decoupled from the transducer via an acoustically transparent membrane and there was no physical contact between the robotically controlled ultrasound probe and the subject. This robotic device allowed the transducer to be scanned in both lateral and elevational dimensions over the animal, enabling widefield 3D images of the animals to be acquired and merged into a cohesive volume as described in (Czernuszewicz et al. 2018). All 3D data were reconstructed from sequentially acquired 2D frames. For all ultrasound data, the depth of each 2D frame was 36 mm, with time gain compensation (TGC) sliders set flat through depth at 50%. All data was saved at 8 bit resolution with 40 dB dynamic range after envelop detection and log compression. Since the same device controlled both acquisitions of B-mode and AA, both data types were spatially co-registered. B-mode images were acquired at 26 MHz, while AA images were acquired at 2 MHz transmit, 26 MHz receive as previously described (Gessner et al. 2010). Briefly, for AA image acquisition, the transmit pulses were single-cycle pulses with peak negative pressure of 816 kPa at the focus, resulting in a mechanical index (MI) of 0.58. These values were measured in a water bath with a hydrophone, and derated assuming 0.3 dB/cm/MHz attenuation through tissue. The receive lines of data were filtered with a high pass filter at 10 MHz to suppress tissue signal. B-mode tissue data and AA data were acquired as separate acquisitions, and at constant frame rates of 14 Hz and 8 Hz respectively, both reconstructed immediately following acquisition with (60, 60, 200) μm voxel spacing. For all animals, B-mode images were acquired first in order to localize the tumor, and ensure the center of the tumor was at the acoustic focus; this was followed by acquisition of AA images, while mice received constant infusion of microbubbles (Advanced Microbubbles Laboratories, Boulder, CO) via a 28-gauge tail vein catheter at 35 μL/min, and a concentration of 4.5×10⁹ bubbles/mL diluted in sterile saline. Scan time was approximately 5 min per mouse.
Figure 1.
Configuration of the imaging system. The subject was placed on a stationary platform with the imaging vessel positioned over it. An acoustically transparent membrane separated the animal from the coupling fluid, and a small amount of ultrasound gel coupled the tissue to the underside of the membrane. The tissue was imaged in 3D by a robotically actuated ultrasound transducer raster-scanning above the tissue.
The AA has two types of imaging mode: a blood vessel density (BVD) mode and a blood vessel morphology (BVM) mode (Czernuszewicz et al. 2018). In this study, the BVD mode was used to quantify the density of the tumor microvasculature. The BVM mode is the maximum intensity projection of the BVD mode and was used to visualize the vascular distribution within the tumor.
Image analysis
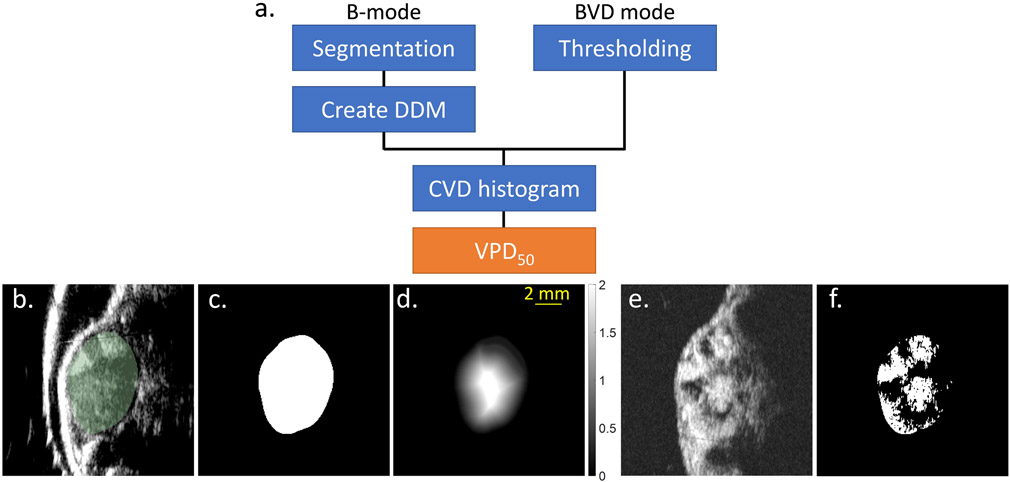
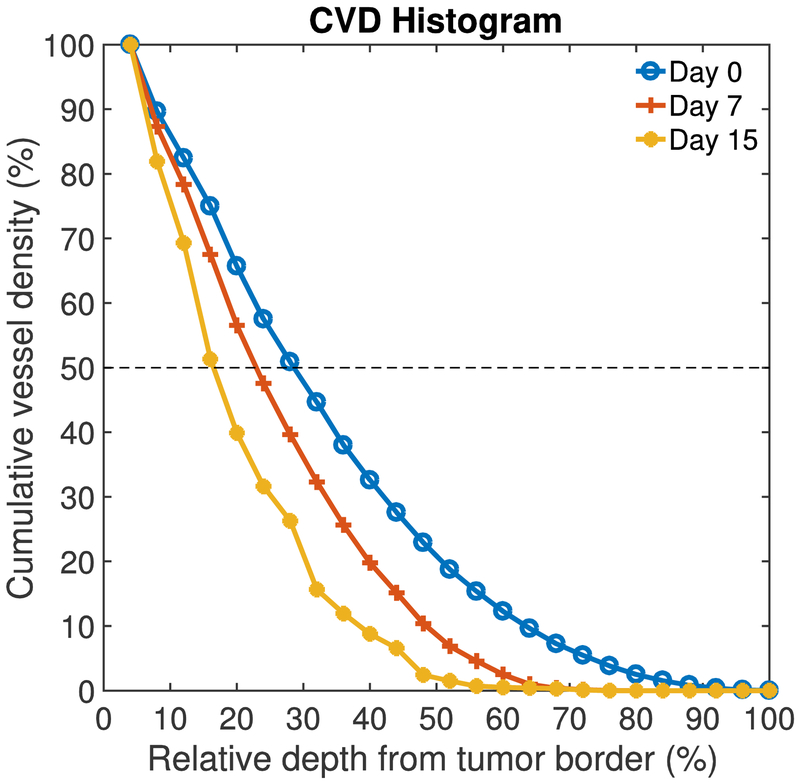
The procedure for image analysis is schematized in Figure 2a. Each tumor was manually segmented from the B-mode tissue image data (Figure 2b, c), making use of the Editor module within 3D Slicer (Fedorov et al. 2012) (version 4.8.0). This resulted in a 3D binary mask region of interest, the border of which was a 3D contour representing the tumor’s boundary. Our objective was to determine what percent of the tumor volume was perfused, as well as the spatial distribution of vasculature throughout the tumor’s interior. To do this, the 3D tumor contour was transferred to the co-registered BVD mode scan data. Using the Danielsson distance filter available in 3D Slicer (Danielsson 1980), each voxel within the 3D binary mask was converted to a measurement of the Euclidean distance from the tumor’s edge (hereafter referred to as Danielsson distance map (DDM), mm units, Figure 2d). Tumor microvasculature in each BVD mode image (Figure 2e) was segmented using MATLAB (Mathworks, Natick, MA) with a thresholding operation, where all voxels >45% of the maximum image intensity were classified as perfused vessels. (Figure 2f). This threshold was subjectively chosen to reflect the presence of the vessel as detected by eye. Using the equally dimensioned arrays of the DDM and the thresholded tumor microvasculature image data, the cumulative vessel density (CVD) histogram could be generated. The CVD is a model that characterizes the relative depths into the tumor at which its microvascular network resides (Figure 3), or in other words, it defines for every radial depth into the tumor what percent of total vascular network exists at depths deeper into the tumor than the current location. In Figure 3, the 0% relative depth corresponds to the tumor border. Using the CVD histogram, we defined a cutoff point at 50% Vessel Penetration Depth (VPD50), as the normalized depth from the tumor surface that corresponds to 50% CVD; an analogous measurement in physics is the −6 dB attenuation distance of light through a scattering medium like water. The 50% cutoff point of CVD was chosen to indicate “volumetric half-life” of microvasculature as a function of the depth from the tumor edge.
Figure 2.
(a) Procedure of image analysis. The 50% Vessel Penetration Depth (VPD50) is the metric developed in this study to quantify the vascular disruption. CVD is the cumulative vessel density. (b) B-mode image. Segmented tumor is shown in green. (c) Tumor segmented on the B-mode. (d) Tumor segment was converted to the Danielsson distance map (DDM). Grayscale bar represents the distance from the tumor edge in mm units. (e) BVD mode image acquired by AA. (f) Tumor segment was thresholded on BVD mode image and tumor microvasculature was segmented. Scale bar indicates 2 mm.
Figure 3.
Representative cumulative vessel density (CVD) histograms for one animal at three time points: day 0, 7, and 15. The 0% and 100% relative depth corresponds to the tumor border and core, respectively. The broken line shows 50% CVD. The VPD50 was extracted from the CVD histogram. In this case, VPD50 is decreasing with time suggesting that the tumor vessels volume in the tumor core decreased and a greater percentage of the vessels is on the periphery of the tumor.
Results
Comparison of tumor volume measurement between B-mode and caliper
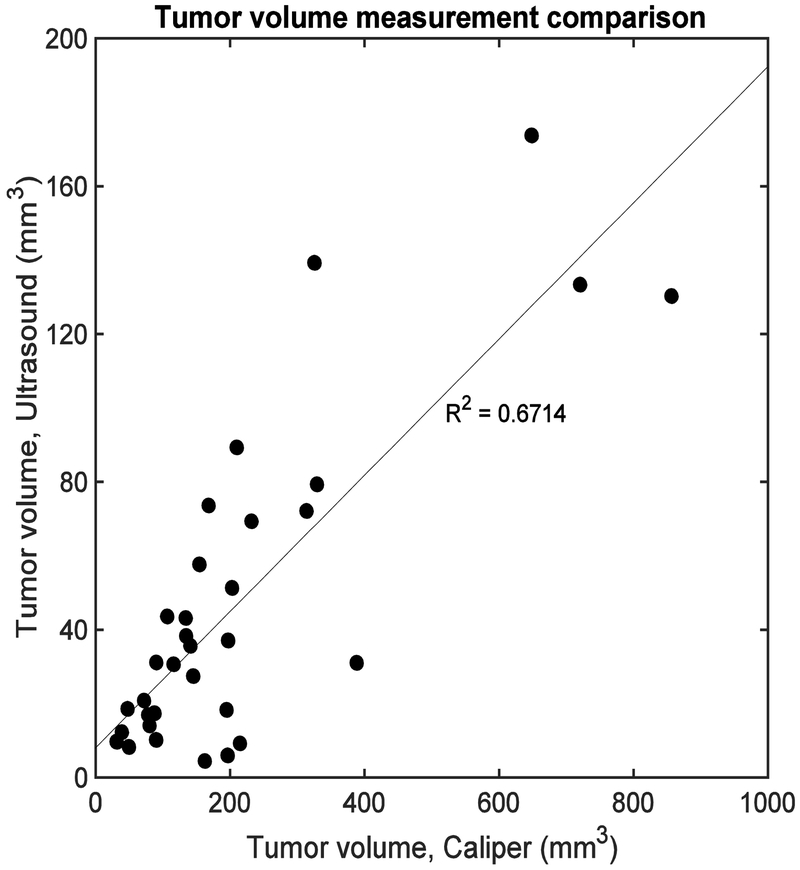
Figure 4 shows normalized tumor volume for all animals and time points, measured by the caliper or ultrasound B-mode imaging. A moderate correlation was observed between two methods (R2 = 0.67). This discrepancy could be attributed to the fact that the caliper measurement does not directly measure the height of the tumor and makes an assumption about this tumor dimension, whereas B-mode does not.
Figure 4.
Correlation between two tumor volume measurement methods: caliper and ultrasound B-mode. Each datapoint represent different timepoints of each animal. Moderate correlation was observed (R2 = 0.67).
Quantification of tumor perfusion
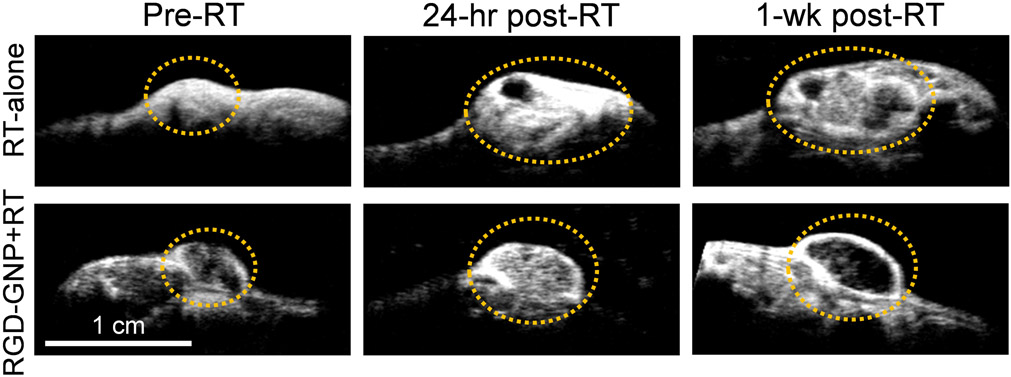
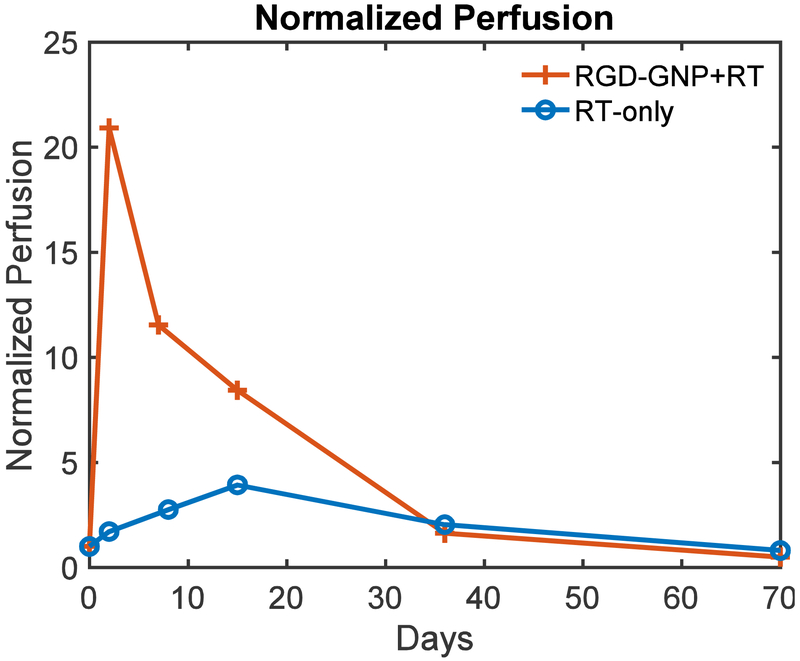
Figures 5a and 5b show the images for a tumor in the control group acquired by B-mode and BVD mode, respectively. The B-mode image was used to segment the tumor region. The BVD mode shows the microbubble perfusion image (Czernuszewicz et al. 2018) and was used to quantify the distribution of the microvasculature. Figure 5c is the blood vessel morphology (BVM) mode or the maximum intensity projection from the area in Figure 5b (Czernuszewicz et al. 2018). This mode can be used for qualitative assessment of microvascular structure and integrity. Figure 6 displays BVD mode images for tumors in the RGD-GNP+RT and RT-only groups, at pre, 24 hrs post, and 1-week post-RT. A large perfusion increase at 24 hrs in the RGD-GNP+RT was reduced at 1-week post-RT. Figure 7 shows the time-dependent variation of tumor perfusion normalized by the pre-treatment perfusion corresponding to the tumors in Figure 6. Quantitative measurement of perfusion matches the qualitative assessment in Figure 6; the increase of perfusion at 24 hrs post-RT was 20.9 and 1.71 for RGD-GNP+RT subject and RT-only subject, respectively. The RGD-GNP+RT subject showed a strong increase in perfusion at 24 hrs post-RT, significantly higher than the RT-only animal. This trend lasted up to day 36.
Figure 5.
Tumor images taken by (a) B-mode and (b) Blood vessel density (BVD) mode. (c) Blood vessel morphology (BVM) mode image shown as 3D render.
Figure 6.
Representative BVD mode images at pre-RT, 24 hours post-RT, and 1-week post-RT for RT-only and RGD-GNP+RT groups. The tumor is circled with an orange dashed line for clarity.
Figure 7.
Time-dependent variation of normalized tumor perfusion for two representative animals from RGD-GNP+RT and RT-only groups.
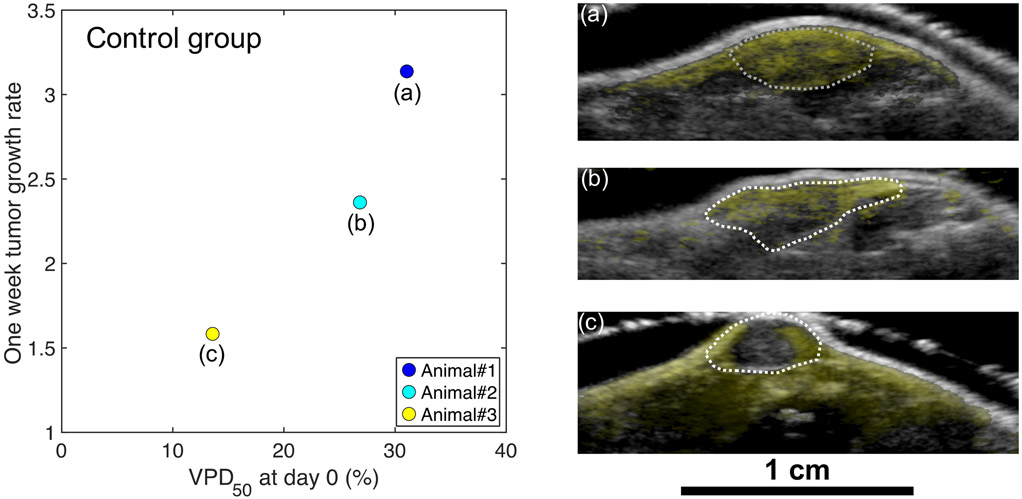
Figure 8 displays the 1-week tumor growth rate and VPD50 at day 0 for the control (saline) group. The 1-week tumor growth rate is defined as the tumor volume at 1-week divided by the pre-treatment tumor volume of the same animal. The 1-week tumor growth rate in this group increased with VPD50 at day 0. Figure 8a, b, and c show overlays of day 0 B-mode and BVD mode images of the corresponding animals. Animal#3 (Figure 8c), which demonstrated irregularly small tumor growth among the control group, showed poor perfusion inside the tumor compared to Animals#1 and #2 (Figure 8a and 8b, respectively). The poorer vascularity or necrotic core of Animal#3 is likely to have led to the relatively small VPD50 compared to the other animals in the group.
Figure 8.
Distribution of 1-week tumor growth rate as a function of the VPD50 at day 0 for three animals in the control group. (a), (b) and (c) Overlay of day 0 B-mode (grayscale) and BVD mode (yellow) images of the corresponding animals, which showed high perfusion (a), moderate perfusion (b), and low perfusion (c) inside the tumor. The dotted white line is the segmented tumor region.
Discussion
We have used the AA technique to evaluate changes in the 3D microvascular network in a mouse model of pre- and post-vascular disruptive therapy, using RGD-GNP and RT. We show that the AA technique can be useful for non-invasive, high-resolution measurements of changes in the 3D microvasculature of tumors.
Several groups have previously reported the reduction of tumor perfusion after the treatment by using VDAs (Hoff et al. 2012; Salmon and Siemann 2006). On the other hand, we have observed an initial increase of microbubble perfusion for RGD-GNP+RT in the 24 hours post-therapy, followed by a large decrease in the week following (Figure 7). This suggests that the combination of the RGD-GNP and RT modulates the tumor microvasculature to enable the enhanced delivery of microbubbles, which increases the signal intensity of the BVD mode image. The result is consistent with the earlier literature (Kunjachan et al. 2015) that combined vascular-targeted GNPs with image-guided RT and reported the enhanced leakage of GNPs into the tumor.
The spatial distribution of the microvasculature seen with AA imaging can be described by several previously introduced metrics such as tortuosity (Gessner et al. 2012) and Volumetric Vascular Density (Kasoji et al. 2018). To evaluate the 3D distribution of vasculature throughout the tumor volume, Spatial vascularity Pattern (SVP) was demonstrated very recently (Caresio et al. 2018). The SVP describes the 3D distribution of vasculature in the tumor by only two numbers, 0 or 1. For the same purpose, here we have introduced the CVD histogram by utilizing the DDM and characterized the distance from the tumor border. As opposed to the SVP, the index we derived from the CVD histogram, VPD50, calculates the distance which corresponds to the “volumetric half-life” of microvasculature as a function of the depth from the tumor border. Therefore, the VPD50 enables us to evaluate the change of the 3D distribution of tumor microvasculature effectively (Figure 3). The relationship between the VPD50 at day 0 and the 1-week tumor growth rate (Figure 8) indicates that pre-treatment tumor perfusion is a principal determinant of the early tumor growth. These results also suggest that the AA technique could be useful for preemptively identifying animals that are going to be an outlier in the cohort. It is known that the individual tumor size and conditions can vary in a group. The use of AA system to preemptively identify animals that should be excluded from the cohort would help to reduce the variability of treatment response.
In our study, we used the DDM to calculate the CVD histogram. A limitation of this method is that we are assuming that the reduction of the tumor vessel volume originates from the center of the tumor. Previous studies showed that the vascular density in the tumor core significantly decreases after the RT (Fokas et al. 2010; Ng et al. 2007). However, the change of vascular density in the tumor core in use of vascular-targeted GNPs and RT is not fully addressed and will be the subject of a future study with larger cohort.
Conclusions
We have shown the value of acoustic angiography (AA) imaging for qualitative and quantitative assessment of 3D tumor microvasculature after vascular modulating therapy. A new method for evaluating tumor perfusion, the CVD histogram, is defined and demonstrated. We have also introduced a new method for reducing the variability of in-group treatment response, by using pre-treatment microvessel maps to objectively identify animals for study removal.
Acknowledgements
The project described was supported, in part, by Award Number R21CA188833 from the National Cancer Institute. The content is solely the responsibility of the authors and does not necessarily represent the official views of the National Cancer Institute or the National Institutes of Health. Author J. Kwon acknowledges support from a Research Fellowship of the Japanese Society for the Promotion of Science (JSPS), and the JSPS Overseas Challenge Program for Young Researchers. This work was supported by JSPS KAKENHI Grant Number JP17J03616.
Footnotes
Disclosure of Conflicts of Interest
Authors Rajamahendiran, Harlacher, Czernuszewicz, and Gessner are employees of SonoVol, Inc., a company which is commercializing ultrasound robotic imaging systems for small animal imaging.
Publisher's Disclaimer: This is a PDF file of an unedited manuscript that has been accepted for publication. As a service to our customers we are providing this early version of the manuscript. The manuscript will undergo copyediting, typesetting, and review of the resulting proof before it is published in its final form. Please note that during the production process errors may be discovered which could affect the content, and all legal disclaimers that apply to the journal pertain.
References
- Alhasan MK, Liu L, Lewis MA, Magnusson J, Mason RP. Comparison of Optical and Power Doppler Ultrasound Imaging for Non-Invasive Evaluation of Arsenic Trioxide as a Vascular Disrupting Agent in Tumors. PLoS One 2012;7. [DOI] [PMC free article] [PubMed] [Google Scholar]
- Berbeco RI, Korideck H, Ngwa W, Kumar R, Patel J, Sridhar S, Johnson S, Price BD, Kimmelman A, Makrigiorgos GM. DNA Damage Enhancement from Gold Nanoparticles for Clinical MV Photon Beams. Radiat Res 2012;178:604–608. [DOI] [PMC free article] [PubMed] [Google Scholar]
- Berbeco RI, Ngwa W, Makrigiorgos GM. Localized dose enhancement to tumor blood vessel endothelial cells via megavoltage X-rays and targeted gold nanoparticles: New potential for external beam radiotherapy. Int J Radiat Oncol Biol Phys 2011;81:270–276. [DOI] [PubMed] [Google Scholar]
- Brindle K New approaches for imaging tumour responses to treatment. Nat Rev Cancer 2008;8:94–107. [DOI] [PubMed] [Google Scholar]
- Caresio C, Caballo M, Deandrea M, Garberoglio R, Mormile A, Rossetto R, Limone P, Molinari F. Quantitative analysis of thyroid tumors vascularity: A comparison between 3-D contrast-enhanced ultrasound and 3-D Power Doppler on benign and malignant thyroid nodules. Med Phys 2018;45:3173–3184. [DOI] [PubMed] [Google Scholar]
- Clémenson C, Chargari C, Deutsch E. Combination of vascular disrupting agents and ionizing radiation Crit Rev Oncol Hematol Elsevier Ireland Ltd, 2013;86:143–160. [DOI] [PubMed] [Google Scholar]
- Czernuszewicz TJ, Papadopoulou V, Rojas JD, Rajamehendiran RM, Perdomo J, Harlacher M, O’Connell G, Zukic D, Aylward SR, Dayton PA, Gessner RC. A New Preclinical Ultrasound Platform for Widefield 3D Imaging of Rodents. Rev Sci Instrum 2018;89:075107. [DOI] [PMC free article] [PubMed] [Google Scholar]
- Danielsson PE. Euclidean distance mapping. Comput Graph Image Process 1980;14:227–248. [Google Scholar]
- Dayton PA, Gessner RC, Phillips L, Shelton SE, Heath Martin K, Lee M, Foster FS. The implementation of acoustic angiography for microvascular and angiogenesis imaging. Conf Proc IEEE Eng Med Biol Soc 2014;4283–4285. [DOI] [PubMed] [Google Scholar]
- Denekamp J, Hill A, Hobson B. Vascular Occlusion and Tumour Cell Death. Eur J Cancer Clin Oncol 1983;19:271–275. [DOI] [PubMed] [Google Scholar]
- Fedorov A, Beichel R, Kalphaty-Cramer J, Finet J, Fillion-Robbin J-C, Pujol S, Bauer C, Jennings D, Fennessy F, Sonka M, Buatti J, Aylward S, Miller JV, Pieper S, Kikinis R. 3D slicers as an image computing platform for the quantitative imaging network. Magn Reson Imaging 2012;30:1323–1341. [DOI] [PMC free article] [PubMed] [Google Scholar]
- Fokas E, Hanze J, Kamlah F, Eul BG, Lang N, Keil B, Heverhagen JT, Engenhart-Cabillic R, An H, Rose F. Irradiation-dependent effects on tumor perfusion and endogenous and exogenous hypoxia markers in an A549 xenograft model. Int J Radiat Oncol Biol Phys 2010;77:1500–1508. [DOI] [PubMed] [Google Scholar]
- Folkman J Tumor angiogenesis: therapeutic implications. N Engl J Med 1971;285:1182–6. [DOI] [PubMed] [Google Scholar]
- Folkman J Anti-angiogenesis: new concept for therapy of solid tumors. Ann Surg 1972;175:409–416. [DOI] [PMC free article] [PubMed] [Google Scholar]
- Gee MS, Saunders HM, Lee JC, Sanzo JF, Jenkins WT, Evans SM, Trinchieri G, Sehgal CM, Feldman MD, Lee WMF. Doppler Ultrasound Imaging Detects Changes in Tumor Perfusion during Antivascular Therapy Associated with Vascular Anatomic Alterations. Cancer Res 2001;61:2974–2982. [PubMed] [Google Scholar]
- Gessner R, Lukacs M, Lee M, Cherin E, Stuart F F, Dayton AP. High-Resolution, High-Contrast Ultrasound Imaging Using a Prototype Dual-Frequency Transducer: In Vitro and In Vivo Studies. IEEE Trans Ultrason Ferroelectr Freq Control 2010;57:1772–1781. [DOI] [PMC free article] [PubMed] [Google Scholar]
- Gessner RC, Aylward SR, Dayton PA. Mapping Microvasculature with Acoustic Angiography Yields Quantifiable Differences between Healthy and Tumor-bearing Tissue Volumes in a Rodent Model. Radiology 2012;264:733–740. [DOI] [PMC free article] [PubMed] [Google Scholar]
- Gessner RC, Frederick CB, Foster FS, Dayton PA. Acoustic angiography: A new imaging modality for assessing microvasculature architecture. Int J Biomed Imaging 2013a;2013. [DOI] [PMC free article] [PubMed] [Google Scholar]
- Gessner RC, Hanson AD, Feingold S, Cashion AT, Corcimaru A, Wu BT, Mullins CR, Aylward SR, Reid LM, Dayton PA. Functional ultrasound imaging for assessment of extracellular matrix scaffolds used for liver organoid formation Biomaterials Elsevier Ltd, 2013b;34:9341–9351. [DOI] [PMC free article] [PubMed] [Google Scholar]
- Goertz DE, Yu JL, Kerbel RS, Burns PN, Foster FS. High-Frequency Doppler Ultrasound Monitors the Effects of Antivascular Therapy on Tumor Blood Flow Advances in Brief High-Frequency Doppler Ultrasound Monitors the Effects of Antivascular Therapy on Tumor Blood Flow. Cancer Res 2002;62:6371–6375. [PubMed] [Google Scholar]
- Hoff BA, Bhojani MS, Rudge J, Chenevert TL, Meyer CR, Galbán S, Johnson TD, Sebolt J, Rehemtulla A, Ross BD, Galbán CJ. DCE and DW-MRI monitoring of vascular disruption following VEGF-Trap treatment of a rat glioma model. NMR Biomed 2012;25:935–942. [DOI] [PMC free article] [PubMed] [Google Scholar]
- Hori K, Saito S, Kubota K. A novel combretastatin A-4 derivative, AC7700, strongly stanches tumour blood flow and inhibits growth of tumours developing in various tissues and organs. Br J Cancer 2002;86:1604–1614. [DOI] [PMC free article] [PubMed] [Google Scholar]
- Kasoji SK, Rivera JN, Gessner RC, Chang SX, Dayton PA. Early assessment of tumor response to radiation therapy using high-resolution quantitative microvascular ultrasound imaging. Theranostics 2018;8:156–168. [DOI] [PMC free article] [PubMed] [Google Scholar]
- Kotz B, West C, Saleem A, Jones T, Price P. Blood flow and Vd (water): both biomarkers required for interpreting the effects of vascular targeting agents on tumor and normal tissue. Mol Cancer Ther 2009;8:303–309. [DOI] [PubMed] [Google Scholar]
- Kunjachan S, Detappe A, Kumar R, Ireland T, Cameron L, Biancur DE, Motto-Ros V, Sancey L, Sridhar S, Makrigiorgos GM, Berbeco RI. Nanoparticle Mediated Tumor Vascular Disruption: A Novel Strategy in Radiation Therapy. Nano Lett 2015;15:7488–7496. [DOI] [PMC free article] [PubMed] [Google Scholar] [Retracted]
- Marcus CD, Ladam-Marcus V, Cucu C, Bouché O, Lucas L, Hoeffel C. Imaging techniques to evaluate the response to treatment in oncology: Current standards and perspectives. Crit Rev Oncol Hematol 2009;72:217–238. [DOI] [PubMed] [Google Scholar]
- Ng QS, Goh V, Carnell D, Meer K, Padhani AR, Saunders MI, Hoskin PJ. Tumor Antivascular Effects of Radiotherapy Combined with Combretastatin A4 Phosphate in Human Non-Small-Cell Lung Cancer. Int J Radiat Oncol Biol Phys 2007;67:1375–1380. [DOI] [PubMed] [Google Scholar]
- O’Connor JPB, Jackson A, Parker GJM, Jayson GC. DCE-MRI biomarkers in the clinical evaluation of anti angiogenic and vascular disrupting agents. Br J Cancer 2007;96:189–195. [DOI] [PMC free article] [PubMed] [Google Scholar]
- Rojas JD, Papadopoulou V, Czernuszewicz T, Rajamahendiran R, Chytil A, Chiang YC, Chong D, Bautch V, Rathmell K, Aylward S, Gessner R, Dayton PA. Ultrasound Measurement of Vascular Density to Evaluate Response to Anti-angiogenic Therapy in Renal Cell Carcinoma. IEEE Trans Biomed Eng IEEE, 2018;66:873–880. [DOI] [PMC free article] [PubMed] [Google Scholar]
- Salmon HW, Siemann DW. Effect of the second-generation vascular disrupting agent OXI4503 on tumor vascularity. Clin Cancer Res 2006;12:4090–4094. [DOI] [PubMed] [Google Scholar]
- Seshadri M, Toth K. Acute Vascular Disruption by 5,6-Dimethylxanthenone-4-Acetic Acid in an Orthotopic Model of Human Head and Neck Cancer Transl Oncol Neoplasia Press, Inc., 2009;2:121–127. [DOI] [PMC free article] [PubMed] [Google Scholar]
- Shelton SE, Lindsey BD, Dayton PA, Lee YZ. First-in-Human Study of Acoustic Angiography in the Breast and Peripheral Vasculature Ultrasound Med Biol Elsevier Inc., 2017;43:2939–2946. [DOI] [PMC free article] [PubMed] [Google Scholar]
- Siemann DW. The unique characteristics of tumor vasculature and preclinical evidence for its selective disruption by Tumor-Vascular Disrupting Agents Cancer Treat Rev Elsevier Ltd, 2011;37:63–74. [DOI] [PMC free article] [PubMed] [Google Scholar]
- Siemann DW, Rojiani AM. The vascular disrupting agent ZD6126 shows increased antitumor efficacy and enhanced radiation response in large, advanced tumors. Int J Radiat Oncol Biol Phys 2005;62:846–853. [DOI] [PubMed] [Google Scholar]
- Turkbey B, Kobayashi H, Ogawa M, Bernardo M, Choyke PL. Imaging of tumor angiogenesis: Functional or targeted? Am J Roentgenol 2009;193:304–313. [DOI] [PMC free article] [PubMed] [Google Scholar]
- Wang H, Hristov D, Qin J, Tian L, Willmann Jürgen K. Three-dimensional Dynamic Contrast-enhanced US Imaging for Early Antiangiogenic. Radiology 2015;277:424–434. [DOI] [PMC free article] [PubMed] [Google Scholar]
- Wankhede M, Dedeugd C, Siemann DW, Sorg BS. In vivo functional differences in microvascular response of 4T1 and Caki-1 tumors after treatment with OXi4503. Oncol Rep 2010;23:685–692. [DOI] [PMC free article] [PubMed] [Google Scholar]


