Abstract
Metastasis requires cancer cells to undergo poorly-understood metabolic changes1–3. We found that metabolic differences among melanoma cells confer differences in metastatic potential as a result of differences in Monocarboxylate Transporter 1 (MCT1) function. In vivo isotope tracing in patient-derived xenografts revealed differences in nutrient handling between efficiently and inefficiently metastasizing melanomas, with circulating lactate being a more prominent source of tumor lactate in efficient metastasizers. Efficient metastasizers had higher MCT1 levels and MCT1 inhibition reduced lactate uptake. MCT1 inhibition had little effect on primary subcutaneous tumor growth but depleted circulating melanoma cells and reduced metastatic disease burden in patient-derived xenografts and in mouse melanomas. MCT1 inhibition suppressed the oxidative pentose phosphate pathway and increased ROS levels. Anti-oxidants blocked the effect of MCT1 inhibition on metastasis. MCT1high and MCT1−/low cells from the same melanomas had similar capacities to form subcutaneous tumors, but MCT1high cells formed more metastases after intravenous injection. Metabolic differences among cancer cells thus confer differences in metastatic potential as metastasizing cells depend upon MCT1 to manage oxidative stress.
One sentence summary:
Differences in MCT1 function among melanoma cells confer differences in oxidative stress resistance and metastatic potential
Metastasis is a very inefficient process in which few disseminated cancer cells survive1. One factor that limits metastasis in some cancers, including melanoma, is oxidative stress2–6. Melanoma cells experience increased oxidative stress during metastasis, and must undergo metabolic changes to survive, including increased dependence upon the folate pathway3, a major source of NADPH for oxidative stress resistance7,8. Cells use NADPH to regenerate glutathione, a buffer against oxidative stress. Glutathione and other anti-oxidants promote cancer initiation and progression3,9–12. This suggests pro-oxidant therapies would inhibit the progression of some cancers, though they may promote the initiation or progression of others13.
Lactate synthesis and export from highly glycolytic cells is necessary to remove excess acid and to sustain glycolysis14. Lactate was, thus, considered a waste product that must be eliminated by cancer cells despite the fact that some cancer cells take up and metabolize lactate in culture15,16. Lung cancers17 and pancreatic cancers18 use Monocarboxylate Transporter 1 (MCT1) to transport lactate from the circulation into the tumor, with some of the carbon from lactate supplying the tricarboxylic acid (TCA) cycle. Enhanced lactate transport correlates with worse outcomes17, raising the question of whether lactate consumption is a biomarker of more aggressive cancers or whether it promotes cancer progression.
Lactate is transported across the cytoplasmic membrane mainly by MCT1 and MCT419. These transporters enable bidirectional, passive transport of lactate and related monocarboxylates, including pyruvate15,16,19,20. Although MCT1 transports multiple carboxylates, its main physiological function in vivo is lactate import as lactate is at least 10-fold more abundant than other carboxylates in the fed state19. Nonetheless, the directionality of transport by MCTs depends on lactate and proton concentration gradients. MCT1 inhibition can induce cell death by inhibiting glycolysis as a result of the failure to export lactate in culture21, and can suppress xenograft growth in mice15 and cancer cell migration in culture22,23. However, most studies of MCT function were performed in culture, where cells tend to be more highly glycolytic than in vivo17, raising the question of whether MCTs regulate cancer progression in vivo.
Efficient metastasizers take up more lactate
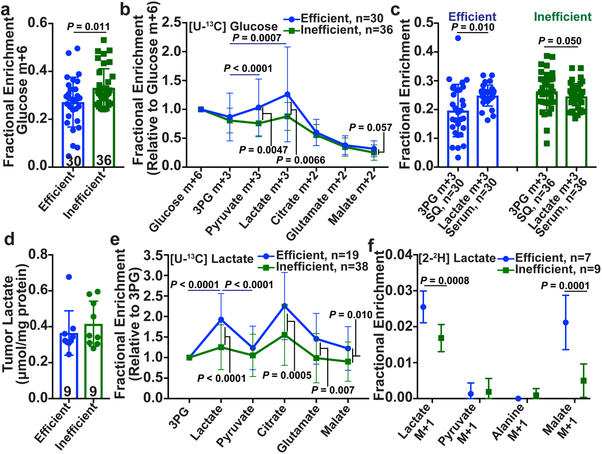
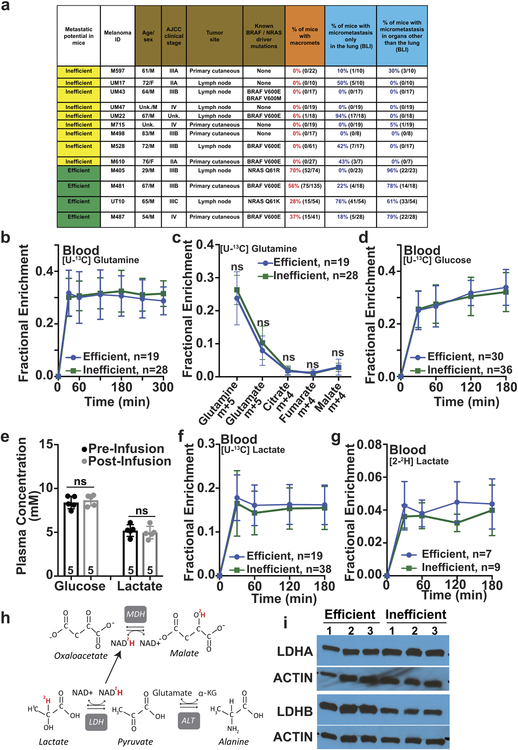
Efficient metastasizers give rise to circulating cancer cells and distant macrometastases in patients and after xenografting in NOD/SCID IL2Rγnull (NSG) mice while inefficient metastasizers do not give rise to detectable cancer cells in the blood and metastasize more slowly in mice and in patients24 (Extended Data Fig. 1a). We subcutaneously injected efficiently (from patients M405, M481, M487 and UT10) and inefficiently (from patients M715, UM17, UM22, UM43, UM47, M498, M528, M597, and M610) metastasizing melanomas into NSG mice. We used established techniques17 to infuse 13C-labeled nutrients into these mice when the tumors reached approximately 2 cm in diameter, then examined labeling in metabolites extracted from the blood and tumors. [U-13C]glutamine infusion enriched the circulating glutamine pool and produced no differences in labeling between efficient and inefficient metastasizers (Extended Data Fig. 1b, c). [U-13C]glucose infusion modestly but significantly elevated glucose enrichments in inefficient compared to efficient metastasizers (Fig. 1a), despite no differences in circulating glucose (Extended Data Fig. 1d, e). For this reason, we normalized glucose-derived metabolites in the tumor to glucose m+6. After this normalization, 3-phosphoglycerate (3PG) labeling was similar between the tumor types, but efficiently-metastasizing tumors had elevated lactate labeling relative to 3PG (Fig. 1b). In efficient, but not inefficient metastasizers, the absolute enrichment in circulating lactate also exceeded the enrichment in tumor 3PG (Fig. 1c). These labeling features in efficient metastasizers are similar to some human lung cancers, where excess lactate labeling relative to 3PG was explained by uptake of lactate derived from infused glucose17.
Figure 1. Efficiently metastasizing melanomas exhibit enhanced lactate uptake in vivo.
Isotope tracing in primary subcutaneous tumors xenografted in NSG mice with efficiently (M405, M481, M487, and UT10) and inefficiently (M715, UM17, UM22, UM43, UM47, M498, M528, M597 and M610) metastasizing melanomas. The number of mice/tumors per treatment is indicated in each panel. a-b, Glucose m+6 as a fraction of the glucose pool (a) and enrichment of other metabolites normalized to m+6 glucose (b) in subcutaneous tumors after [U-13C]glucose infusion. c, 3-phosphoglycerate (3PG) m+3 fraction in subcutaneous tumors and lactate m+3 fraction in the plasma of mice infused with [U-13C]glucose (20 experiments). d, Tumor lactate concentration (3 experiments). e, Enrichment of metabolites normalized to 3PG m+3 in subcutaneous tumors after [U-13C]lactate infusion (23 experiments). f Isotope labelling after [2-2H]lactate infusion (3 experiments). Data represent mean ± s.d. Statistical significance was assessed using t-tests (a and f), paired t-tests (c), log2 t-tests to compare efficient versus inefficient melanomas or Wilcoxon tests to compare metabolites (b and e). Multiple comparisons were adjusted using the Holm-Sidak’s method (b, c, e, and f).
We next infused [U-13C]lactate using conditions that produced steady-state labeling and abundance in the blood (Extended Data Fig. 1e, f) and no differences in tumor lactate abundance between efficient and inefficient metastasizers (Fig. 1d). To account for labeling resulting from transfer of 13C from lactate to glucose through gluconeogenesis, followed by glucose uptake and glycolysis in the tumor, we normalized metabolite labeling to 3PG, which presumably arises from glycolysis. Lactate enrichment was higher in efficient than inefficient metastasizers, and exceeded enrichment in 3PG or pyruvate (Fig. 1e). These data suggest that efficient metastasizers are better than inefficient metastasizers at taking up circulating lactate. Efficient metastasizers also had higher enrichments in metabolites related to the TCA cycle (citrate, glutamate and malate; Fig. 1e), suggesting that 13C from lactate was transferred to the TCA cycle. Both efficiently and inefficiently metastasizing melanomas expressed lactate dehydrogenase (LDH) A and B, indicating their capacity to metabolize lactate (Extended Data Fig. 1i).
To verify lactate uptake directly, we infused [2-2H]lactate. Exchanges between lactate and pyruvate transfer 2H to NAD+, resulting in unlabeled lactate (Extended Data Fig. 1h); thus the appearance of label in the tumors indicates uptake of lactate, not pyruvate17. As expected, we observed label in tumor lactate but not pyruvate or alanine (Fig. 1f). Lactate labeling was higher in efficient than inefficient metastasizers (Fig. 1f), despite similar labeling in the blood (Extended Data Fig. 1g). Efficient metastasizers also contained labeled malate (Fig. 1f), which could arise from transfer of 2H from NAD2H to malate (Extended Data Fig. 1h)17,25.
Higher MCT1 in efficient metastasizers
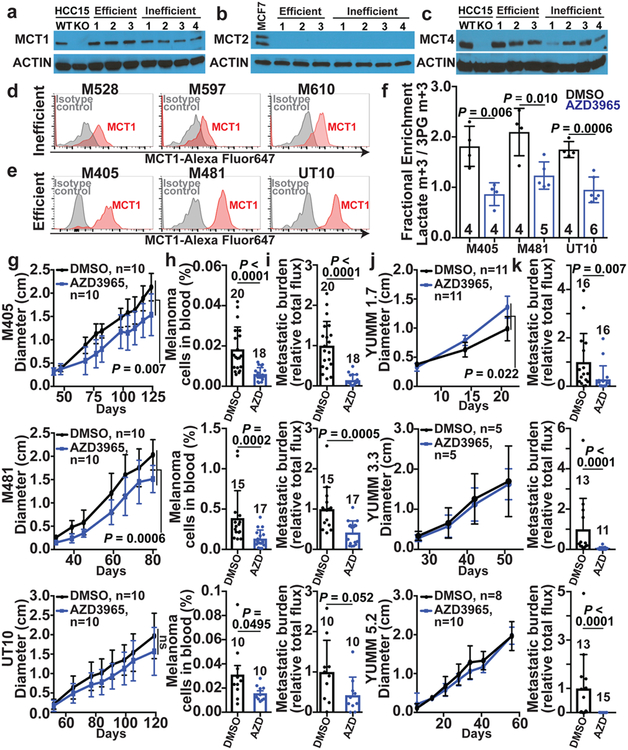
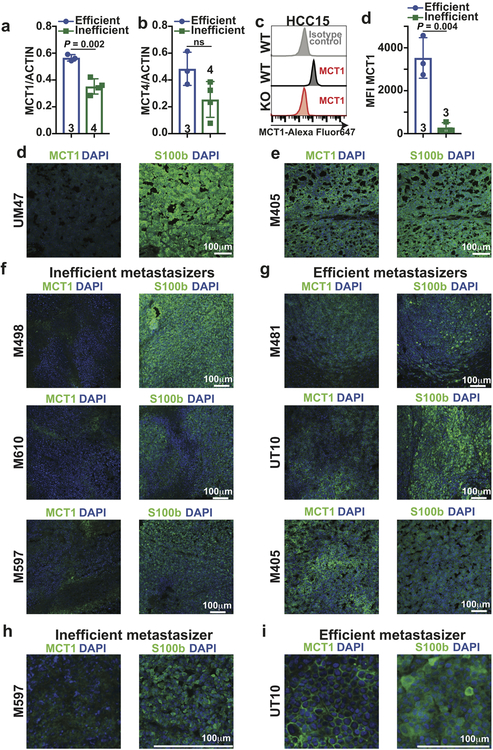
We observed consistently higher levels of MCT1 in efficient as compared to inefficient metastasizers by western blot (Fig. 2a; see Extended Data Fig. 2a for quantitation). We confirmed this difference using two other anti-MCT1 antibodies by immunofluorescence analysis (Extended Data Fig. 2e–j) and flow cytometry (Fig. 2d–e, Extended Data Fig. 2c; see Extended Data Fig. 2d for quantitation). The difference in surface MCT1 staining between efficient and inefficient metastasizers by flow cytometry was particularly dramatic. Immunofluorescence analysis suggested that MCT1 staining tended to be more cell surface associated in efficient metastasizers (Extended Data Fig. 2j) and more diffusely cytoplasmic in inefficient metastasizers (Extended Data Fig. 2i).
Figure 2. MCT1 inhibition selectively impairs metastasis in human and mouse melanomas.
a-c, Western blot analysis of MCT1 (a), MCT2 (b), and MCT4 (c) in 3 efficiently (M405, M481, and UT10) and 4 inefficiently (M498, M528, M597 and M610) metastasizing xenografted melanomas. Positive and negative controls for MCT1 and MCT4 were HCC15 cells and MCT1 or MCT4 deficient HCC15 cells. MCF7 cells were a positive control for MCT2. The data are representative of 4 (MCT1), 2 (MCT2), and 2 (MCT4) experiments. d-e, Flow cytometric analysis of MCT1 surface expression in inefficiently (d) and efficiently (e) metastasizing melanomas. f, Enrichment of lactate m+3 normalized to 3PG m+3 in xenografted tumors after treatment with the MCT1 inhibitor, AZD3965, or DMSO control and [U-13C]lactate infusion (2 experiments per melanoma). The number of mice per treatment is indicated in each panel. g-i, Growth of subcutaneous tumors (g) in mice treated with AZD3965 (AZD) or DMSO control as well as the frequency of circulating melanoma cells in the blood (h) and metastatic disease burden based on bioluminescence imaging (i). Data in h and i reflect 1 (UT10) or 2 experiments per melanoma, but only one representative experiment per melanoma is shown in g. j-k, Growth of subcutaneous tumors (j) and metastatic disease burden at endpoint by bioluminescence imaging (k) in mice transplanted with YUMM1.7, YUMM3.3, or YUMM5.2 mouse melanomas and treated with AZD3965 (AZD) or DMSO control (two experiments per melanoma). Data represent mean ± s.d. Statistical significance was assessed using t-tests (f), nparLD (g), mixed effects analysis (j) or Mann-Whitney tests (h-i and k).
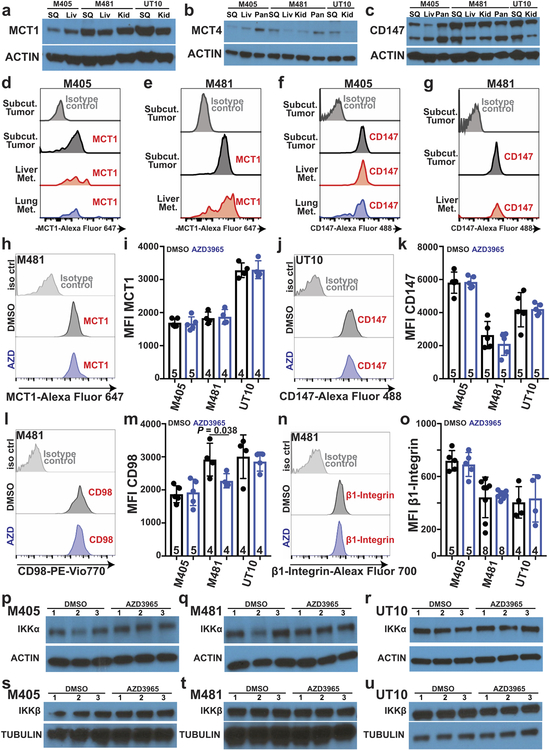
MCT1 and CD147 (a co-chaperone of MCT126) expression did not differ between primary and metastatic tumors (Extended Data Fig. 3a–g), consistent with a prior study27. We did not detect MCT2 in any of the melanomas we studied (Fig. 2b). MCT4 was expressed (Fig. 2c; see Extended Data Fig. 2b for quantitation) but did not consistently differ between primary and metastatic tumors (Extended Data Fig. 3b).
MCT1 is required during metastasis
To test whether MCT1 mediates lactate uptake by melanoma cells, we transplanted efficiently metastasizing melanomas from three patients subcutaneously in NSG mice then treated half of the mice for 7 days with AZD3965 (30 mg/kg/day), a selective MCT1 inhibitor that does not have activity against MCT428. We infused [U-13C]lactate and measured the fractional enrichment in lactate relative to 3PG in the tumors. In all three melanomas, AZD3965 treatment significantly reduced lactate labeling, to the point that lactate and 3PG were equivalently labeled, consistent with the labelled lactate arising from glycolysis rather than lactate uptake (Fig. 2f). Therefore, MCT1 mediates lactate uptake in efficient metastasizers.
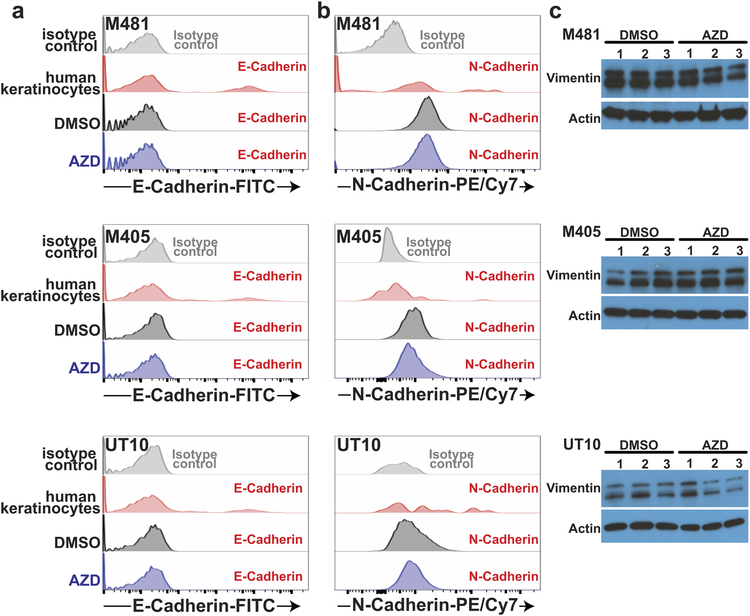
AZD3965 treatment did not significantly alter the levels of MCT1 (Extended Data Fig. 3h–i), CD147 (Extended Data Fig. 3j–k), β1 integrin (Extended Data Fig. 3n–o), or CD98 (Extended Data Fig. 3l–m) on the surface of melanoma cells. AZD3965 treatment also did not significantly alter IKKα (Extended Data Fig. 3p–r) or IKKβ (Extended Data Fig. 3s–u) levels, or the epithelial-mesenchymal transition markers E-cadherin (Extended Data Fig. 4a), N-cadherin (Extended Data Fig. 4b), and Vimentin (Extended Data Fig. 4c).
To test if MCT1 inhibition affected primary tumor growth or metastasis, we subcutaneously transplanted efficiently metastasizing melanoma cells from three patients into NSG mice. Once tumors were palpable, we treated every second day with AZD396529. AZD3965 had little effect on the growth of subcutaneous tumors (Fig. 2g) but substantially reduced the frequency of circulating melanoma cells in the blood (Fig. 2h), and metastatic disease burden in the same mice (Fig. 2i; Extended Data Fig. 5).
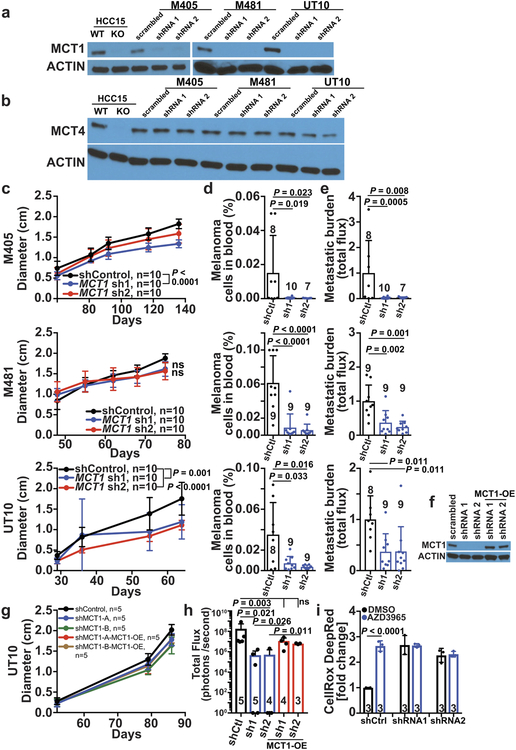
We also infected melanoma cells from three patients with scrambled control shRNA or shRNAs against MCT1 (Extended Data Fig. 6a; these shRNAs did not affect MCT4 expression, Extended Data Fig. 6b) then transplanted the cells subcutaneously in NSG mice. MCT1 knockdown had little effect on the growth of the subcutaneous tumors (Extended Data Fig. 6c), but significantly reduced the frequency of circulating melanoma cells in the blood (Extended Data Fig. 6d), and metastatic disease burden in all three melanomas (Extended Data Fig. 6e). Over-expression of an shRNA-insensitive MCT1 cDNA (Extended Data Fig. 6f) rescued these effects (Extended Data Fig. 6h) without affecting subcutaneous tumor growth (Extended Data Fig. 6g).
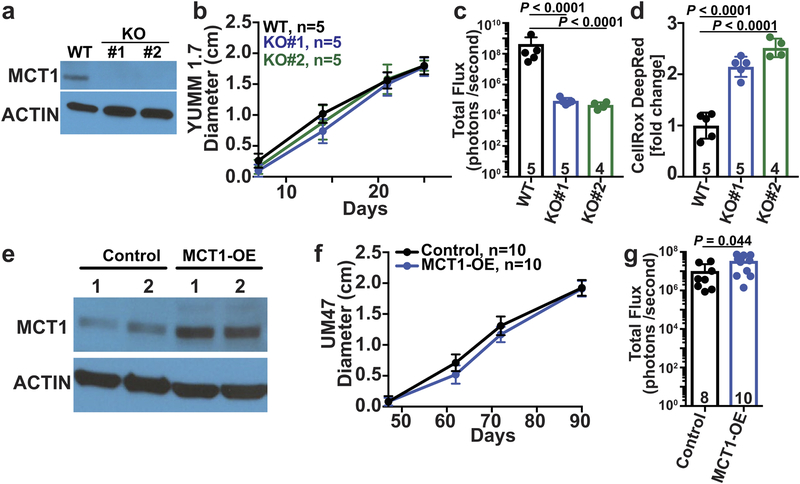
MCT1 over-expression in inefficiently metastasizing melanoma cells significantly increased metastatic burden in vivo without affecting subcutaneous tumor growth (Extended Data Fig. 7e–g). MCT1 is thus sufficient to increase metastasis in at least some melanomas.
We also inhibited MCT1 in mouse melanomas30 in immunocompetent C57BL mice (AZD3965 also has activity against mouse MCT131). MCT1 inhibition by treatment with AZD3965 (Fig. 2j and 2k) or CRISPR mediated deletion (Extended Data Fig. 7a–c) reduced metastatic disease burden without significantly affecting the growth of subcutaneous tumors. Human and mouse melanomas thus became more dependent upon MCT1 function during metastasis in both immunocompromised and immunocompetent environments.
MCT1 promotes survival during metastasis
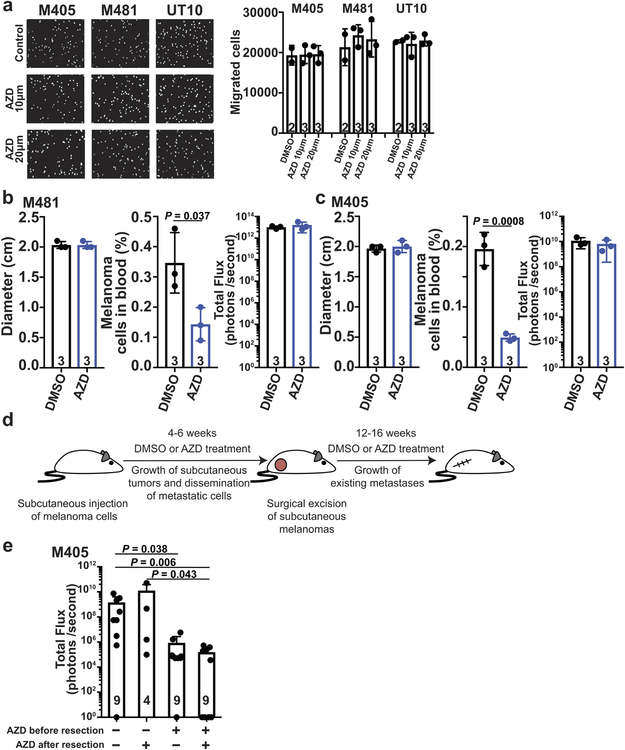
Inhibition of MCT1 with AZD3965 did not impair the migration/invasion of melanoma cells in culture (Extended Data Fig. 8a). Acute treatment with AZD3965 for 7 days in mice with established subcutaneous and metastatic tumors did not significantly affect the growth of subcutaneous or metastatic tumors, but did reduce the frequency of melanoma cells in the blood (Extended Data Fig. 8b and 8c). This suggests MCT1 inhibition reduced melanoma cell survival during metastasis.
To further test this, we resected the primary tumors to extend mouse survival (see schematic in Extended Data Fig. 8d). Treatment with AZD3965 prior to primary tumor resection, when cells were spontaneously metastasizing, significantly reduced metastatic tumor burden (Extended Data Fig. 8e). In contrast, treatment with AZD3965 only after primary tumor resection, after metastatic tumors were established, did not reduce metastatic tumor burden (Extended Data Fig. 8e). Melanoma cells are, therefore, particularly dependent upon MCT1 during metastasis.
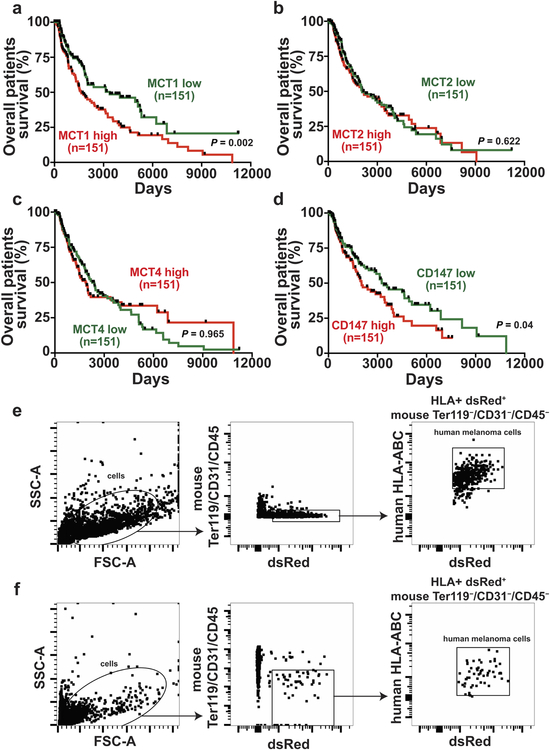
Analyses of clinical data27 and TCGA data showed that higher MCT1 expression is associated with significantly worse overall survival (Extended Data Fig. 9a). Differences in MCT2 or MCT4 expression did not significantly affect survival (Extended Data Fig. 9b and 9c). Consistent with the correlation between CD147 and MCT1 expression26, higher CD147 expression was also associated with significantly worse survival (Extended Data Fig. 9d).
MCT1 inhibition induces oxidative stress
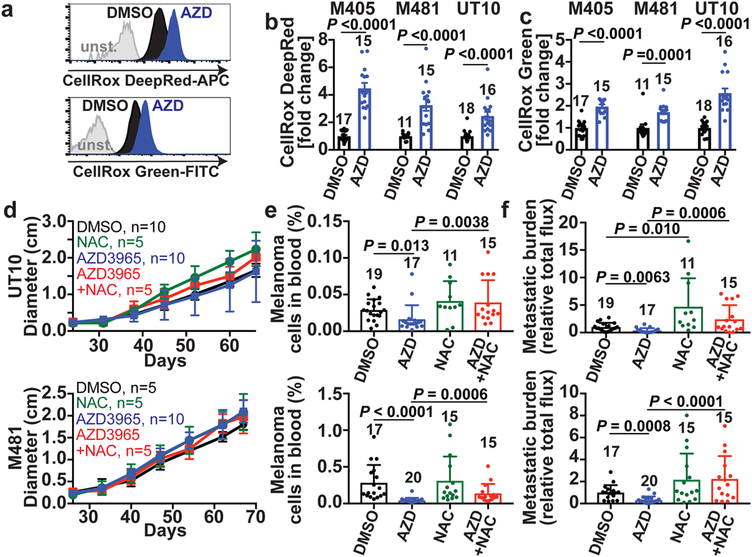
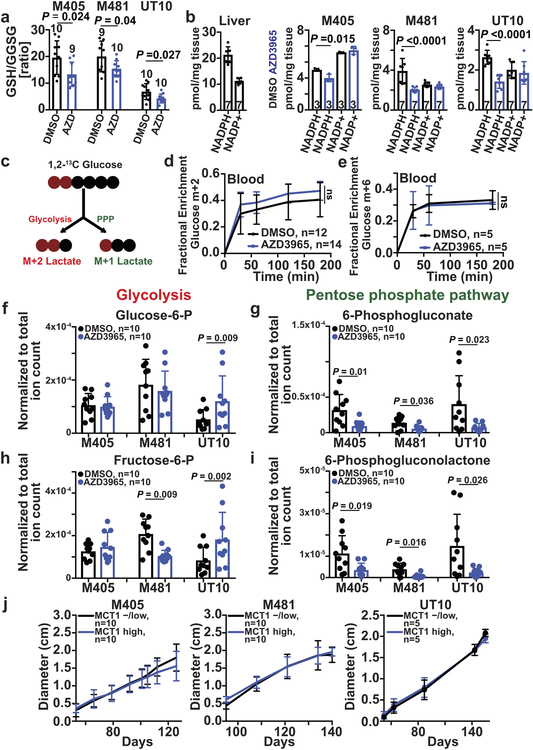
MCT1/4 inhibition in cancer cells in culture promotes oxidative stress by inhibiting lactate export, leading to reduced glycolysis21,32. AZD3965 treatment increased ROS levels in all three melanomas (Fig. 3a–c; see Extended data Fig. 9e–f for the gating strategy to identify melanoma cells by flow cytometry) as did MCT1 deletion from YUMM cells (Extended Data Fig. 7d). AZD3965 did not increase ROS levels in melanomas after shRNA-knockdown of MCT1, suggesting an on-target effect (Extended Data Fig. 6i). AZD3965 also reduced the glutathione (GSH) to oxidized glutathione (GSSG) ratios (Extended Data Fig. 10a) and NADPH levels (Extended Data Fig. 10b). Moreover, treatment with the anti-oxidant, N-acetyl-cysteine (NAC), rescued the effects of AZD3965 on circulating melanoma cells and metastatic disease burden (Fig. 3d–f). MCT1 inhibition thus impairs metastasis at least partly by increasing oxidative stress.
Figure 3. MCT1 inhibition causes oxidative stress in melanoma cells.
a-c, Representative flow cytometry histograms of ROS levels (a) and fold change in mean fluorescence intensity (b, c) in melanoma cells from mice treated with AZD3965 (AZD, blue) or DMSO control (black) (two experiments per melanoma). The number of tumors/mice analyzed per treatment is indicated in each panel. d–f, Growth of subcutaneous tumors (d) in xenografted mice treated with DMSO, AZD3965, N-acetyl-cysteine (NAC), or AZD3965+NAC as well as the frequency of circulating melanoma cells in the blood (e) and metastatic disease burden based on bioluminescence imaging at endpoint (f). Data in e and f reflect 3 experiments per melanoma, but only one representative experiment per melanoma is shown in d. Data represent mean ± s.d. Statistical significance was assessed using log2 t-tests (b), Mann-Whitney tests (c), , nparLD followed by Benjamini-Hochberg’s multiple comparisons adjustment (d), and log2 one-way ANOVAs with Holm-Sidak’s multiple comparisons adjustment (e-f).
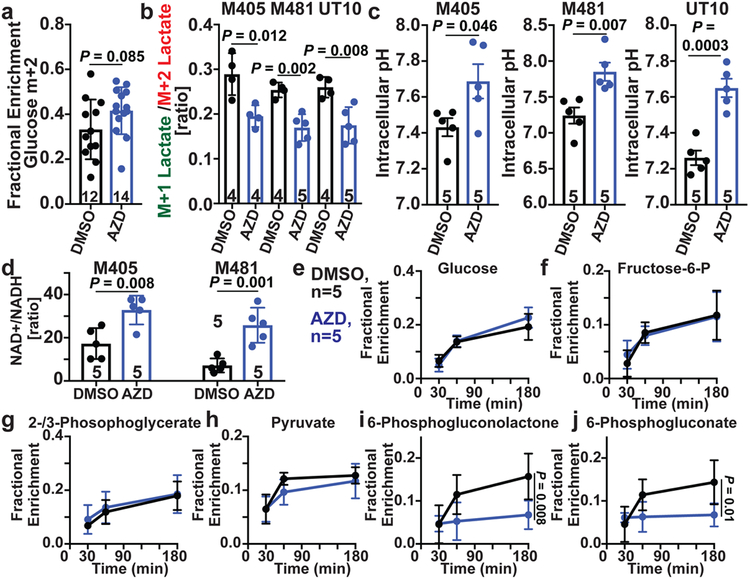
To test if MCT1 inhibition affected the pentose phosphate pathway (PPP), we infused [1,2-13C]glucose into xenografted mice and compared the relative flux of labelled glucose through glycolysis versus the oxidative PPP by comparing the ratio of M+1 lactate (derived from the oxidative PPP) to M+2 lactate (derived from glycolysis)33 (Extended Data Fig. 10c). We observed a trend toward increased glucose enrichment in tumors treated with AZD3965 (Fig. 4a). We consistently observed a lower M+1 lactate/M+2 lactate ratio in AZD3965-treated as compared to control tumors for all three melanomas (Fig. 4b, Extended Data Fig. 10d). This suggests MCT1 inhibition reduced flux through the oxidative PPP relative to glycolysis.
Figure 4. MCT1 inhibition reduces flux through the oxidative branch of the pentose phosphate pathway relative to glycolysis.
a, Glucose m+2 as a fraction of total glucose in xenografted tumors after [1,2-13C]glucose infusion (6 experiments). The number of tumors/mice per treatment is indicated in each panel. b, Lactate m+1/lactate m+2 ratio in subcutaneous tumors from the same mice (two experiments per melanoma). c,d, Intracellular pH (c) and NAD+/NADH ratio (d) in dissociated melanoma cells from subcutaneous tumors (one experiment per melanoma). e-j, Fractional enrichment in upper (e, f) and lower (g, h) glycolytic as well as pentose phosphate pathway (i, j) metabolites 30, 60, or 180 minutes after [U-13C]glucose infusion (2 experiments). Data represent mean ± s.d. Statistical significance was assessed using t-tests (a), nparLD (c), t-tests (b-d) or repeated measures two-way ANOVAs (e-j).
Upon infusion of [U-13C]glucose into xenografted mice (Extended Data Fig. 10e), AZD3965 treatment did not alter isotope enrichment in glucose or glycolytic intermediates (Fig. 4e–h), but reduced isotope enrichment in the oxidative PPP (Fig. 4i and 4j). AZD3965 treatment did not generally reduce the levels of glycolytic intermediates (Extended Data Fig. 10f and 10h) but did reduce the levels of oxidative PPP intermediates (Extended Data Fig. 10g and 10i). Therefore, the effect of MCT1 inhibition in melanoma cells in vivo (inhibition of lactate import, favoring glycolysis over the PPP) was quite different from MCT1 inhibition in culture (inhibition of lactate export, reducing glycolysis21,32). In lung cancer, MCT1 deletion also reduced lactate export and glycolysis in culture, but reduced lactate uptake and enhanced glucose metabolism in vivo17.
Lactate import can alter intracellular pH and the NAD+/NADH ratio because lactate is co-transported with a proton and converted to pyruvate intracellularly, converting NAD+ to NADH19. Consistent with this, in all three melanomas, AZD3965 treatment significantly increased intracellular pH (Fig. 4c), strongly suggesting substantial MCT1-dependent lactate/proton import in these tumors. The increase in pH after MCT1 inhibition could reduce flux through the PPP relative to glycolysis as elevated pH activates phosphofructokinase (PFK1) activity and suppresses glucose-6-phosphate dehydrogenase (G6PD) activity34,35, rate-limiting enzymes in glycolysis and the PPP, respectively. AZD3965 treatment also significantly increased the NAD+/NADH ratios (Fig. 4d), which has the potential to enhance glycolysis at the expense of the PPP.
Heterogeneity in MCT1 expression
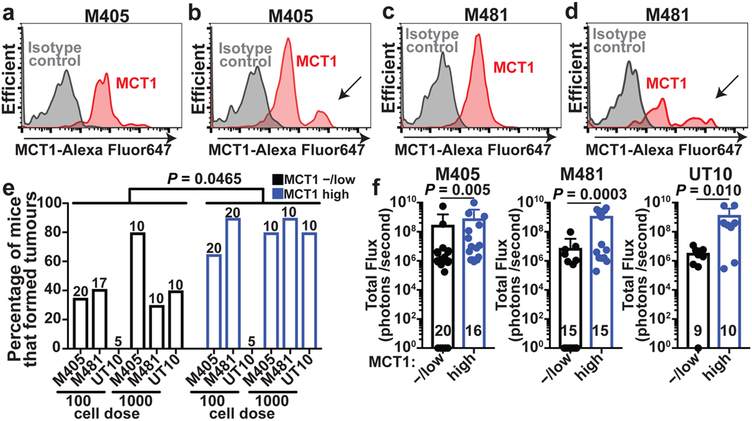
Flow cytometry revealed a more prominent MCT1high cell population among melanoma cells in the blood (see arrows in Fig. 5b and 5d) as compared to subcutaneous tumors in the same mice (Fig. 5a and 5c). This suggests that surface MCT1 was upregulated in circulating cells to increase PPP function, or that MCT1high cells preferentially survived during metastasis.
Figure 5. Heterogeneous MCT1 expression among melanoma cells from the same tumor.
a-d, Flow cytometric analysis of anti-MCT1 staining in melanoma cells from subcutaneous tumors (a,c) or circulating melanoma cells (b,d) from the same mice xenografted with M405 (a-b) or M481 (c-d) (Extended Data Fig. 9e and 9f show the gating strategies to identify human melanoma cells; the data are representative of 3 experiments). e, Flow cytometrically isolated MCT1high or MCT1−/low melanoma cells were intravenously transplanted into NSG mice, using 100 or 1000 cells per injection. The panel shows the percentage of injections that formed metastatic tumors (1–2 experiments per melanoma). The number of mice analyzed per treatment is indicated in each panel. f, Metastatic disease burden in the visceral organs of mice that survived to endpoint after injection with 100 cells (M405 and M481) or 1000 cells (UT10) based on bioluminescence signal intensity. Data represent mean ± s.d. Statistical significance was assessed using multiple linear regression (e) or Mann-Whitney tests (f).
To test if differences in MCT1 expression conferred differences in metastatic potential we isolated MCT1high and MCT1−/low melanoma cells by flow cytometry from subcutaneously growing M405, M481, and UT10 xenografts then transplanted the cells either subcutaneously (where oxidative stress does not appear to be limiting for tumor formation) or intravenously (where oxidative stress is limiting for tumor formation)3. MCT1high and MCT1−/low cells did not differ in their capacity to form subcutaneous tumors or the rates at which the subcutaneous tumors grew (Extended Data Fig. 10j). In contrast, after intravenous injection, MCT1high cells formed significantly more metastatic tumors than MCT1−/low cells (Fig. 5e) and the metastatic disease burden in visceral organs was significantly greater (Fig. 5f). This suggests that differences in MCT1 expression confer differences in the ability to survive during metastasis.
The ability of MCT1 to export lactate and to bidirectionally transport other monocarboxylates15,19,20 may contribute to its ability to promote metastasis. Other MCTs, particularly MCT4, may also influence the survival of melanoma cells during metastasis. Lactate taken up by melanoma cells via MCT1 likely has multiple metabolic fates. Some of the lactate, or pyruvate generated from the lactate, might be exported from the cell. The conversion of imported lactate to pyruvate, followed by export of that pyruvate20, could still stimulate flux through the PPP by reducing intracellular pH and the NAD+/NADH ratio.
METHODS
Melanoma specimen collection and enzymatic tumor disaggregation
Melanoma specimens were obtained with informed consent from patients according to protocols approved by the Institutional Review Board of the University of Michigan Medical School (IRBMED approvals HUM00050754 and HUM00050085; see ref24) and the University of Texas Southwestern Medical Center (IRB approval 102010–051). Materials used in the manuscript are available, either commercially or from the authors, though there are restrictions imposed by Institutional Review Board requirements and institutional policy on the sharing of materials from patients. Single cell suspensions were obtained by dissociating tumors in Kontes tubes with disposable pestles (VWR) followed by enzymatic digestion in 200 U/ml collagenase IV (Worthington), DNase (50 U/ml) and 5 mM CaCl2 for 20 min at 37°C. Cells were filtered through a 40-μm cell strainer to remove clumps.
Mouse studies and xenograft assays
All mouse experiments complied with all relevant ethical regulations and were performed according to protocols approved by the Institutional Animal Care and Use Committee at the University of Texas Southwestern Medical Center (protocol 2016–101360). Melanoma cell suspensions were prepared for injection in staining medium (L15 medium containing bovine serum albumin (1 mg/ml), 1% penicillin/streptomycin, and 10 mM HEPES (pH 7.4) with 25% high-protein Matrigel (product 354248; BD Biosciences)). Subcutaneous injections were performed in the right flank of NOD.CB17-Prkdcscid Il2rgtm1Wjl/SzJ (NSG) mice in a final volume of 50 μl. Four to 8-week-old male and female NSG mice were transplanted with 100 melanoma cells subcutaneously unless otherwise specified. Mouse cages were randomized between treatments (mice within the same cage had to be part of the same treatment). Both male and female mice were used. Subcutaneous tumor diameters were measured weekly with calipers until any tumor in the mouse cohort reached 2.5 cm in its largest diameter, in agreement with the approved animal protocol. At that point, all mice in the cohort were euthanized and spontaneous metastasis was evaluated by gross inspection of visceral organs for macrometastases and bioluminescence imaging of visceral organs to quantify metastatic disease burden (see details below).
YUMM1.7 (BrafV600E/+; PTEN−/−; Cdkn2−/−), YUMM3.3 (BrafV600E/+; Cdkn2−/−), and YUMM5.2 (BrafV600E/+; p53−/−) cell lines30 were obtained from and authenticated by ATCC and cell lines were confirmed to be mycoplasma free using the MycoAlert detection kit (Lonza). YUMM1.7, YUMM3.3 and YUMM5.2 were transfected with dsRed2 and luciferase (dsRed2-P2A-Luc) for bioluminescence imaging. Subcutaneous injections of 20,000–50,000 cells were performed in the right flank of 6- to 8-week-old male and female C57/BL6 mice in 50 μl.
For studies that involved treatment with the MCT1 inhibitor (AZD3965, Selleckchem), when subcutaneous tumors became palpable, the mice were administered AZD3965 by oral gavage every second day in xenografted mice and every day for mice transplanted with YUMM cells (30 mg/kg body mass in 200 μl of 0.5% promethylcellulose, 0.2% Tween80 and 5% DMSO). Tumor growth was monitored weekly with a caliper. Mice were euthanized when the primary tumor reached 2.5 cm in its largest diameter. In addition to measuring subcutaneous tumor diameters, the frequency of circulating melanoma cells in the blood (obtained by cardiac puncture) was measured by flow cytometry, and metastatic disease burden was measured by total bioluminescence levels in dissected visceral organs.
Bioluminescence imaging
Metastatic disease burden was monitored using bioluminescence imaging (all melanomas were tagged with stable expression of luciferase). Five minutes before performing luminescence imaging, mice were injected intraperitoneally with 100 μl of PBS containing d-luciferin monopotassium salt (40 mg/ml) (Biosynth) and mice were anaesthetized with isoflurane 2 min prior to imaging. All mice were imaged using an IVIS Imaging System 200 Series (Caliper Life Sciences) with Living Image software. Upon completion of whole-body imaging, mice were euthanized and individual organs were surgically removed and imaged. The exposure time ranged from 10 to 60 s, depending upon the maximum signal intensity, to avoid saturation of the luminescence signal. To measure the background luminescence, a negative control mouse not transplanted with melanoma cells was imaged. The bioluminescence signal (total photon flux) was quantified with ‘region of interest’ measurement tools in Living Image (Perkin Elmer) software. Metastatic disease burden was calculated as observed total photon flux across all organs in xenografted mice minus background total photon flux in negative control mice. Negative values were set to 1 for purposes of presentation and statistical analysis.
Cell labeling and flow cytometry
Melanoma cells were identified and sorted flow cytometrically as described3. All antibody staining was performed for 20 min on ice, followed by washing with HBBS and centrifugation at 200xg for 5 min. Cells were stained with directly conjugated antibodies against mouse CD45 (violetFluor 450, eBiosciences), mouse CD31 (390-eFluor450, Biolegend), mouse Ter119 (eFluor450, eBiosciences) and human HLA-A, B, C (G46–2.6-FITC, BD Biosciences). Human melanoma cells were isolated as cells that were positive for HLA and negative for mouse endothelial and hematopoietic markers. Cells were washed with staining medium and re-suspended in 4’,6-diamidino-2-phenylindole (DAPI; 1 μg/ml; Sigma) to eliminate dead cells from sorts and analyses. To analyze other markers, cells were stained with Alexa Fluor647-conjugated anti-human MCT1 (Bioss antibodies), Alexa Fluor488-conjugated anti-human CD147, PE-Vio770-conjugated anti-human CD98, Alexa Fluor700-conjugated anti-human β1-Integrin, FITC-conjugated anti-E-Cadherin (CD324) or PE/Cy7-conjugated anti-N-Cadherin (CD325). Cells were examined on an LSRFortessa cell analyzer (Becton Dickinson) or sorted on a FACS Fusion Cell Sorter (Becton Dickinson). For analysis of circulating melanoma cells, blood was collected from mice by cardiac puncture with a syringe pretreated with citrate-dextrose solution (Sigma) when subcutaneous tumors reached 2.5 cm in diameter. Red blood cells were sedimented using Ficoll, according to the manufacturer’s instructions (Ficoll Paque Plus, GE Healthcare). Remaining cells were washed with HBSS (Invitrogen) prior to antibody staining and flow cytometry.
Lentiviral/shRNA transduction of human melanoma cells
All melanomas expressed DsRed and luciferase as described3,24. All shRNAs were expressed from a pGFP-C-shLenti vector (Origene). For MCT1 (SLC16A1) knockdown, Origene shRNA clones TL309405A (5’-gaggaagagaccagtatagatgttgctgg-3’) and TL309405B (5’-atccagctctgaccatgattggcaagtat-3’) were used. For MCT1 (SLC16A1) over-expression, the human open reading frame was obtained from the Precision LentiORF collection (Dharmacon) in a bicistronic lentiviral construct that co-expressed turbo green fluorescent protein (pLOC-MCT1-IRES-tGFP). As a control, turbo red fluorescent protein (tRFP) was expressed in place of MCT1 in the same construct (pLOC-tRFP-IRES-tGFP). In rescue experiments, the MCT1 cDNA was mutated to change wobble bases in 10 consecutive codons to render the MCT1 cDNA insensitive to the anti-MCT1 shRNAs we used without affecting the amino acid sequence (5’-gag gaa gag acc agt ata gat gtt gct ggg-3’ to 5’-gaa gag gaa act agc att gac gtc gca ggc-3’ for shRNA#1 and 5’-aat cca gct ctg acc atg att ggc aag tat-3’ to 5’-aac ccg gcc cta acg atg ata ggg aaa tac-3’ for shRNA#2). The shRNA-resistant MCT1 sequence was cloned into the pLVX-EF1a-IRES-mCherry lentiviral vector to infect melanoma cells.
For virus production, 0.9 μg of the appropriate plasmid together with 1 μg of helper plasmids (0.4 μg pMD2G and 0.6 μg of psPAX2) were transfected into 293T cells using polyjet (SignaGen) according to the manufacturer’s instructions. The resulting replication-incompetent viral supernatants were collected at 48 h after transfection and filtered through a 45 μm filter. 300,000 freshly dissociated melanoma cells were infected with viral supernatants supplemented with 10 μg/ml polybrene (Sigma) for 4 hours. Cells were then washed twice with staining medium (L15 medium containing bovine serum albumin (1 mg/ml), 1% penicillin/streptomycin, and 10 mM Hepes (pH 7.4)), and approximately 25,000 cells (a mixture of infected and non-infected cells) were suspended in staining medium with 25% high-protein Matrigel (product 354248; BD Biosciences) and then injected subcutaneously into NSG mice. After growing to 1 to 2 cm in diameter, the tumors were excised and dissociated into single-cell suspensions as described above. DsRed and GFP double-positive cells were sorted and transplanted into NSG mice for in vivo studies to assess the effect of each shRNA construct on tumor growth and metastasis.
CRISPR editing of MCT1 in mouse melanoma cells
Single guide RNAs (sgRNAs) targeting exon 2 of mouse MCT1 were designed using publicly available tools (http://crispr.mit.edu): MCT1 sgRNA #1 5’– AAATGCCACCTGCGATTGGA–3’; MCT1 sgRNA #2 5’–ATGGATATCATCTATAATGT–3’. The sgRNAs were cloned into the U6-driven Cas9 expression vector (pX458-pSpCas9(BB)-2AGFP; 48318, Addgene)36. Approximately 100,000 YUMM1.7 mouse melanoma cells were plated in tissue-culture-treated 6-well plates in DMEM low glucose plus 10% FBS and 1% penicillin/streptomycin. 1 μg of each of the two sgRNA constructs was co-transfected into the melanoma cells using polyjet (SignaGen) according to the manufacturer’s instructions. After 48 hours, GFP+ cells were sorted into 96-well plates with DMEM low glucose plus 10% FBS and 1% penicillin/streptomycin at clonal density, then clones were expanded, and genomic DNA was isolated to screen for MCT1 exon 2 deletions.
Cell invasion
Transwell invasion assays were carried out using Corning BioCoat Tumor Invasion Systems (354165, Corning) as previously described37. Briefly, 5×10⁵ cells were seeded in the upper chamber of each well in serum-free culture medium. Fetal bovine serum (10%) in DMEM in the lower chamber was used as the chemoattractant. The invasive cells that migrated across the insert toward the lower chamber were stained with crystal violet solution after 24-hours of incubation at 37°C in 5% CO2. Images were captured using an Olympus microscope with a DP71 high resolution digital camera and cells were counted using ImageJ.
In vivo isotope tracing
All in vivo isotope tracing experiments were performed when subcutaneous tumors reached 2 cm in diameter. Before infusions, mice were fasted for 16 hours, then a 27-gauge catheter was placed in the lateral tail vein under anesthesia. We intravenously infused [U-13C]glutamine (CLM-1822, Cambridge Isotope Laboratories) as a bolus of 0.1725 mg/g body mass over 1 min in 150 μl of saline, followed by continuous infusion of 0.00288mg/g body mass/min for 5 hours (in a volume of 150 μl/hour)38. For [U-13C]glucose (CLM-1396, Cambridge Isotope Laboratories) and [1,2-13C]glucose infusion (CLM-504, Cambridge Isotope Laboratories), we intravenously infused a bolus of 0.4125 mg/g body mass over 1 min in 125 μl of saline, followed by continuous infusion of 0.008 mg/g body mass/min for 3 hours (in a volume of 150 μl/hour)17. At the end of the infusion, mice were killed, tumors were harvested, and immediately frozen in liquid nitrogen. To assess the fractional enrichments in plasma, 20 μl of blood was obtained after 30, 60, 120, and 180 minutes of infusion. For [U-13C]lactate (CLM-1579, Cambridge Isotope Laboratories) and [2-2H]lactate (693987, Sigma-Aldrich) infusion, we intravenously infused a bolus of 0.24 mg/g body mass over 10 min in 15 μl of saline, followed by continuous infusion of 0.0048 mg/g body mass/min for 3 hours (in 120 μl/hour)17. Care was taken during infusions not to increase blood glucose or lactate concentrations over pre-infusion levels.
Gas chromatography mass spectrometry
For gas chromatography-tandem mass spectrometry (GC-MS), subcutaneous tumor fragments weighing 5–15 mg were homogenized using an electronic tissue disruptor (Qiagen) in ice-cold 80:20 methanol:water (vol:vol) followed by with three freeze-thaw cycles in liquid nitrogen. The supernatant was collected after a 10 min centrifugation at 13,000xg at 4°C then lyophilized. To analyze isotope enrichment in the plasma, whole blood was chilled on ice then centrifuged for 1 minute at 13,000xg at 4°C to separate the plasma. Aliquots of 20–40 μl of plasma were added to 80:20 methanol:water to extract the metabolites, then lyophilized using a SpeedVac (Thermo), and re-suspended in 40 μl anhydrous pyridine. This solution was added to pre-prepared GC-MS autoinjector vials containing 80 μl N-(tert-butyldimethylsilyl)-N-methyltrifluoroacetamide (MTBSTFA) to derivatize polar metabolites. The samples were incubated at 70°C for 1 hour, then aliquots of 1 μl were injected for analysis. Samples were analyzed using either an Agilent 6890 or an Agilent 7890 gas chromatograph coupled to an Agilent 5973N or 5975C Mass Selective Detector, respectively. The observed distributions of mass isotopologues were corrected for natural abundance39.
Metabolomic analysis
HILIC chromatographic separation of metabolites was achieved using a Millipore (Burlington, MA) ZIC-pHILIC column (5μm, 2.1 × 150mm) with a binary solvent system of 10mM ammonium acetate in water, pH 9.8 (solvent A) and acetonitrile (solvent B) with a constant flow rate of 0.25 ml/minute. For gradient separation, the column was equilibrated with 90% Solvent B. After injection, the gradient proceeded as follows: 0–15 minutes linear ramp from 90% B to 30% B; 15–18 minutes isocratic flow of 30% B; 18–19 minutes linear ramp from 30% B to 90% B; 19–27 column regeneration with isocratic flow of 90% B. Metabolites were measured with a Thermo Scientific (Bremen, Germany) QExactive HF-X hybrid quadrupole orbitrap high resolution mass spectrometer (HRMS) coupled to a Vanquish UHPLC. HRMS data was acquired with two separate acquisition methods. Individual samples were acquired with an HRMS full scan (precursor ion only) method switching between positive and negative polarities. For ddHRMS/MS methods, precursor ion scans were acquired at a resolving power of 60,000 FWHM with a mass range of 80–1200 Daltons. The AGC target value was set to 1×10⁶ with a maximum injection time of 100 ms. Pooled samples were generated from an equal mixture of all individual samples and analyzed using individual positive- and negative-polarity data-dependent high resolution tandem mass spectrometry (ddHRMS/MS) acquisition methods for high-confidence metabolite ID. Product ion spectra were acquired at a resolving power of 15,000 FWHM without a fixed mass range. The AGC target value was set to 2×10⁵ with a maximum injection time of 150 ms. Data dependent parameters were set to acquire the top 10 ions with a dynamic exclusion of 30 seconds and a mass tolerance of 5 ppm. Isotope exclusion was turned on and a stepped normalized collision energy (NCE) applied with values of 30, 50, and 70. Settings remained the same in both polarities.
Metabolite identities were confirmed in three ways: 1) precursor ion m/z was matched within 5 ppm of theoretical mass predicted by the chemical formula; 2) fragment ion spectra were matched within a 5 ppm tolerance to known metabolite fragments; 3) the retention time of metabolites was within 5% of the retention time of a purified standard run with the same chromatographic method. Metabolites were relatively quantitated by integrating the chromatographic peak area of the precursor ion searched within a 5 ppm tolerance.
GSH/GSSG analysis by LC-MS/MS
For analysis of the glutathione (GSH) to oxidized glutathione (GSSG) ratio by liquid chromatography-tandem mass spectrometry (LC-MS/MS), subcutaneous tumor fragments weighing 5–15 mg were homogenized using an electronic tissue disruptor (Qiagen) in ice-cold 80:20 methanol:water (vol:vol), with 0.1% formic acid to prevent spontaneous oxidation40, followed by with three freeze-thaw cycles in liquid nitrogen. The supernatant was collected after a 10 min centrifugation at 13,000xg at 4°C then lyophilized. Lyophilized samples were reconstituted in 100μl of 0.1% formic acid in water, vortexed, and analyzed by LC–MS/MS. GSH/GSSG analysis was performed using a SCIEX 6500+ Q-Trap mass spectrometer coupled to a Shimadzu LC-20A UHPLC system. Chromatographic separation was carried out with a Waters HSS T3 column and a binary solvent gradient of water with 0.1% formic acid (solvent A) and acetonitrile with 0.1% formic acid (solvent B). The following gradient was used for separation: 0–3 minutes, isocratic flow of 0% B; 3–8 minutes, 0–100% B; 8–13 minutes, isocratic flow of 100% B; 13–13.1 minutes, 100–0% B; 13.1–18 minutes, isocratic flow of 0% B. The flow rate was held constant at 0.2 ml/minute. The MS was operated in MRM mode monitoring the following transitions for GSH, GSSH and their respective internal standards in positive mode: GSH 308/162; GSSG 613/355; GSH internal standard (ISTD) 311/165; GSSG ISTD 619/165. Transitions and source parameters were optimized by infusion prior to analysis. GSH/GSSG ratios were calculated by first determining the molar values of GSH and GSSG individually using a standard curve and the addition of internal standards. Data are reported as the ratio of calculated molar values.
13C tracing analysis for glycolytic and pentose phosphate pathway metabolites
The theoretical masses of 13C isotopes of glycolytic and pentose phosphate metabolites were calculated and added to a library of predicted isotopes. These masses were then searched with a 5 ppm tolerance and integrated only if the peak apex showed less than 1% difference in retention time from the [U-12C] monoisotopic mass in the same chromatogram. After analysis of the raw data, theoretical natural abundance was calculated. Natural isotope abundances were corrected using a customized R script, which could be found at the GitHub repository (https://github.com/wencgu/nac). The script was written by adapting the AccuCor algorithm41.
NAD+/NADH analysis by LC-MS/MS
Analysis of NAD+/NADH levels was performed on 5–15 mg tumor specimens. Tissues were homogenized manually with a pestle in ice-cold 80:20 methanol:water (vol:vol). After thorough homogenization, samples were spun at 13,000xg for 15 minutes at 4°C. Samples were then transferred to a fresh conical tube and spun for an additional 10 minutes at 13,000xg at 4°C. The supernatant was placed directly into autosampler vials for analysis by LC/MS. NAD+/NADH measurements were carried out on a Thermo Scientific (Bremen, Germany) QExactive HF-X hybrid quadrupole orbitrap high resolution mass spectrometer (HRMS) coupled to a Vanquish UHPLC. Chromatographic separation of metabolites was achieved using a Millipore (Burlington, MA) ZIC-pHILIC column (5μm, 2.1 × 150mm) with a binary solvent system of 10mM ammonium acetate in water, pH 9.8 (solvent A) and acetonitrile (solvent B) with a constant flow rate of 0.25 ml/minute. For gradient separation, the column was equilibrated with 90% Solvent B. After injection, the gradient proceeded as follows: 0–15 minutes linear ramp from 90% B to 30% B; 15–18 minutes isocratic flow of 30% B; 18–19 minutes linear ramp from 30% B to 90% B; 19–27 minutes of column regeneration with isocratic flow of 90% B. HRMS data were acquired with two different methods. Pooled samples were generated from an equal mixture of all individual samples and were analyzed using individual positive- and negative-polarity data-dependent high resolution tandem mass spectrometry (ddHRMS/MS) for high-confidence metabolite ID. Individual conditions were acquired with an HRMS full scan (precursor ion only) switching between positive and negative polarities. For ddHRMS/MS methods, precursor ion scans were acquired at a resolving power of 60,000 FWHM, with a mass range of 80–1200 Daltons. The Automated Gate Control (AGC) target value was set to 106, with a maximum injection time of 100 ms. Product ion spectra were acquired at a resolving power of 15,000 FWHM without a fixed mass range. The AGC target value was set to 2×10⁵ with a maximum injection time of 150 ms. Data dependent parameters were set to acquire the top 10 ions with a dynamic exclusion of 30 seconds and a mass tolerance of 5 ppm. Isotope exclusion was turned on and the normalized collision energy was set to a constant value of 30. Settings remained the same in both polarities. Polarity-switching HRMS full scan data were acquired with a resolving power of 60,000 FWHM and a mass range of 80–1200 Daltons; the AGC target was set to 106 and a maximum injection time of 100 ms. NAD+/NADH ratios were determined by integrating the extracted ion chromatograms (XICs) for NAD+ in positive mode (m/z = 664.1164) and NADH in negative mode (m/z = 664.1175). Fragmentation spectra from pooled samples were used for structural confirmation of NAD+ and NADH.
NADPH/NADP+ measurement
Subcutaneous tumors were surgically excised as quickly as possible after killing the mice then melanoma cells were mechanically dissociated and NADPH and NADP+ were measured using the NADPH/NADP Glo-Assay (Promega) following the manufactures instructions. Standard curves were generated using purified NADP+ (N-5755, Sigma-Aldrich) and NADPH (N-6705, Sigma-Aldrich) prepared in the same buffers used for the experimental samples. The absolute amounts of NADP+ and NADPH in each sample was then determined using these standard curves. Luminescence was measured using a using a FLUOstar Omega plate reader (BMG Labtech). Values were normalized to tissue mass.
Assays for ROS levels and intracellular pH
Subcutaneous tumors were surgically excised as quickly as possible after euthanizing the mice then melanoma cells were mechanically dissociated in 700 μl of staining medium. Single-cell suspensions were obtained by passing the dissociated cell suspensions through a 40 μm cell strainer. To analyze ROS levels, equal numbers of dissociated cells from each treatment were stained for 30 min at 37°C with 5 mM CellROX Green or CellROX DeepRed (Life Technologies) in HBSS-free (Ca2+ and Mg2+-free) and DAPI (to distinguish live from dead cells). The cells were then washed and analyzed by flow cytometry using either a FACS Fusion or a FACS Fortessa (BD Biosciences) to assess ROS levels in live human melanoma cells (positive for human HLA and dsRed and negative for DAPI and mouse CD45/CD31/Ter119).
To assess intracellular pH, equal numbers of dissociated cells from each treatment were stained with a pH-dependent ratiometric dye, Seminaphthorhodaflouor-1 (Acetoxymethyl Ester) (SNARF1)42 in HBSS-free, and DAPI. We generated standard curves by incubating dissociated melanoma cells with pH 5.5, pH 6.5, or pH 7.5 buffers in the presence of 10 mM valinomycin and nigercin (ionophores that allowed the cytoplasm to equilibrate with extracellular pH; Intracellular pH Calibration Buffer Kit, Life Technologies). SNARF1 fluorescence was measured by flow cytometry as described above then converted to pH values using the standard curves.
Western blot analysis
We used HCC15 cell lines as positive and negative controls for MCT1 and MCT4 expression (previously described17). The identity of the HCC15 cells was confirmed using DNA fingerprinting and they were confirmed to be mycoplasma free using the e-Myco kit (Bulldog bio). MCF7 cell lines were used as a positive control for MCT2. MCF7 cell lines were obtained from, and authenticated by, ATCC and confirmed to be mycoplasma free using the e-Myco kit (Bulldog bio). Melanomas were excised and quickly snap frozen in liquid nitrogen. Tumor lysates were prepared in Kontes tubes with disposable pestles using RIPA Buffer (Cell Signaling Technology) supplemented with phenylmethylsulphonyl fluoride (Sigma), and protease and phosphatase inhibitor cocktail (Roche). The bicinchoninic acid protein assay (Thermo) was used to quantify protein concentrations. Equal amounts of protein (10–20 μg) were loaded into each lane and separated on 4–20% polyacrylamide tris glycine SDS gels (BioRad), then transferred to polyvinylidene difluoride membranes (BioRad). The membranes were blocked for 1 hour at room temperature with 5% milk in TBS supplemented with 0.1% Tween20 (TBST) and then incubated with primary antibodies overnight at 4°C. After washing, then incubating with horseradish peroxidase conjugated secondary antibody (Cell Signaling Technology), signals were developed using SuperSignal West (Thermo Fisher). Blots were sometimes stripped using Restore stripping buffer (Thermo Fisher) and restained with other primary antibodies. The following antibodies were used for western blots: anti-MCT1 (AB3538P, Millipore), anti-MCT2 (LN2021159, LabNed), anti-MCT4 (AB3316P, Millipore), anti-CD147 (ab64616, Abcam), anti-LDHA (C4B5, Cell Signaling Technologies), anti-LDHB (ab53292, Abcam), anti-IKKα (D3W6N, Cell Signaling Technology), anti-IKKβ (D30C6, Cell Signaling Technology), anti-Vimentin (D21H3, Cell Signaling Technology), anti-Tubulin (ab52866, Abcam) and anti-β-Actin (D6A8, Cell Signaling Technologies).
Immunofluorescence staining of frozen tissue sections
Tissues were fixed in 4% paraformaldehyde overnight at 4°C, washed in PBS, and cryoprotected in 30% sucrose overnight. Tissues were then frozen in OCT (Fisher). Sections (10 μm) were cut using a cryostat, washed 3 times in PBS for 5 min each, and blocked in 5% donkey serum (JacksonImmuno) in PBS for 1 hour at room temperature. Sections were then stained with primary antibodies overnight: anti-MCT1 (HPA003324, Sigma, 1:500) and anti-S100 (Z0311, Dako, 1:500). The next day, sections were washed 3 times in PBS for 5 min each and stained with secondary antibodies: Alexa Fluor 488-AffiniPure F(ab’)2 Fragment Donkey anti-Rabbit IgG, Cy3-AffiniPure F(ab’)2 Fragment Donkey anti-Rat IgG (JacksonImmuno) at 1:250 for 1 hour in the dark at room temperature. Sections were washed 3 times in PBS for 5 min each then stained with DAPI (1:1000) and mounted with Flouromount-G (SouthernBiotech) for confocal imaging.
Statistical methods
Generally, multiple melanomas from different patients were tested in multiple independent experiments performed on different days. Mice were allocated to experiments randomly and samples processed in an arbitrary order, but formal randomization techniques were not used. Prior to analyzing the statistical significance of differences among treatments, we tested whether data were normally distributed and whether variance was similar among treatments. To test for normality, we performed the Shapiro–Wilk tests when 3≤n<20 or D’Agostino Omnibus tests when n≥20. To test whether variability significantly differed among treatments we performed F-tests (for experiments with two treatments) or Levene’s median tests (for experiments with more than two treatments). When the data significantly deviated from normality (p < 0.01) or variability significantly differed among treatments (p < 0.05), we log2-transformed the data and tested again for normality and variability. If the transformed data no longer significantly deviated from normality and equal variability, we performed parametric tests on the transformed data. If log2-transformation was not possible or the transformed data still significantly deviated from normality or equal variability, we performed non-parametric tests on the non-transformed data.
All of the statistical tests we used were two-sided, where applicable. To assess the statistical significance of a difference between two treatments, we used Student’s t-tests/paired t-tests (when a parametric test was appropriate), Welch’s t-tests (when data were normally distributed but not equally variable), or Mann-Whitney tests/Wilcoxon tests (when a non-parametric test was appropriate). When it was possible to perform a one-sided or a two-sided statistical test we always performed two-sided tests. Multiple t-tests (parametric or non-parametric) were followed by Holm-Sidak’s multiple comparisons adjustment. To assess the statistical significance of differences between more than two treatments, we used one-way or two-way ANOVAs (when a parametric test was appropriate) followed by Holm-Sidak’s multiple comparisons adjustment or Kruskal-Wallis tests (when a non-parametric test was appropriate) followed by Dunn’s multiple comparisons adjustment. To assess the statistical significance of differences between time-course data, we used repeated-measures two-way ANOVAs (when a parametric test was appropriate and there were no missing data points) or mixed-effects analyses (when a parametric test was appropriate and there were missing data points) followed by Dunnett’s multiple comparisons adjustment, or nparLD43, a statistical tool for the analysis of non-parametric longitudinal data, followed by the Benjamini-Hochberg method for multiple comparisons adjustment. To assess the statistical significance of overall differences between percentages of tumors formed by different treatments and cell doses in all melanomas, we used multiple linear regressions. To assess the statistical significance of differences in overall survival of TCGA SKCM patients, we used Mantel-Cox’s log-rank tests. All statistical analyses were performed with Graphpad Prism 8.1 or R 3.5.1 with the stats, fBasics, car, and nparLD packages. All data represent mean ± standard deviation.
Samples sizes were not pre-determined based on statistical power calculations but were based on our experience with these assays. For assays in which variability is commonly high, we typically used n>10. For assays in which variability is commonly low, we typically used n<10. No data were excluded; however, mice sometimes died during experiments, presumably due to the growth of metastatic tumors. In those instances, data that had already been collected on the mice in interim analyses were included (such as subcutaneous tumor growth measurements over time) even if it was not possible to perform the end-point analysis of metastatic disease burden (due to the premature death of the mice).
During all isotope tracing experiments, the data were analyzed in a manner blinded to sample identity or treatment. A.T. performed all of the infusions, collected tumor specimens, and performed mass spectrometry, then passed the de-identified data files to B.F. and A.S., who analyzed the isotope tracing patterns. After the patterns had been analyzed for individual mice, the samples were re-identified so the results could be interpreted.
Data availability
The Source Data files contain the numeric data for all figures and extended data figures. Data are available from the corresponding author upon request.
Extended Data
Extended Data Figure 1. Plasma enrichment of isotopically-labelled metabolites after infusion into xenografted mice. Related to Figure 1.
a, Summary of the melanomas used in this study and their spontaneous metastatic behavior after subcutaneous transplantation into NSG mice. Melanomas were characterized as inefficient or efficient metastasizers. Before subcutaneous tumors grew to 2.5 cm in diameter (when the mice were killed per approved protocol), inefficient metastasizers rarely formed macrometastases or micrometastases beyond the lung whereas efficient metastasizers commonly formed macrometastases as well as micrometastases in multiple organs (the data reflect results from 1 to 5 independent experiments per melanoma). Some of these data have been published previously24. b-g, Isotope tracing was performed in NSG mice subcutaneously xenografted with efficiently metastasizing melanomas from four patients (M405, M481, M487, and UT10) and inefficiently metastasizing melanomas from nine patients (M715, UM17, UM22, UM43, UM47, M498, M528, M597 and M610). The number of tumors/mice analyzed per treatment is indicated in each panel. b, Glutamine m+5 as a fraction of total plasma glutamine in mice infused with [U-13C]glutamine (14 independent experiments). c, Isotope enrichment in subcutaneous tumors after [U-13C]glutamine infusion (14 independent experiments). d, Glucose m+6 as a fraction of total plasma glucose in mice infused with [U-13C]glucose (20 independent experiments). e, Plasma glucose and lactate concentrations before and after infusion. f, Lactate m+3 as a fraction of total plasma lactate in mice infused with [U-13C]lactate (23 independent experiments). g, Lactate m+1 as a fraction of total plasma lactate in mice infused with [2-2H]lactate (three independent experiments). h, Expected isotope labelling after [2-2H]lactate infusion. i, Western blot analysis of lactate dehydrogenase A and B in subcutaneous tumors from NSG mice xenografted with efficiently (M405, M481, and UT10) or inefficiently (UM17, UM43, and UM47) metastasizing melanomas (representative of four independent experiments). All data represent mean ± s.d. Statistical significance was assessed using Mann-Whitney tests (c) and t-tests at 180 or 300 minutes when tumors were harvested for analysis (b, d and f-g) or paired t-tests (e).
Extended Data Figure 2. Efficient metastasizers express higher levels of MCT1 than inefficient metastasizers. Related to Figure 2.
a, Quantification of MCT1 relative to Actin bands from the western blot in Figure 2a comparing efficient versus inefficient metastasizers. b, Quantification of MCT4 relative to Actin bands from the western blot in Figure 2c comparing efficient versus inefficient metastasizers. c-d, Quantification of mean fluorescence intensities for MCT1 staining in the flow cytometry plots comparing efficient (Fig. 2e) and inefficient (Fig. 2d) metastasizers. HCC15 cells and MCT1-deficient HCC15 cells were positive and negative controls (c). e-f, Immunofluorescence staining for MCT1 (green) in sections from subcutaneous tumors from inefficiently (e, UM47) or efficiently (f, M405) metastasizing melanomas. An adjacent section was stained with an antibody against S100b (a melanoma marker, green). Images are representative of three independent experiments per melanoma. g,h Immunofluorescence staining for MCT1 (green) in sections from subcutaneous tumors from inefficient (g, M498, M610, and M597) and efficient (h, M481, UT10, and M405) metastasizers. In each case, an adjacent section was stained with an antibody against S100b (a melanoma marker, green). Images are representative of results from two independent experiments per melanoma. i-j, While efficient metastasizers often exhibited cell surface staining (j), inefficient metastasizers typically exhibited diffuse cytoplasmic staining (i). Images are representative of results from two independent experiments per melanoma. All data represent mean ± s.d.. Statistical significance was assessed using Student’s t-tests (a-b and d).
Extended Data Figure 3. MCT1 inhibition impairs metastasis without altering MCT1, CD147, CD98, or β1-Integrin expression levels. Related to Figure 2.
a-c, Western blot analysis of MCT1 (a), MCT4 (b) and CD147 (c) in subcutaneous tumours versus metastatic liver (liv), kidney (kid), and pancreas (pan) nodules from NSG mice transplanted with three melanomas. d-g, Flow cytometry histograms of anti-MCT1 (d, e), or anti-CD147 (f, g) staining in melanoma cells from subcutaneous tumors or metastatic nodules from mice transplanted with M405 (d, f) or M481 (e, g) melanomas. h-o, Flow cytometry histograms and mean fluorescence intensities of anti-MCT1 (h, i), anti-CD147 (j, k), anti-CD98 (l, m), or anti-β1-Integrin (n-o) staining in melanoma cells from subcutaneous tumors treated with DMSO (control; black) or AZD3965 (MCT1 inhibitor; blue). The number of tumors/mice analyzed in each treatment is indicated within the bars in each panel (2 to 3 experiments). In all flow cytometric analyses, human melanoma cells were distinguished from mouse cells based on positivity for HLA-ABC and DsRed and negativity for mouse CD31/CD45/Ter119 staining (see Extended Data Figure 9e and 9f for gating strategy). p-u, Western blot analysis of IKKα (p-r) and IKKβ (s-u) in subcutaneous tumors from NSG mice treated with DMSO or AZD3965. All data represent mean ± s.d. Statistical significance was assessed with two-way ANOVAs (i, k, m, and o).
Extended Data Figure 4. MCT1 inhibition with AZD3965 impairs metastasis without altering markers of epithelial to mesenchymal transition (EMT). Related to Figure 2.
Flow cytometry histograms of anti-E-cadherin (a) and anti-N-cadherin (b) staining in melanoma cells from subcutaneous tumors of mice treated with DMSO (control) or AZD3965. Human keratinocytes were included as a control in each case as they are known to include subpopulations of E-cadherin and N-cadherin positive cells. In xenografts, human melanoma cells were distinguished from mouse cells based on positivity for HLA-ABC and DsRed and negativity for mouse CD31/CD45/Ter119 staining (Extended Data Figure 9e and 9f for gating strategy). The data are representative of 2–3 mice analyzed in two independent experiments. c, Western blot analysis of vimentin in subcutaneous tumors from NSG mice treated with DMSO or AZD3965.
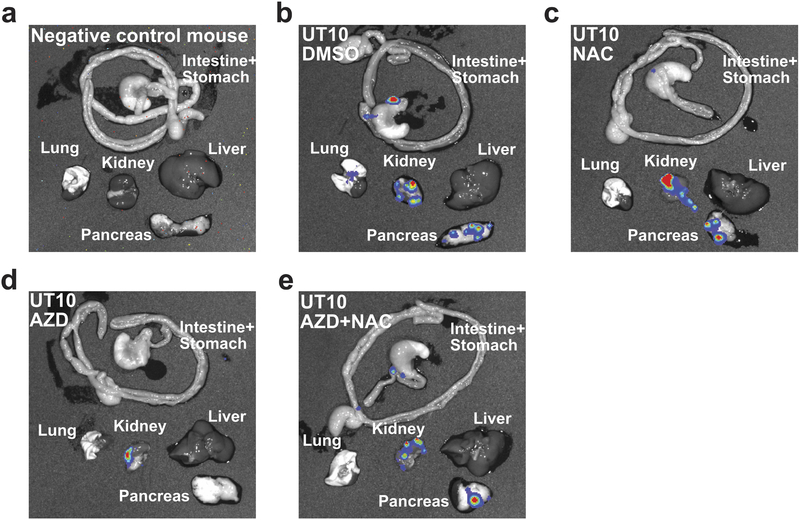
Extended Data Figure 5. Representative images of the bioluminescence analysis of visceral organs to determine metastatic disease burden at endpoint. Related to Figures 2, 3 and 5.
a-e, Visceral organs were surgically removed from each mouse at endpoint and imaged to identify macro and micrometastases and to determine bioluminescence signal intensity. Each melanoma was tagged with constitutive luciferase expression.
Extended Data Figure 6. shRNA mediated knockdown of MCT1 inhibits melanoma metastasis in vivo. Related to Figure 2.
a, Western blot analysis of MCT1 in subcutaneous tumors from mice xenografted with efficiently metastasizing melanomas transfected with scrambled control shRNA or shRNA1 or shRNA2 against MCT1. HCC15 cells were used as a positive control and MCT1-deficient HCC15 cells were used as a negative control (representative of 2 independent experiments). b, Western blot analysis of MCT4 in subcutaneous tumors from mice xenografted with efficiently metastasizing melanomas transfected with scrambled control shRNA or shRNA1 or shRNA2 against MCT4. HCC15 cells were used as a positive control and MCT4-deficient HCC15 cells were used as a negative control. c-e, Growth of subcutaneous tumors (c) in mice transplanted with melanomas transfected with scrambled control shRNA or shRNA1 or shRNA2 against MCT1. The number of mice analyzed in each treatment is indicated in each panel (one experiment per melanoma). The frequency of circulating melanoma cells in the blood (d) and metastatic disease burden based on bioluminescence imaging (e) in the same mice. f, Western blot analysis of MCT1 in subcutaneous tumors transfected with scrambled control shRNA or shRNA1 or shRNA2 against MCT1, with (OE) or without an shRNA-insensitive MCT1 cDNA. g-h, Growth of subcutaneous tumors (g) and metastatic disease burden at endpoint (h) in mice transplanted with melanomas transfected with scrambled control shRNA or shRNA1 or shRNA2 against MCT1 and an shRNA-insensitive MCT1 cDNA. i, Fold change in mean fluorescence intensity for CellRox DeepRed staining (ROS) in xenografted melanoma cells with scrambled control shRNA or shRNA1 or shRNA2 against MCT1 treated with AZD3965 or DMSO. All data represent mean ± s.d.. Statistical significance was assessed using nparLD followed by Benjamiani-Hochberg’s multiple comparisons adjustment (c), log2 one-way ANOVAs with Holm-Sidak’s multiple comparisons adjustment (d-e and h), mixed-effects analysis followed by Dunnett’s multiple comparisons adjustment (g), or log2 two-way ANOVA with Sidak’s multiple comparisons adjustment (i).
Extended Data Figure 7. CRISPR deletion of MCT1 from mouse melanoma cells impairs metastasis while MCT1 over-expression in patient-derived xenografts increases metastasis. Related to Figure 2.
a, Western blot analysis of MCT1 in wild-type parental YUMM1.7 melanoma cells as well as two lines from which MCT1 had been deleted using CRISPR. b-d, Growth of subcutaneous tumors (b), total metastatic disease burden at endpoint by bioluminescence imaging of visceral organs (c) and CellRox DeepRed staining of subcutaneous tumor cells (d). The number of mice analyzed in each treatment is indicated in each panel (one experiment; note that one mouse died in the KO#2 treatment before endpoint analysis). e, Western blot analysis of MCT1 in an inefficiently metastasizing melanoma (UM47) expressing MCT1 cDNA. f-g, Growth of subcutaneous tumors (f) and total metastatic disease burden at endpoint by bioluminescence imaging of visceral organs (g) from mice transplanted with these melanomas (one experiment; note that two mice died in the control treatment before endpoint analysis). All data represent mean ± s.d.. Statistical significance was assessed using one-way ANOVA followed by Dunnett’s multiple comparison adjustment (b: day 25) or log2 one-way ANOVAs followed by Dunnett’s multiple comparisons adjustment (c-d), t-test (f: day 90) or log2 t-test (g).
Extended Data Figure 8. MCT1 inhibition does not impair the migration of melanoma cells in culture but appears to reduce metastatic disease burden by killing metastasizing melanoma cells in vivo. Related to Figure 2.
a, Migration in transwell invasion assays of three melanomas treated with DMSO (control) or AZD3965 (MCT1 inhibitor), including representative images (left) and counts (right) of the cells that migrated across the insert after 24 hours (one experiment with two to three replicate cultures per melanoma). b-c, Effect of acute treatment with AZD3965 (7 days) on the diameter of subcutaneous tumors, the frequency of circulating melanoma cells in the blood, and metastatic disease burden in mice with established M481 (b) or M405 (c) melanomas. Treatment was initiated when the subcutaneous tumors reached 2 cm in diameter (one experiment per melanoma with three mice per treatment). d, Efficiently metastasizing melanoma cells (M405) were subcutaneously transplanted into mice, allowed to spontaneously metastasize, then the primary tumors were resected to prolong survival and to allow the metastatic tumors that had formed prior to primary tumor resection to grow larger. Mice were treated with AZD3965 for the duration of the experiment, only prior to primary tumor resection, or only after primary tumor resection. e, Analysis of total metastatic disease burden at endpoint showing that metastatic disease burden was reduced when AZD3965 treatment was performed prior to primary tumor resection, during the time when melanoma cells were spontaneously metastasizing, but before metastatic tumors were established. The number of mice per treatment is shown in the panel (two independent experiments). All data represent mean ± s.d.. Statistical significance was assessed using two-way ANOVAs followed by Dunnett’s multiple comparison’s adjustment (a), t-tests (b-c) or Kruskal-Wallis test followed by Dunn’s multiple comparison’s adjustment (e).
Extended Data Figure 9. Increased MCT1 expression in melanomas is associated with significantly worse patient survival. Related to Figure 2.
a-d, Kaplan-Meier overall survival curves of melanoma patients stratified based on MCT1 (a), MCT2 (b), MCT4 (c), and CD147 (d) expression level within tumor specimens. Data were from the SKCM cohort in TCGA (https://portal.gdc.cancer.gov/projects/TCGA-SKCM). Each panel compares the top third of patients with the highest expression levels versus the bottom third of patients with the lowest expression levels. Ticks represent censored values. e-f, Flow cytometry plots showing the gating strategies used to identify human melanoma cells in subcutaneous tumors (e) or the blood (f) of xenografted mice. Cells were gated on forward versus side scatter (FSC-A vs. SSC-A) to exclude red blood cells and clumps of cells. Human melanoma cells were selected by including cells that stained positively for DsRed (stably expressed in all melanoma lines) and HLA and excluding cells that stained positively for the mouse hematopoietic and endothelial markers CD45, CD31, or Ter119. The statistical significance of the differences in overall survival (a-d) were assessed using the Mantel-Cox log-rank test.
Extended Data Figure 10. MCT1 inhibition reduces the levels of pentose phosphate pathway, but not glycolytic, metabolites. Related to Figures 3–5.
a, Glutathione (GSH) to oxidized glutathione (GSSG) ratios in melanoma cells from mice treated with AZD3965 or DMSO (two independent experiments per melanoma). b, Quantitative analysis of NADPH and NADP+ in melanoma cells from mice treated with AZD3965 or DMSO (one or two experiments per melanoma). Liver cells were included as a control, with a high NADPH/NADP+ ratio. c, Expected isotope labelled species after [1,2-13C]glucose infusion. d, Glucose m+2 as a fraction of total plasma glucose in mice xenografted with efficiently metastasizing melanomas (M405, M481, and UT10), treated with DMSO or AZD3965, and infused with [1,2-13C]glucose. e, Glucose m+6 as a fraction of total plasma glucose in mice infused with [U-13C]glucose. The number of mice per treatment is indicated in each panel (two independent experiments). f-i, LC-MS measurement of the levels of glycolytic (f, h) and oxidative pentose phosphate pathway (g, i) metabolites in subcutaneous tumor cells from mice xenografted with melanomas treated with DMSO (control) or AZD3965 (MCT1 inhibitor) for 7 days. j, Flow cytometrically isolated MCT1high or MCT1−/low melanoma cells were subcutaneously transplanted into NSG mice, using 10 or 100 cells per injection. All injections formed tumors. Rate of growth of the tumors initiated with 10-cell injections. All data represent mean ± s.d.. Statistical significance was assessed using t-tests (a), repeated measures two-way ANOVAs (b), t-test (e: 180 min), log2 two-way ANOVAs (f and h), log2 t-tests (g: M405 and UT10), Mann-Whitney test (g: M481 and i: M481), Welch’s t-tests (i: M405 and UT10) or using nparLD test (d and j).
Supplementary Material
ACKNOWLEDGEMENTS
S.J.M. is a Howard Hughes Medical Institute (HHMI) Investigator, the Mary McDermott Cook Chair in Pediatric Genetics, the Kathryn and Gene Bishop Distinguished Chair in Pediatric Research, the director of the Hamon Laboratory for Stem Cells and Cancer, and a Cancer Prevention and Research Institute of Texas Scholar. R.J.D. is an HHMI Investigator, the Robert L. Moody, Sr. Faculty Scholar at UT Southwestern and Joel B. Steinberg, M.D. Chair in Pediatrics. The research was supported by the Cancer Prevention and Research Institute of Texas (RP170114 and RP180778), the National Institutes of Health (R35 CA220449), and the Robert A. Welch Foundation (I-1733). A.T. was supported by the Else Kröner-Forschungskolleg and the Leopoldina Fellowship Program (LPDS 2016-16) of the German National Academy of Sciences. B.F. was supported by a postdoctoral fellowship from the Canadian Institutes of Health Research (MFE 140911). B.S. and A.S. were supported by Ruth L. Kirschstein National Research Service Award Postdoctoral Fellowships from the National Heart, Lung, and Blood Institute (F32 HL139016-01) and the National Institute of Child Health and Human Development (F32 HD096786-01). We thank A. Gross for mouse colony management as well as N. Loof and the Moody Foundation Flow Cytometry Facility.
References
- 1.Vanharanta S & Massague J Origins of metastatic traits. Cancer Cell 24, 410–421 (2013). [DOI] [PMC free article] [PubMed] [Google Scholar]
- 2.Le Gal K et al. Antioxidants can increase melanoma metastasis in mice. Sci Transl Med 7, 308re308 (2015). [DOI] [PubMed] [Google Scholar]
- 3.Piskounova E et al. Oxidative stress inhibits distant metastasis by human melanoma cells. Nature 527, 186–191 (2015). [DOI] [PMC free article] [PubMed] [Google Scholar]
- 4.Luo M et al. Targeting Breast Cancer Stem Cell State Equilibrium through Modulation of Redox Signaling. Cell Metab 28, 69–86 (2018). [DOI] [PMC free article] [PubMed] [Google Scholar]
- 5.Kfoury A et al. AMPK promotes survival of c-Myc-positive melanoma cells by suppressing oxidative stress. EMBO J 37 (2018). [DOI] [PMC free article] [PubMed] [Google Scholar]
- 6.Xu IM et al. Transketolase counteracts oxidative stress to drive cancer development. Proc Natl Acad Sci U S A 113, 725–734 (2016). [DOI] [PMC free article] [PubMed] [Google Scholar]
- 7.Fan J et al. Quantitative flux analysis reveals folate-dependent NADPH production. Nature 510, 298–302 (2014). [DOI] [PMC free article] [PubMed] [Google Scholar]
- 8.Lewis CA et al. Tracing compartmentalized NADPH metabolism in the cytosol and mitochondria of mammalian cells. Mol Cell 55, 253–263 (2014). [DOI] [PMC free article] [PubMed] [Google Scholar]
- 9.Harris IS et al. Glutathione and thioredoxin antioxidant pathways synergize to drive cancer initiation and progression. Cancer Cell 27, 211–222 (2015). [DOI] [PubMed] [Google Scholar]
- 10.Sayin VI et al. Antioxidants accelerate lung cancer progression in mice. Sci Transl Med 6, 221ra215 (2014). [DOI] [PubMed] [Google Scholar]
- 11.DeNicola GM et al. Oncogene-induced Nrf2 transcription promotes ROS detoxification and tumorigenesis. Nature 475, 106–109 (2011). [DOI] [PMC free article] [PubMed] [Google Scholar]
- 12.Schafer ZT et al. Antioxidant and oncogene rescue of metabolic defects caused by loss of matrix attachment. Nature 461, 109–113 (2009). [DOI] [PMC free article] [PubMed] [Google Scholar]
- 13.Reczek CR & Chandel NS The Two Faces of Reactive Oxygen Species in Cancer. Annual Review of Cancer Biology 1, 79–98 (2017). [Google Scholar]
- 14.Vander Heiden MG & DeBerardinis RJ Understanding the Intersections between Metabolism and Cancer Biology. Cell 168, 657–669 (2017). [DOI] [PMC free article] [PubMed] [Google Scholar]
- 15.Sonveaux P et al. Targeting lactate-fueled respiration selectively kills hypoxic tumor cells in mice. J Clin Invest 118, 3930–3942 (2008). [DOI] [PMC free article] [PubMed] [Google Scholar]
- 16.Feron O Pyruvate into lactate and back: from the Warburg effect to symbiotic energy fuel exchange in cancer cells. Radiother Oncol 92, 329–333 (2009). [DOI] [PubMed] [Google Scholar]
- 17.Faubert B et al. Lactate Metabolism in Human Lung Tumors. Cell 171, 358–371 (2017). [DOI] [PMC free article] [PubMed] [Google Scholar]
- 18.Hui S et al. Glucose feeds the TCA cycle via circulating lactate. Nature 551, 115–118 (2017). [DOI] [PMC free article] [PubMed] [Google Scholar]
- 19.Halestrap AP Monocarboxylic acid transport. Compr Physiol 3, 1611–1643 (2013). [DOI] [PubMed] [Google Scholar]
- 20.Hong CS et al. MCT1 Modulates Cancer Cell Pyruvate Export and Growth of Tumors that Co-express MCT1 and MCT4. Cell Rep 14, 1590–1601 (2016). [DOI] [PMC free article] [PubMed] [Google Scholar]
- 21.Doherty JR et al. Blocking lactate export by inhibiting the Myc target MCT1 Disables glycolysis and glutathione synthesis. Cancer Res 74, 908–920 (2014). [DOI] [PMC free article] [PubMed] [Google Scholar]
- 22.Izumi H et al. Monocarboxylate transporters 1 and 4 are involved in the invasion activity of human lung cancer cells. Cancer Sci 102, 1007–1013 (2011). [DOI] [PubMed] [Google Scholar]
- 23.Payen VL et al. Monocarboxylate Transporter MCT1 Promotes Tumor Metastasis Independently of Its Activity as a Lactate Transporter. Cancer Res 77, 5591–5601 (2017). [DOI] [PubMed] [Google Scholar]
- 24.Quintana E et al. Human melanoma metastasis in NSG mice correlates with clinical outcome in patients. Sci Transl Med 4, 159ra149 (2012). [DOI] [PMC free article] [PubMed] [Google Scholar]
- 25.Chen YJ et al. Lactate metabolism is associated with mammalian mitochondria. Nat Chem Biol 12, 937–943 (2016). [DOI] [PMC free article] [PubMed] [Google Scholar]
- 26.Kirk P et al. CD147 is tightly associated with lactate transporters MCT1 and MCT4 and facilitates their cell surface expression. EMBO J 19, 3896–3904 (2000). [DOI] [PMC free article] [PubMed] [Google Scholar]
- 27.Pinheiro C et al. The metabolic microenvironment of melanomas: Prognostic value of MCT1 and MCT4. Cell Cycle 15, 1462–1470 (2016). [DOI] [PMC free article] [PubMed] [Google Scholar]
- 28.Curtis NJ et al. Pre-clinical pharmacology of AZD3965, a selective inhibitor of MCT1: DLBCL, NHL and Burkitt’s lymphoma anti-tumor activity. Oncotarget 8, 69219–69236 (2017). [DOI] [PMC free article] [PubMed] [Google Scholar]
- 29.Polanski R et al. Activity of the monocarboxylate transporter 1 inhibitor AZD3965 in small cell lung cancer. Clin Cancer Res 20, 926–937 (2014). [DOI] [PMC free article] [PubMed] [Google Scholar]
- 30.Meeth K, Wang JX, Micevic G, Damsky W & Bosenberg MW The YUMM lines: a series of congenic mouse melanoma cell lines with defined genetic alterations. Pigment Cell Melanoma Res 29, 590–597 (2016). [DOI] [PMC free article] [PubMed] [Google Scholar]
- 31.Guan X, Rodriguez-Cruz V & Morris ME Cellular Uptake of MCT1 Inhibitors AR-C155858 and AZD3965 and Their Effects on MCT-Mediated Transport of L-Lactate in Murine 4T1 Breast Tumor Cancer Cells. AAPS J 21, 13, (2019). [DOI] [PMC free article] [PubMed] [Google Scholar]
- 32.Baek G et al. MCT4 defines a glycolytic subtype of pancreatic cancer with poor prognosis and unique metabolic dependencies. Cell Rep 9, 2233–2249 (2014). [DOI] [PubMed] [Google Scholar]
- 33.Jang C, Chen L & Rabinowitz JD Metabolomics and Isotope Tracing. Cell 173, 822–837 (2018). [DOI] [PMC free article] [PubMed] [Google Scholar]
- 34.Kirkman HN & Hendrickson EM Glucose 6-phosphate dehydrogenase from human erythrocytes. II. Subactive states of the enzyme from normal persons. J Biol Chem 237, 2371–2376 (1962). [PubMed] [Google Scholar]
- 35.Andres V, Carreras J & Cusso R Regulation of muscle phosphofructokinase by physiological concentrations of bisphosphorylated hexoses: effect of alkalinization. Biochem Biophys Res Commun 172, 328–334 (1990). [DOI] [PubMed] [Google Scholar]
- 36.Ran FA et al. Genome engineering using the CRISPR-Cas9 system. Nat Protoc 8, 2281–2308 (2013). [DOI] [PMC free article] [PubMed] [Google Scholar]
- 37.Shi X et al. The abundance of metabolites related to protein methylation correlates with the metastatic capacity of human melanoma xenografts. Sci Adv 3, eaao5268 (2017). [DOI] [PMC free article] [PubMed] [Google Scholar]
- 38.Marin-Valencia I et al. Analysis of tumor metabolism reveals mitochondrial glucose oxidation in genetically diverse human glioblastomas in the mouse brain in vivo. Cell Metab 15, 827–837 (2012). [DOI] [PMC free article] [PubMed] [Google Scholar]
- 39.Yang C et al. Glutamine oxidation maintains the TCA cycle and cell survival during impaired mitochondrial pyruvate transport. Mol Cell 56, 414–424 (2014). [DOI] [PMC free article] [PubMed] [Google Scholar]
- 40.Tu BP et al. Cyclic changes in metabolic state during the life of a yeast cell. Proc Natl Acad Sci U S A 104, 16886–16891 (2007). [DOI] [PMC free article] [PubMed] [Google Scholar]
- 41.Su X, Lu W & Rabinowitz JD Metabolite Spectral Accuracy on Orbitraps. Anal Chem 89, 5940–5948 (2017). [DOI] [PMC free article] [PubMed] [Google Scholar]
- 42.Matsuyama S, Llopis J, Deveraux QL, Tsien RY & Reed JC Changes in intramitochondrial and cytosolic pH: early events that modulate caspase activation during apoptosis. Nat Cell Biol 2, 318–325 (2000). [DOI] [PubMed] [Google Scholar]
- 43.Noguchi K, Y. R. G., Brunner E, and Konietschke F. nparLD: an R software package for the nonparametric analysis of longitudinal data in factorial experiments. J. Stat. Softw 50, 1–23 (2012).25317082 [Google Scholar]
Associated Data
This section collects any data citations, data availability statements, or supplementary materials included in this article.
Supplementary Materials
Data Availability Statement
The Source Data files contain the numeric data for all figures and extended data figures. Data are available from the corresponding author upon request.


