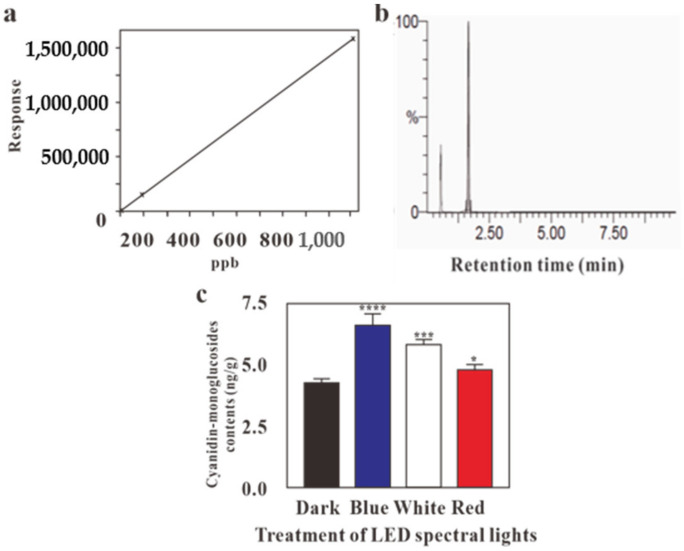
Figure 4.
LC-MS profile for the effect of LED lights for cyanidin-monoglucoside content in G. procumbens calli. (a) Calibration curve of cyanidin-monoglucoside, (b) peak of cyanidin-monoglucosides, (c) effect of LEDs on cyanidin-monoglucoside content. Values are means ± standard deviation (SD) from three replicates (n = 3). Ordinary one-way ANOVA followed by Dunnett’s multiple comparisons test were performed, where p < 0.05, p < 0.001, p < 0.0001, are represented as *, *** and ****, respectively.

