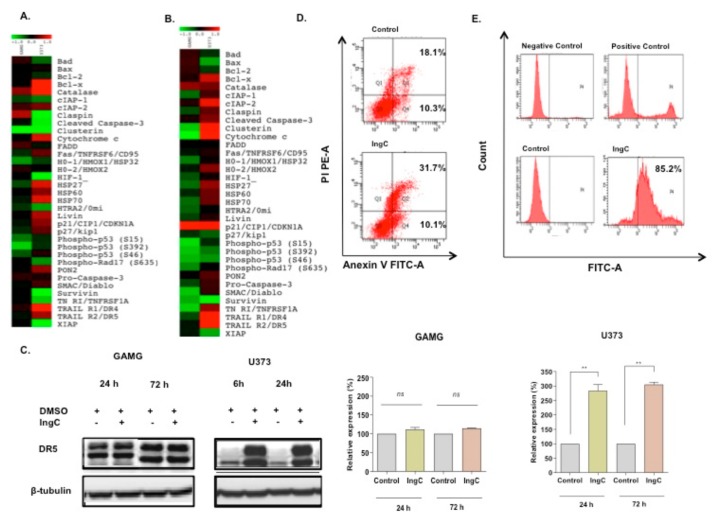
Figure 4.
Effect of IngC on apoptosis pathway on glioma cell lines. (A,B) Panel of 35 proteins related to apoptosis. The data represented by the heat maps show the proteins modulated after 24 and 72 h of IngC treatment (3X IC50 value (13.09 μM) in glioma cells, GAMG and U373. (C) Cells were treated with 3X IC50 concentrations of IngC (24 and 72 h) for the indicated time periods. GAMG and U373 cell lysates (20 μg per lane) were analyzed using immunoblotting with anti-DR5. The tubulin was used as an internal control to normalize the amount of proteins applied in each lane. This data is representative of three independent experiments. (D) After the IngC treatment with 3X IC50 for 72 h, U373 cells were fixed, stained with annexin V-FITC/PI and analyzed by FACScan. Data shown are representative of three independent experiments. (E) After IngC treatment with 3X IC50 for 72 h, DNA fragmentation in U373 cell line was measured with the TUNEL assay using flow cytometry. The graphs are representative of at least three independent experiments performed in duplicate. n.s. means non-significant. ** p < 0.005

