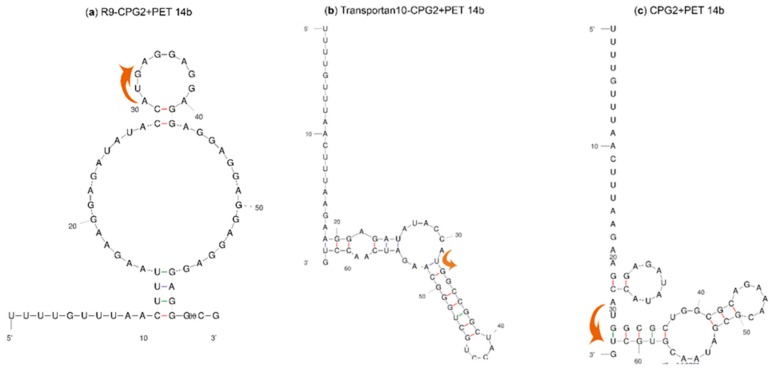
Figure 2.
mRNA initiation translation region secondary structures and location of the start codon (indicated by arrows) for two conjugates and CPG2. (a) “R9-CPG2 + PET 14b” has a higher ΔG value compared with CPG2 and the start codon is exposed (b) “Transportan 10-CPG2 + PET 14b” has a lower ΔG value compared with CPG2 and the start codon is not exposed. (c) Control CPG2 + PET 14b: start codon is not exposed.

