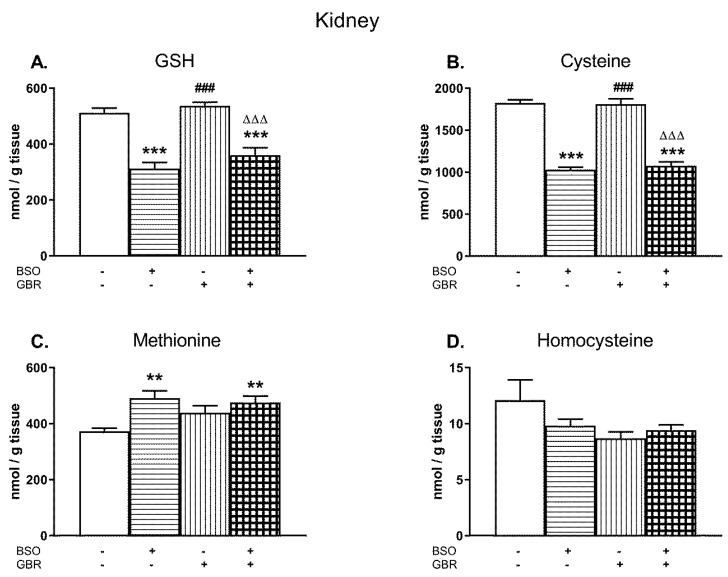
Figure 2.
The effects of chronic administration of BSO and GBR 12909, alone or in combination, on the levels of GSH (A), Cys (B), Met (C), and Hcy (D) in the kidney of 16-day-old rats. Data expressed in nmole/g of tissue are presented as the mean ± SEM, n = 7–8 for each group. Statistical analysis was performed using a two-way ANOVA; symbols indicate significance of differences according to the Newman–Keuls post-hoc test, **p < 0.01, ***p < 0.001 vs. control; ###p < 0.001 vs. BSO-; and ∆∆∆p < 0.001 vs. GBR 12909-treated groups.

