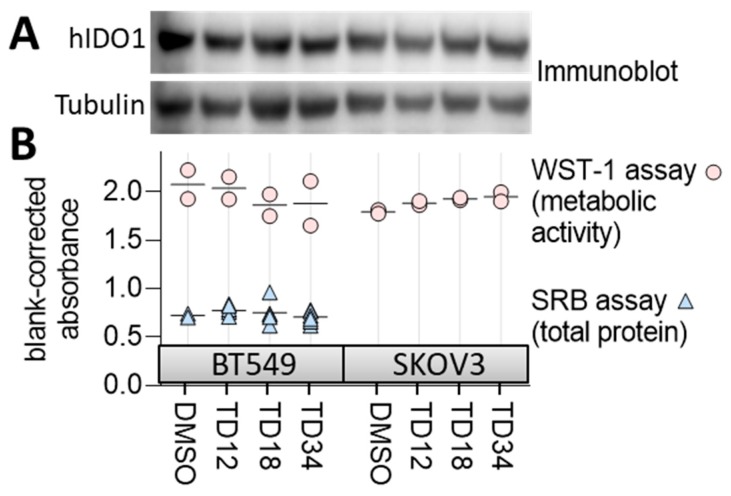
Figure 7.
Evaluating specificity and toxicity of the confirmed inhibitors. (A) Immunoblot for IDO1 expression in BT549 and SKOV3 lines treated with the inhibitors at 20 µM for 24 h. Tubulin represents a loading control. (B) The effect of 20 µM concentration of the inhibitors on cell viability measured by WST-1 assay and cell growth measured by SRB assay.

