

Abstract
Gastrointestinal (GI)‐related adverse events (AEs) are commonly observed in the clinic during cancer treatments. Citrulline is a potentially translatable biomarker of GI AEs. In this study, irinotecan‐induced citrulline changes were studied for a range of doses and schedules in rats. A translational system toxicology model for GI AEs using citrulline was then developed based on new experimental data and parameters from a literature intestinal cell dynamic model. With the addition of feedback‐development and tolerance‐development mechanisms, the model well captured the plasma citrulline profiles after irinotecan treatment in rats. Subsequently, the model was translated to humans and predicted the observed GI AE dynamics in humans including dose‐scheduling effect using the cytotoxic and feedback parameters estimated in rats with slight calibrations. This translational toxicology model could be used for other antineoplastic drugs to simulate various clinical dosing scenarios before human studies and mitigate potential GI AEs.
Study Highlights.
WHAT IS THE CURRENT KNOWLEDGE ON THE TOPIC?
☑ Gastrointestinal (GI)‐related adverse events (AEs) are often considered to be the dose‐limiting toxicity of anticancer treatments in humans. The severity of GI AEs can be managed by altering dosing schedules. It is time consuming to empirically test the optimal schedule.
WHAT QUESTION DID THIS STUDY ADDRESS?
☑ Can a translational quantitative system toxicology modeling approach be used to describe drug‐induced GI AEs in animals, predict the severity and duration of GI AEs in humans, and identify optimal dosing schedule?
WHAT DOES THIS STUDY ADD TO OUR KNOWLEDGE?
☑ This study uses citrulline, a GI AE biomarker, to build a quantitative system toxicology (QST) model of GI AEs. The developed model captured the observed plasma citrulline time profiles in rats. The translated model predicted the clinically observed GI AE dynamics and the dose‐scheduling effect of irinotecan using the parameters estimated in rats.
HOW MIGHT THIS CHANGE DRUG DISCOVERY, DEVELOPMENT, AND/OR THERAPEUTICS?
☑ This QST framework is a solid foundation for quantitative prediction and mitigation of GI AE risks in humans at the preclinical stage.
Gastrointestinal (GI)‐related adverse events (AEs) are commonly observed and are often considered the dose‐limiting toxicity for many cancer treatments in the clinic. Specifically, GI‐related toxicities, such as diarrhea and abdominal cramps, are major dose‐limiting safety concerns for cytotoxic chemotherapeutic agents, targeted cancer therapies such as tyrosine kinase inhibitors, and vascular endothelial growth factor inhibitors.1 In addition, GI AEs are also observed with the rapidly advancing immune checkpoint inhibitors including anticytotoxic T‐lymphocyte‐associated antigen 4, antiprogrammed cell death‐1, and their combination.2, 3 However, the molecular mechanism for immune checkpoint inhibitor‐induced GI toxicity could be quite different from those induced by chemotherapies. The incidence of chemotherapy‐induced diarrhea has been reported to be as high as 50–80%4 with up to 30% of patients exhibiting the severe and/or life‐threatening diarrhea.5 Therefore, predicting GI AEs in humans using preclinical data at drug discovery stage remains to be crucial. Quantitative translation of GI AEs from preclinical animal models has been quite challenging because of the large species difference in sensitivity and time scale to develop GI toxicity such as emesis and diarrhea. For example, rodents do not vomit and are more resistant to drug‐induced diarrhea, whereas dogs are highly sensitive to both emesis and diarrhea when compared with humans. No quantitative and translatable in vitro GI toxicity model is available beyond qualitative screening.6
Irinotecan (CPT‐11) is a camptothecin derivative that is widely used in the treatment of colorectal, pancreatic, and lung cancers. It is commonly used to study chemotherapy‐induced GI toxicity as it is known to induce dose‐limiting GI AEs in the clinic.7, 8 The irinotecan‐induced GI AEs are mechanistically attributed to the apoptosis of proliferative intestinal cells that causes villous atrophy as demonstrated in preclinical models.9 Irinotecan is generally considered as a prodrug because its metabolite SN‐38 (7‐ethyl‐10‐hydroxy‐camptothecin) inhibits topoisomerase‐I much more potently than irinotecan itself. SN‐38 induces irreversible DNA damage through the stabilization of the cleavable complex formed between topoisomerase‐I and DNA during replication.10, 11 Recently, a histopathology‐based translational system toxicology model was published for irinotecan‐induced GI AEs.12 This model systematically integrated previously published rat intestinal cell dynamics information with empirically obtained toxicokinetic (TK) and intestinal histopathology score as toxicodynamic (TD) readout in rats. The model was further translated to humans and successfully predicted the observed diarrhea scores in clinic. Although the histopathology score is a sensitive biomarker for GI toxicity in animal models, it is a subjective, variable, and resource‐intensive end point that is not routinely applicable to nonrodent species and humans.
The plasma level of citrulline is a potentially translatable biomarker for GI toxicity. Citrulline is an endogenous nonprotein amino acid. It is almost exclusively synthesized in the intestine, and diet is not a good source of citrulline.13 Therefore, plasma citrulline has been considered a biomarker of the functional small‐bowel enterocyte mass. From the preclinical studies, dose‐dependent decrease of plasma citrulline was observed and correlated well with GI toxicity observations in rats and dogs.6, 14 In the clinic, plasma citrulline has been used to monitor intestinal mucositis after chemotherapy and radiation therapy for cancer.15, 16 A normal adult has a mean citrulline plasma concentration of 40 μM.13 Citrulline levels of > 20 μM, from 10 to 20 μM, and < 10 μM indicate partial atrophy, subtotal villous atrophy, and total villous atrophy, respectively.17 Currently, quantitative translational relevance of plasma citrulline as a safety biomarker of GI AEs has not been fully investigated yet.
In the present study, a translational system toxicology model was established for irinotecan‐induced GI AEs using plasma citrulline as a TD biomarker to develop a framework to quantitatively predict and mitigate the risk of GI AEs in the clinic from preclinical data. The experimentally obtained TK and plasma citrulline time profiles after irinotecan treatment in rats were integrated into the system toxicology model. Because both TK and plasma citrulline can be serially measured from the same individual animal, population model analysis was also performed to take the individual TK/TD relationship and interindividual variability (IIV) into account. Lastly, by replacing the rat pharmacokinetics (PK) and intestinal cell dynamics parameters with the human values, the translatability of the system toxicology model was evaluated by comparing the model prediction to clinically observed GI AEs after irinotecan treatment under different dosing schedules.
Materials and Methods
In vivo rat experiments
Irinotecan‐induced GI toxicity in rats was evaluated under both single‐dose and multiple‐dose scenarios. Irinotecan (CPT‐11) was formulated in 5% dextrose and dosed intraperitonially at 12.5, 25, 50, or 100 mg/kg on day 1 (single dose) to Sprague‐Dawley rats (n = 3). In multiple‐dose scenarios, irinotecan was dosed at 6.25 or 25 mg/kg on day 1 and 4 (twice a week, BIW) or 1.8 or 7.2 mg/kg daily for 7 days (once daily, QD). For TK evaluation, blood samples were serially taken at 0.5, 1, 3, 7, and 24 hours after drug administration on day 1. In the multiple‐dose groups, additional blood samples were taken on day 4 at predose, 0.5, 1, 3, 7, and 24 hours after dose. For TD evaluation, blood samples were serially taken at predose, 7 hours on day 1, and days 2, 3, 4, 5, 6, 7, 8, 9, 11, 13, and 15, and 17 days after start of dosing. This study was run under a protocol approved by the Institutional Animal Care and Use Committee at Takeda Pharmaceutical International. After plasma samples were separated by centrifugation, the mixture of phenylmethylsulfonyl fluoride and acetic acid were added to stabilize the TK samples. The stored plasma samples were analyzed for irinotecan and SN‐38 for TK and citrulline for TD, respectively, by liquid chromatography–tandem mass spectrometry, which were slightly modified from the previously published bioanalytical methods.18, 19
System toxicology model analysis in rats
The system toxicology model in rats was developed by building on the previously published intestinal cell dynamics model12 with TK models of irinotecan and SN‐38 as well as a turnover model for plasma citrulline dynamics. Figure 1 summarizes the schematic description of the cell dynamics at intestinal crypt‐villus region (Figure 1 a) and the system toxicology model structure for irinotecan‐induced GI AEs using plasma citrulline as a TD biomarker (Figure 1 b). The detailed schematic TK/PK models are found in Figure S1 . The series of differential equations for the full‐system toxicology model and its model code are found in the Supplementary Information. The TK model was developed with compartment models including systemic and presystemic saturation of SN‐38 formation from irinotecan. The intestinal cell dynamics model consists of a series of transit compartments that describe the cell division of stem cells located at the intestinal crypt and differentiation to proliferative progenitor cells, followed by a further four steps of cell division and differentiation into matured enterocytes. The matured enterocytes then go through another set of transit compartments that describe the migration from the base to the tip of intestinal villa, followed by the cell shedding from the tip. Because cytotoxic activity of SN‐38 is 100‐fold to 1,000‐fold more potent than irinotecan,20 it was assumed that the drug‐induced cytotoxicity was exerted solely by SN‐38 on proliferative crypt cells, including stem cells and proliferative progenitor cells. The turnover of plasma citrulline was modeled by an indirect response model with zero‐order generation of citrulline, which was dependent on the residual fraction of matured enterocytes, followed by first‐order elimination. To better capture the observed plasma citrulline time profiles, the following modifications were incorporated: (i) a feedback mechanism, (ii) over the concentration‐proportional cytotoxicity, and (iii) tolerance against cytotoxicity developed after multiple doses. The overshoot recovery of plasma citrulline was described by the feedback mechanism (eq. 19 in the Supplementary Information). The concept is that the rate of stem‐cell generation is accelerated to enhance villous recovery when enterocytes get damaged. This is a similar concept to the published semimechanistic model of neutropenia.21 More than concentration‐proportional cytotoxicity was described by introduction of the Hill coefficient into the residual fraction of proliferative cells, which represented the increased sensitivity to SN‐38–induced cytotoxicity when the residual fraction of proliferative cells decreased (eqs. 8 to 12 in the Supplementary Information). The tolerance development after multiple doses was modeled with the hypothetical inhibitory metabolite framework where an inhibitory metabolite was formed from SN‐38 and neutralized the cytotoxic effect with a time lag described by transit compartments (eqs. 18 and 22 to 25 in the Supplementary information). The system toxicology model was developed with 21 compartments and 32 parameters (27 fixed effects and five random effects).
Figure 1.
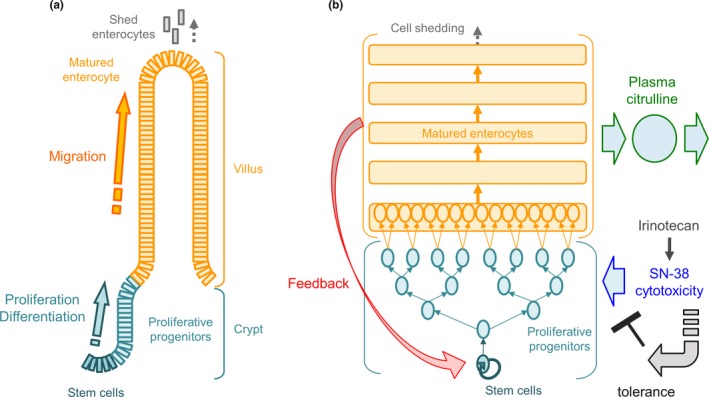
Schematic description of the model structure (a) cell dynamics at intestinal crypt‐villus region and (b) system toxicology model structure for irinotecan‐induced gastrointestinal (GI)‐related adverse events (AEs) using plasma citrulline as a toxicodynamic biomarker. The system toxicology model mathematically captures the physiobiological cell dynamics at intestinal crypt‐villus region where the stem cells at the bottom of crypt proliferate and differentiate into proliferative progenitor cells followed by further differentiation into matured enterocytes that produce circulating citrulline. The matured enterocyte migrates from the bottom to the tip of villus and subsequently shed off from the tip. SN‐38 formed from irinotecan exerts cytotoxicity on the proliferative cells (the stem cells and proliferative progenitors) and feedback mechanism affects proliferation rate of the stem cell depending on the residual enterocytes fraction. The tolerance development to SN‐38 induced cytotoxicity is captured by hypothetical inhibitory metabolism framework with time delay described by transit compartments.
The system toxicology model development was performed sequentially. First, the TK model of irinotecan was developed and connected with that of SN‐38. After all the TK model parameters were fixed, the model was integrated with the intestinal cell dynamics and plasma citrulline turnover model. The system‐related parameters for intestinal cell dynamics and citrulline turnover were fixed to the literature‐reported values.12, 22 The population analysis was performed, and the final IIV on TK parameters and their covariance were estimated by simultaneous fitting of observed TK of irinotecan and SN‐38 with fixing the population mean for the TK parameters of irinotecan (Table 1). The estimated individual TK parameters were used for subsequent system toxicology model analysis to take individual TK/TD relationship into account. IIVs were assumed to follow log‐normal distribution. The parameter estimation was performed using NONMEM VI (ICON Development Solutions, San Antonio, TX) by means of first‐order conditional estimation method with interaction. The convergence criterion was three significant digits. A Compaq Digital Fortran Version 6.1 compiler (Compaq Computer Corporation, Houston, TX) was used to execute NONMEM. The proportional error model was used to estimate residual variability for both TK and plasma citrulline. Model selection was based on the visual inspection of goodness of fit, the precision of parameter estimates, and the value of the objective function. Simulations for the developed system toxicology model was performed using Berkeley Madonna version 8.3.18 (University of California, Berkeley, CA). The parameter sensitivity analysis was performed using the Simbiology toolbox of MATLAB R2017a (Mathworks, Natick, MA). The time‐dependent sensitivity indices on plasma citrulline were calculated with the full dedimensionalization option and then integrated throughout the time course.
Table 1.
The estimated population system toxicology model parameters for irinotecan‐induced gastrointestinal‐related adverse events using plasma citrulline as a TD biomarker in rats
| Category | Parameter | Unit | Definition | Value | % RSE |
|---|---|---|---|---|---|
|
Irinotecan TK |
Vmax | nmol/hour/kg | Maximum rate of conversion from irinotecan to SN‐38 | 20.6 | 23.3 |
| km | nM | Concentration of half maximum rate of conversion from irinotecan to SN‐38 | 91.5 | 26.4 | |
| CL | L/hour/kg | Nonsaturable clearance of irinotecan | 0.178 | 14.2 | |
| V1 | L/kg | Central volume of irinotecan | 0.499 | 14.2 | |
| Q | L/hour/kg | Intercompartmental clearance of irinotecan | 0.0614 | 16.6 | |
| V4 | L/kg | Peripheral volume of irinotecan | 0.229 | 14.2 | |
| ka | 1/hour | Absorption rate constant of irinotecan | 10 | NA | |
| Dmaxp | mg/kg | Coefficient for maximum irinotecan loss during absorption | 430 | 20.0 | |
| Dmp | mg/kg | Dose of half maximum irinotecan loss during absorption | 458 | 19.1 | |
| IIV on Dmaxp | Exponential interindividual variability on Dmaxp | 0.000141 | 55.1 | ||
| IIV on Vmax | Exponential interindividual variability on Vmax | 0.199 | 36.8 | ||
| Residual error | Proportional residual error | 0.038 | 15.7 | ||
|
SN‐38 TK |
CLm | L/hour/kg | Clearance of SN‐38 | 0.464 | 4.6 |
| Vm | L/kg | Volume of SN‐38 | 0.01 | NA | |
| fm,lin | — | Fraction of non‐saturable clearance of irinotecan to convert SN‐38 | 0.00275 | 19.5 | |
| kam | 1/hour | Absorption rate constant of SN‐38 | 1.47 | 18.0 | |
| Dmaxm | mg/kg | Coefficient for absorption of SN‐38 | 0.021 | 21.2 | |
| Dmm | mg/kg | Dose of half maximum absorption of SN‐38 | 4.16 | 38.5 | |
| IIV on Dmaxp | Exponential interindividual variability on Dmaxp | 0.000121 | 47.4 | ||
| IIV on Vmax | Exponential interindividual variability on Vmax | 0.195 | 33.2 | ||
| IIV on CLm | Exponential interindividual variability on CLm | 0.0706 | 45.2 | ||
| Cov between Vmax and CLm | Covariance between Vmax and CLm | 0.103 | 40.9 | ||
| Residual error | Proportional residual error | 0.0511 | 12.3 | ||
| TD | SCss | Cells | Number of stem cell in each crypt | 10 | NA |
| k1 | 1/day | Stem cell doubling rate | 1.5 | NA | |
| k2 | 1/day | Proliferative progenitor doubling rate | 2 | NA | |
| k3 | 1/day | Enterocyte shedding rate | 2.25 | NA | |
| CV | Crypt/villus | Number of crypts feeding each villus | 7 | NA | |
| nPPC | — | Number of transit compartments for proliferative progenitor cells | 4 | NA | |
| kkill | 1/day/μM | Cytotoxic rate by SN‐38 | 12.6 | 5.3 | |
| γ | — | feedback Parameter to stem cells | 0.602 | 30.6 | |
| hill | — | Hill coefficient on fraction of residual proliferative cells for cytotoxicity | 1 | NA | |
| BL | nM | Baseline of plasma citrulline | 90,100 | 1.4 | |
| kout | 1/day | Elimination rate constant of plasma citrulline | 8.52 | NA | |
| kt | 1/day | transit rate Constant for adaptation development | 0.256 | NA | |
| tol | 1/μM | Coefficient for adaptation | 34,400 | NA | |
| IIV on BL | exponential interindividual variability on BL | 0.0119 | 60.0 | ||
| Residual error | Proportional residual error | 0.028 | 17.9 | ||
IIV, interindividual variability; NA, not applicable; RSE, relative standard error; TD, toxicodynamic; TK, toxicokinetic.
Translation of the system toxicology model to humans and its application to predict observed GI AEs in humans
The translation of the system toxicology model from rats to humans was made with the several steps. First, the TK model for irinotecan and SN‐38 in rats was replaced by the published human PK model.23 Second, the intestinal cell dynamics and citrulline turnover models were translated from rats to humans according to the previously published literature.12, 24 The cytotoxic parameter of SN‐38 estimated in rats was then corrected by species‐specific plasma protein binding. Lastly, the translated model was calibrated against the published enterocyte villus area observed after chemotherapy treatment.25 The cytotoxic (kkill) and feedback (γ) parameters were modified during rat to human translation. The literature suggested that human colorectal tumor cell line was more sensitive to irinotecan than that from rodent.26 However, no quantitative information is available on the numerical differences. Thus, the kkill parameter was fitted with the human data. The final fitted human parameter value was 11.0 1/day/μM compared with the 12.6 1/day/μM in rats. For the feedback parameter γ, it is known in the literature that human enterocytes proliferate at roughly half of the speed of rat enterocytes (Tables 1 and 2). Thus, we expected less hyperplasia and less feedback in humans. As a result of the limited data especially around recovery to baseline, γ could not be precisely estimated in humans. Thus, a twofold correction factor was applied to the rat parameter to obtain the human parameter (rat γ = 0.602; human γ = 0.301).
Table 2.
The translated system toxicology model parameters for irinotecan‐induced gastrointestinal‐related adverse events using plasma citrulline as a TD biomarker in humans
| Parameter | Unit | Definition | Value (% RSE) |
|---|---|---|---|
| ke | 1/hour | Conversion rate constant from irinotecan to SN‐38 | 4.56 |
| V1 | L | Central volume of irinotecan | 5.52 |
| k12 | 1/hour | Rate constant from central to peripheral 1 of irinotecan | 57.8 |
| k21 | 1/hour | Rate constant from peripheral 1 to central of irinotecan | 2.58 |
| k13 | 1/hour | Rate constant from central to peripheral 2 of irinotecan | 1.96 |
| k31 | 1/hour | Rate constant from peripheral 2 to central of irinotecan | 0.0812 |
| kem | 1/hour | Elimination rate constant of SN‐38 | 2.52 |
| Vm | L | Central volume of SN‐38 | 200 |
| mk12 | 1/hour | Rate constant from central to peripheral 1 of SN‐38 | 2.6 |
| mk21 | 1/hour | Rate constant from peripheral 1 to central of SN‐38 | 0.0584 |
| SCss | Cells | Number of stem cell in each crypt | 10 |
| k1 | 1/day | Stem cell doubling rate | 0.333 |
| k2 | 1/day | Proliferative progenitor doubling rate | 0.75 |
| k3 | 1/day | Enterocyte shedding rate | 1.25 |
| CV | crypt/villus | Number of crypts feeding to each villus | 7 |
| nPPC | — | Number of transit compartments for proliferative progenitor cells | 5 |
| kkill | 1/day/μM | Cytotoxic rate by SN‐38 | 11.0 (0.0328) |
| γ | — | Feedback parameter to stem cells | 0.301 |
| hill | — | Hill coefficient on fraction of residual proliferative cells for cytotoxicity | 1 |
| BL | nM | Baseline of plasma citrulline | 40,000 |
| kout | 1/day | Elimination rate constant of plasma citrulline | 18.6 |
Human pharmacokinetic parameters were obtained from literature.23
RSE, relative standard error; TD, toxicodynamic.
The calibrated human system toxicology model was applied to irinotecan treatment at 125 mg/m2 once weekly 4 weeks on/2 weeks off schedule and then compared with the observed occurrence of diarrhea in humans.12 The model was further employed to simulate two distinct dose schedules (350 mg/m2 once every 3 weeks (Q3W) and 175 mg/m2 on days 1 and 10 every 3 weeks (BI3W)) and compared with the reported overall clinical observation of GI AEs.27
Results
TK model analysis in rats
The population system toxicology model analysis in rats was performed sequentially. First, the TK model for irinotecan and SN‐38 was built with the saturation of systemic and presystemic formation of SN‐38 from irinotecan. The overlay of model‐simulated and observed plasma concentration of irinotecan and SN‐38 after single and multiple administrations of irinotecan in rats are shown in Figure 2. The visual predictive check plots with 90% variability ranges are depicted in Figure S2 . The TK model parameters estimated are shown in Table 1. The observed TK time profiles of irinotecan and SN‐38 in rats showed severe nonlinearity with respect to dose, which has been characterized by the saturation of carboxyesterase (CES).28 Because CES is expressed in rat GI and contributes to the first‐pass hydrolysis,29 dose‐dependent saturation of CES were likely responsible for the observed over dose‐proportional TK of irinotecan and its corresponding saturation of SN‐38. The model could reasonably capture the observed TK time profiles after single and multiple doses of irinotecan with the wide‐dose range. No obvious difference was observed between single and multiple doses for TK of both irinotecan or SN‐38. Random effects were assigned to parameters for maximum rate of conversion from irinotecan to SN‐38 (Vmax), coefficient of maximum irinotecan loss during absorption (Dmaxp), and clearance of SN‐38 (CLm) to best describe the observed IIV. The inclusion of covariance between Vmax and CLm significantly improved the objective function, suggesting a positive correlation between the metabolizing enzymes of irinotecan and SN‐38, which are CES and uridine 5'‐diphospho‐glucuronosyltransferase (UGT), respectively. The scatter plot on the TK model parameters with random effects and dose is shown in Figure S3 . No parameter showed obvious dose dependency or correlation between parameters except for Vmax and CLm.
Figure 2.
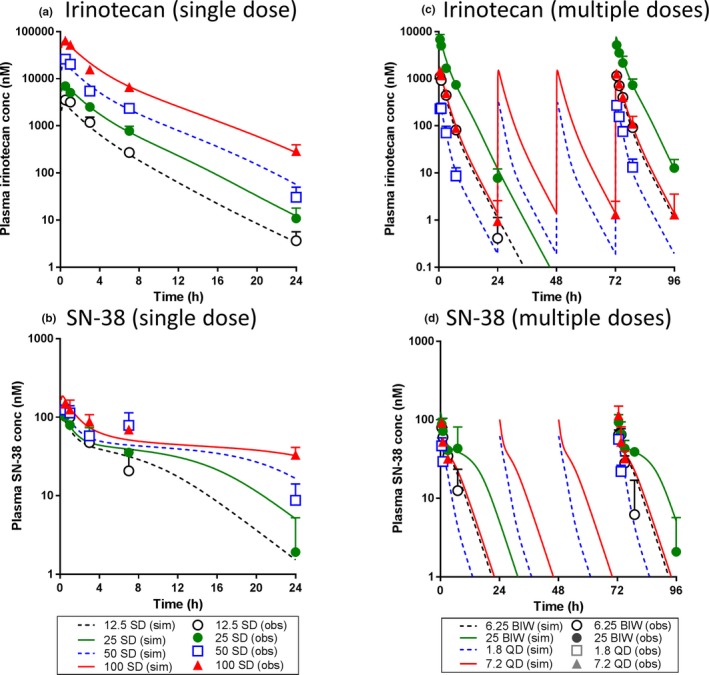
The population toxicokinetic model analysis of irinotecan and SN‐38 after irinotecan treatment in rats. The observed and model‐simulated plasma concentration‐time profiles were plotted for irinotecan and SN‐38 after single (12.5, 25, 50, or 100 mg/kg) and multiple (6.25 or 25 mg/kg in twice a week (BIW) and 1.8 or 7.2 mg/kg in once daily (QD) dosing schedules) administrations of irinotecan in rats. (a) irinotecan and (b) SN‐38 after single dose and (c) irinotecan and (d) SN‐38 after multiple doses. In each panel, symbols, error bars and lines represent the mean observed data (n = 3), standard deviation and the model predicted population mean, respectively. obs, observed; sim, simulated; SD, single dose.
System toxicology model analysis in rats
After fixing the individual TK parameters, the model was connected to the intestinal cell dynamics and citrulline turnover models to form a system toxicology model. The overlay of model‐simulated and observed plasma concentration time profiles of citrulline after single and multiple administrations of irinotecan are shown in Figure 3. The model parameters estimated are shown in Table 1. The overshoot recovery of plasma citrulline was well described by the feedback mechanism. The observed more than concentration‐proportional cytotoxicity was captured by the introduction of Hill coefficient on the residual fraction of proliferative cells. This model significantly improved the goodness of fit compared with the linear cytotoxicity model (decrease in objective function: > 14.8). However, when applying the model established for single‐dose to multiple‐dose scenarios, the simulated plasma citrulline level were much lower than observed, indicating the simulated GI toxicity was more severe than observed. This was not the result of time‐dependent changes in TK (Figure 2). Rather, it was likely the result of tolerance development in rats. A hypothetical inhibitory metabolite framework could well describe the observed citrulline profiles after both single and multiple doses (Figure S4 ). The IIV was reasonably captured by a random effect on baseline of plasma citrulline on the top of IIV for TK parameters.
Figure 3.
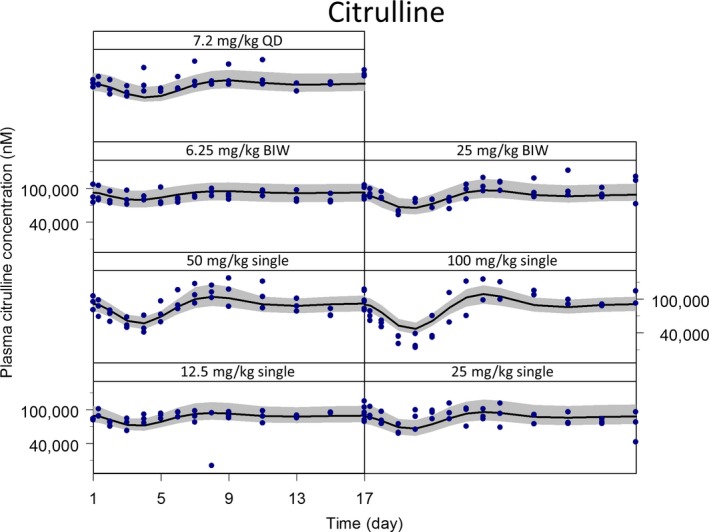
The population system toxicology model analysis of plasma citrulline after treatment of irinotecan in rats. The observed and model‐simulated concentration‐time profiles were plotted for plasma citrulline after single (12.5, 25, 50, or 100 mg/kg) and multiple (6.25 or 25 mg/kg in twice a week (BIW) and 7.2 mg/kg in once daily (QD) dose schedules) administrations of irinotecan in rats. In each panel, circles, a line, and a shaded area represent the observed data (n = 3), the model‐predicted population mean and the 90 percentiles of individual model predicts, respectively, from the visual predictive check analyses.
A parameter sensitivity analysis was performed to identify the model parameter(s) that affects the plasma citrulline time profile. The result is shown in Figure S5 . The negative sensitivity indices indicated that the increase in parameter led to decreased plasma citrulline. The parameters most sensitive were bioavailability‐related parameters of irinotecan (coefficient of maximum irinotecan loss during absorption (Dmaxp)and dose of half maximum irinotecan loss during absorption (Dmp)) followed by cytotoxicity of SN‐38 (kkill) and then clearance parameters for either SN‐38 (CLm) or irinotecan (Vmax).
Translation of the system toxicology model to humans to evaluate its predictability of GI AEs in the clinic
The established system toxicology model in rats was translated to humans and calibrated against the published human villus area data.25 The overlay of observed villus area loss and calibrated model‐simulated percent enterocyte loss and citrulline change are shown in Figure 4 a. The simulated enterocyte loss and citrulline change profiles were quite similar because the reported plasma citrulline half‐life is rapid enough (0.65–1.14 hours)24 compared with intestinal cell dynamics. The calibrated model adequately captured the observed villus area loss with only minor calibrations (less than twofold) on the two parameters (kkill and γ) estimated in rats. The translated and calibrated model was subsequently applied to a multiple‐dose scenario (125 mg/m2, once weekly, 4 weeks on/2 weeks off as a 90‐minute infusion). The model‐simulated citrulline change was compared with the observed occurrence of diarrhea (≥grade 3 or all grades) in clinic as shown in Figure 4 b. It was found that the occurrence of diarrhea highly corresponded to the model‐simulated citrulline change, particularly when the citrulline change was beyond −30%. The translated model was further applied to different dosing schedules: Q3W and BI3W. The model‐simulated citrulline changes are depicted in Figure 5 a, and the percent of cycle time when citrulline change was beyond threshold (−30%) was shown in Figure 5 b. The simulation indicated that although the peak of citrulline change was larger (more citrulline reduction) in the Q3W dosing schedule, the percent of cycle time beyond the threshold was longer in the BI3W schedule. According to the reported clinical observation, the occurrence of ≥grade 3 diarrhea is significantly higher in the BI3W schedule while efficacy in both dosing regimens were similar,27 suggesting that the duration of citrulline change, but not the peak, is the better predictor of GI AEs in humans. These findings were consistent with those of Shankaran et al. 12 As shown previously, the established plasma citrulline‐based translational system toxicology model was able to quantitatively predict the time profiles of irinotecan‐induced GI AEs and its dose scheduling effect observed in clinic.
Figure 4.
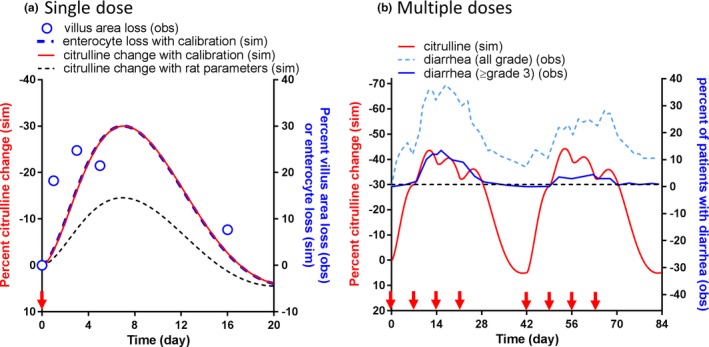
The translation and verification of the system toxicology model for irinotecan‐induced gastrointestinal (GI)‐related adverse events (AEs) in humans. (a) The translated model‐simulated percent citrulline change‐time profile after a single administration of irinotecan at 125 mg/m2 were compared with the observed villus area loss measured by duodenal biopsies from patients receiving cancer chemotherapy.25 Circles, black dash line, and red solid line represent the observed mean villus area loss and the model‐simulated percent citrulline change with the parameters estimated in rats and that with slight parameter calibrations on cytotoxicity and feedback (within twofold change). (b) The comparison of calibrated model‐simulated percent citrulline change‐time profile after irinotecan treatment at 125 mg/m2 once a week and 4 weeks on and 2 weeks off dose schedule as a 90‐minute infusion (red solid line) and the observed fraction of patients with all grade diarrhea (dot light blue line) and ≥grade 3 diarrhea (solid blue line). A threshold (−30%) was derived for the model‐simulated citrulline change; when the model‐simulated citrulline change was above the threshold, the observed percent of patients with diarrhea was particularly high. The red arrows on the x‐axis represent dose timing. obs, observed; sim, simulated.
Figure 5.
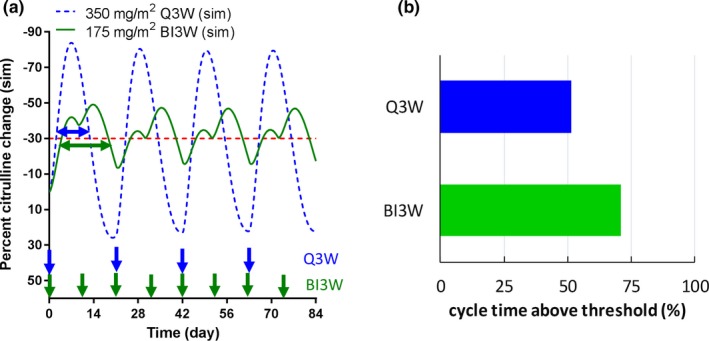
The application of translated system toxicology model to dose‐scheduling effects of irinotecan induced gastrointestinal (GI)‐related adverse events (AEs) in humans. (a) The comparison of model‐simulated percent citrulline change‐time profiles after either 350 mg/m2 as once a 3 weeks (Q3W; dash blue line) or 175 mg/m2 on day 1 and day 10 in every 3‐week cycle (BI3W; solid green line) as a 90‐minute infusion in humans. The blue and green arrows on the x‐axis represent dose timing for Q3W and BI3W, respectively. (b) The calculated percent cycle time when the model‐simulated percent citrulline change was above the threshold (−30%) after irinotecan treatment with either 350 mg/m2 Q3W or 175 mg/m2 BI3W dose schedule in humans. sim, simulated.
Discussion
Model advancements using plasma citrulline as a safety biomarker of GI AEs
In this study, a system toxicology model for GI AEs was developed using plasma citrulline as a quantitative TD biomarker for GI AEs. Plasma citrulline has been proposed as a noninvasive, sensitive, specific, and serially measurable safety biomarker for GI AEs, and it is applicable to humans.17 Because the histopathological evaluation was not empirically performed in our rat study, the plasma citrulline change observed in our study was compared with the enterocyte loss simulated by the model of Shankaran et al., which employed the histopathology scores as GI toxicity readouts.12 These two outputs were comparable at low to medium dose levels (up to 50 mg/kg) after normalized by SN‐38 exposure, indicating that the plasma citrulline is a histopathologically relevant biomarker for GI toxicity in rats. This finding is also supported by the literature from other groups where plasma citrulline appeared to correlate well the with histopathology findings in rats14 and dogs.6
A few important features were observed using plasma citrulline as a TD biomarker that could not be quantitatively captured by categorical histopathology scores: (i) the overshoot recovery, which was consistent with the reported overshoot recovery of villous cells after cytosine arabinoside treatment in mice30 and hyperplastic response of the small bowel after partial intestinal resection in rats,31 although the molecular mechanism has not been fully elucidated; (ii) more than concentration‐proportional cytotoxic effects after irinotecan treatment in rats (Figure 3); and (iii) the tolerance development observed after multiple doses, which was not tested previously by Shankaran et al. (Figure S4 ). These features were successfully captured by the model advancements as described in the Materials and Methods section in detail.
Another advantage of plasma citrulline is the application of population‐based pharmacometric approaches. As the result of the parameter sensitivity analysis, the plasma citrulline profile was found to be sensitive to both TK‐related and TD‐related parameters (Figure S5 ). Therefore, more precise population model analyses could be performed with taking individual TK/TD relationships and their IIV into account, which is not feasible with histopathological readouts. The population model could then be applied to individualize dose and dosing schedule to maximize efficacy and minimize side effects in the clinic. Moreover, the population model‐based approaches would be particularly useful for a drug such as irinotecan because the polymorphism of UGT1A1, which is the major eliminating enzyme of SN‐38, could cause the interindividual PK variability, which affects both efficacy and safety in the clinic. This can be easily incorporated as a covariate in the population model.
Limitations of plasma citrulline as a biomarker of GI AEs
There are a few caveats to note when employing plasma citrulline as a TD biomarker of GI AEs. Approximately 80% of circulating citrulline is converted to arginine by arginase in the kidney.17 Therefore, any alteration of kidney arginase would alter the plasma citrulline profiles without any GI toxicity, and the monitoring of arginase activity and kidney function (e.g., estimated glomerular filtration rate (eGFR) and kidney injury molecule‐1 (KIM‐1)) is worth considering. In our rat study, tolerance‐like phenomena was observed where actual plasma citrulline levels after multiple doses were higher than the simulated levels from the single‐dose model. Although a functional kidney biomarker was not measured in this study, it was unlikely that this observation was the result of reduced renal citrulline elimination because simulations with reduced citrulline elimination suggested that the citrulline baseline would be modulated even after a single dose, which did not match the empirical observations.
Another point to note is that plasma citrulline may not be a biomarker representing other types of GI AEs. For example, it is reported that epidermal growth factor receptor tyrosine kinase inhibitors showed no significant pathological damage in rat intestines despite rats displaying a dose‐dependent diarrhea that was consistent with clinical observation.32 The clear mechanism remains to be elucidated, but one of the hypotheses is that epidermal growth factor receptor is a negative regulator of chloride secretion in the intestines and its blocking causes secretory diarrhea.33 Crohn's disease involves inflammation of all layers of the intestinal wall. Recent studies suggested that the plasma citrulline level is not a marker of Crohn's disease activity.34, 35 Therefore, plasma citrulline may not be a good biomarker for inflammatory GI AEs induced by immune‐checkpoint inhibitors as well. To address these types of GI AEs, a different set of model structures and assumptions would be required and aligned with a plausible mechanism behind them. Nevertheless, the present translational system toxicology model could be a good starting point with the translational biophysiological understanding of intestinal cell dynamics.
Translation to humans and model‐informed schedule selection
The developed system toxicology model in rats was successfully translated to humans and predicted the clinically observed incidence of irinotecan‐induced GI AEs well (Figure 4) and its dose‐scheduling effect (Figure 5) with only minor calibrations to the cytotoxic and feedback parameters estimated in rats. On the other hand, the tolerance to GI toxicity, which was well described by the hypothetical neutralizing metabolism framework, was not applicable to the model translation to humans. A possible reason of this translational disconnect was the overestimation of tolerance development in rats. To precisely estimate the magnitude and duration of tolerance development, an additional study specifically designed to capture both development and recovery kinetics of tolerance would be required in parallel with the elucidation of mechanism behind the tolerance. Interestingly, the occurrence of diarrhea seems to be less frequent after multiple treatment cycles in humans, suggesting the possibility of developing tolerance.12 The quantitative translation of this tolerance mechanism would be a topic for future investigation.
Currently, plasma citrulline profiles in humans were not available after irinotecan treatments to the best knowledge of the authors. Those data would help characterize the system‐related feedback parameters in humans followed by the further verification of quantitative translational relevance of plasma citrulline as a safety biomarker. Although a significant amount of uncertainty remains to be quantitatively characterized, the citrulline‐to‐citrulline translation from animals to humans would provide a novel means to translationally address this important but not yet resolved safety concern in clinic. Furthermore, the better understanding of clinical GI AEs would facilitate the discovery and development of in vitro systems such as GI organoid and three demensional organ or organ‐on‐a‐chip technology, which can be used to adjust a species difference in sensitivity to cytotoxicity and ultimately enable in vitro to in vivo extrapolation with skipping the resource‐intensive characterization in animals.
Historically, the GI AEs have been mitigated through the empirical exploration of dose levels and schedules in clinical studies. Therefore, as was demonstrated in the present study, the translational system toxicology model is quite useful to quantitatively predict and mitigate the risk of GI AEs by simulating mitigative dose levels and/or schedules using preclinical data. Moreover, if a model‐based quantitative framework is available for pharmacodynamics efficacy, a comprehensive model analysis could be performed to explore a dose regimen that could maximize pharmacodynamics/efficacy and minimize the safety concern at the same time, thus expand the therapeutic index. In fact, Shankaran et al. 12 has proposed untested dose schedules for irinotecan by taking advantage of the differences in the drivers of efficacy and toxicity. Irinotecan's efficacy is driven by dose density in a dose cycle that is independent of dose schedule. In contrast, irinotecan‐induced GI AEs are determined by the duration of enterocyte damage (i.e., time above threshold). A similar approach has been taken for the management of neutropenia, where the model‐informed dose‐schedule optimization has been adopted for labeling recommendation by the US Food and Drug Administration.36
Conclusions
In conclusion, a translational quantitative system toxicology model for GI AEs was developed by using plasma citrulline as a safety biomarker. The developed model reasonably captured the plasma citrulline time profiles in rats with a feedback mechanism to the stem cells more than concentration‐proportional cytotoxicity as well as tolerance development incorporated into the model. The translated model also successfully predicted the clinically observed GI AEs dynamics and the dose scheduling effect of irinotecan. We hope that this translational modeling framework could be a good foundation for other oncology drugs to quantitatively predict the risk of GI AEs in humans from the preclinical stage and translationally simulating various clinical dosing scenarios to mitigate the GI AEs, which ultimately maximizes the benefit of patients.
Funding
This research was sponsored by Takeda Pharmaceuticals International Co.
Conflict of Interest
The authors are employed by Takeda Pharmaceuticals International Co. The authors declare no additional conflict of interest.
Author Contributions
T.Y. and A.Z.X.Z. wrote the manuscript. T.Y., K.A.‐H., A.B., and E.G. designed and performed the research. T.Y., M.W., and A.Z.X.Z. analyzed the data.
Supporting information
Figure S1. Schematic description of the pharmacokinetic models.
Figure S2. Visual predictive check analyses for population toxicokinetic model analysis.
Figure S3. Scattered plots of individual system toxicology model parameters and dose.
Figure S4. The incorporation of tolerance development improved the goodness of fit.
Figure S5. Sensitivity analysis for system toxicology model.
References
- 1. Pusztaszeri, M.P. , Genta, R.M. & Cryer, B.L. Drug‐induced injury in the gastrointestinal tract: clinical and pathologic considerations. Nat. Clin. Pract. Gastroenterol. Hepatol. 4, 442–453 (2007). [DOI] [PubMed] [Google Scholar]
- 2. Selby, M.J. et al. Preclinical development of ipilimumab and nivolumab combination immunotherapy: mouse tumor models, in vitro functional studies, and cynomolgus macaque toxicology. PLoS ONE 11, e0161779 (2016). [DOI] [PMC free article] [PubMed] [Google Scholar]
- 3. Schadendorf, D. et al. Efficacy and safety outcomes in patients with advanced melanoma who discontinued treatment with nivolumab and ipilimumab because of adverse events: a pooled analysis of randomized Phase II and III trials. J. Clin. Oncol. 35, 3807–3814 (2017). [DOI] [PMC free article] [PubMed] [Google Scholar]
- 4. Benson, A.B. 3rd et al. American Society of Clinical Oncology recommendations on adjuvant chemotherapy for stage II colon cancer. J. Clin. Oncol. 22, 3408–3419 (2004). [DOI] [PubMed] [Google Scholar]
- 5. Stein, A. , Voigt, W. & Jordan, K. Chemotherapy‐induced diarrhea: pathophysiology, frequency and guideline‐based management. Ther. Adv. Med. Oncol. 2, 51–63 (2010). [DOI] [PMC free article] [PubMed] [Google Scholar]
- 6. Carr, D.F. et al. Towards better models and mechanistic biomarkers for drug‐induced gastrointestinal injury. Pharmacol. Ther. 172, 181–194 (2017). [DOI] [PubMed] [Google Scholar]
- 7. Hecht, J.R. Gastrointestinal toxicity or irinotecan. Oncology (Williston Park) 12, 72–78 (1998). [PubMed] [Google Scholar]
- 8. Fuchs, C.S. et al. Phase III comparison of two irinotecan dosing regimens in second‐line therapy of metastatic colorectal cancer. J. Clin. Oncol. 21, 807–814 (2003). [DOI] [PubMed] [Google Scholar]
- 9. Gibson, R.J. , Bowen, J.M. , Inglis, M.R. , Cummins, A.G. & Keefe, D.M. Irinotecan causes severe small intestinal damage, as well as colonic damage, in the rat with implanted breast cancer. J. Gastroenterol. Hepatol. 18, 1095–1100 (2003). [DOI] [PubMed] [Google Scholar]
- 10. Hsiang, Y.H. & Liu, L.F. Identification of mammalian DNA topoisomerase I as an intracellular target of the anticancer drug camptothecin. Cancer Res. 48, 1722–1726 (1988). [PubMed] [Google Scholar]
- 11. Shao, R.G. et al. Replication‐mediated DNA damage by camptothecin induces phosphorylation of RPA by DNA‐dependent protein kinase and dissociates RPA:DNA‐PK complexes. EMBO J. 18, 1397–1406 (1999). [DOI] [PMC free article] [PubMed] [Google Scholar]
- 12. Shankaran, H. et al. Systems pharmacology model of gastrointestinal damage predicts species differences and optimizes clinical dosing schedules. CPT Pharmacometrics Syst. Pharmacol. 7, 26–33 (2018). [DOI] [PMC free article] [PubMed] [Google Scholar]
- 13. Crenn, P. et al. Plasma citrulline: a marker of enterocyte mass in villous atrophy‐associated small bowel disease. Gastroenterology 124, 1210–1219 (2003). [DOI] [PubMed] [Google Scholar]
- 14. John‐Baptiste, A. et al. Evaluation of potential gastrointestinal biomarkers in a PAK4 inhibitor‐treated preclinical toxicity model to address unmonitorable gastrointestinal toxicity. Toxicol. Pathol. 40, 482–490 (2012). [DOI] [PubMed] [Google Scholar]
- 15. Herbers, A.H. , Feuth, T. , Donnelly, J.P. & Blijlevens, N.M. Citrulline‐based assessment score: first choice for measuring and monitoring intestinal failure after high‐dose chemotherapy. Ann. Oncol. 21, 1706–1711 (2010). [DOI] [PubMed] [Google Scholar]
- 16. Herbers, A.H. , de Haan, A.F. , van der Velden, W.J. , Donnelly, J.P. & Blijlevens, N.M. Mucositis not neutropenia determines bacteremia among hematopoietic stem cell transplant recipients. Transpl. Infect. Dis. 16, 279–285 (2014). [DOI] [PubMed] [Google Scholar]
- 17. Barzal, J.A. , Szczylik, C. , Rzepecki, P. , Jaworska, M. & Anuszewska, E. Plasma citrulline level as a biomarker for cancer therapy‐induced small bowel mucosal damage. Acta Biochim. Pol. 61, 615–631 (2014). [PubMed] [Google Scholar]
- 18. Basu, S. , Zeng, M. , Yin, T. , Gao, S. & Hu, M. Development and validation of an UPLC‐MS/MS method for the quantification of irinotecan, SN‐38 and SN‐38 glucuronide in plasma, urine, feces, liver and kidney: application to a pharmacokinetic study of irinotecan in rats. J. Chromatogr. B Analyt. Technol. Biomed. Life Sci. 1015–1016, 34–41 (2016). [DOI] [PMC free article] [PubMed] [Google Scholar]
- 19. Shin, S. , Fung, S.M. , Mohan, S. & Fung, H.L. Simultaneous bioanalysis of L‐arginine, L‐citrulline, and dimethylarginines by LC‐MS/MS. J. Chromatogr. B Analyt. Technol. Biomed. Life Sci. 879, 467–474 (2011). [DOI] [PMC free article] [PubMed] [Google Scholar]
- 20. de Man, F.M. , Goey, A.K.L. , van Schaik, R.H.N. , Mathijssen, R.H.J. & Bins, S. Individualization of irinotecan treatment: a review of pharmacokinetics, pharmacodynamics, and pharmacogenetics. Clin. Pharmacokinet. 57, 1229–1254 (2018). [DOI] [PMC free article] [PubMed] [Google Scholar]
- 21. Friberg, L.E. , Henningsson, A. , Maas, H. , Nguyen, L. & Karlsson, M.O. Model of chemotherapy‐induced myelosuppression with parameter consistency across drugs. J. Clin. Oncol. 20, 4713–4721 (2002). [DOI] [PubMed] [Google Scholar]
- 22. Upadhyay, M. , Thapa, S.K. , Kim, T. , Shin, B. , Bulitta, J. B. & Shin, S. Pharmacokinetics of L‐citrulline and L‐arginine in rats simultaneously characterized by a new population model. American Association of Pharmaceutical Scientists Annual Meeting. Poster Abstract. (2015).
- 23. Klein, C.E. et al. Population pharmacokinetic model for irinotecan and two of its metabolites, SN‐38 and SN‐38 glucuronide. Clin. Pharmacol. Ther. 72, 638–647 (2002). [DOI] [PubMed] [Google Scholar]
- 24. Moinard, C. et al. Dose‐ranging effects of citrulline administration on plasma amino acids and hormonal patterns in healthy subjects: the Citrudose pharmacokinetic study. Br. J. Nutr. 99, 855–862 (2008). [DOI] [PubMed] [Google Scholar]
- 25. Keefe, D.M. , Brealey, J. , Goland, G.J. & Cummins, A.G. Chemotherapy for cancer causes apoptosis that precedes hypoplasia in crypts of the small intestine in humans. Gut 47, 632–637 (2000). [DOI] [PMC free article] [PubMed] [Google Scholar]
- 26. Kwak, E.Y. , Choi, M.K. , Yang, S.G. , Shim, C.K. & Shim, W.S. Investigation into the efficacy of Val‐SN‐38, a valine‐ester prodrug of the anti‐cancer agent SN‐38. Biomol. Ther. (Seoul) 20, 326–331 (2012). [DOI] [PMC free article] [PubMed] [Google Scholar]
- 27. Tsavaris, N. et al. Two different schedules of irinotecan (CPT‐11) in patients with advanced colorectal carcinoma relapsing after a 5‐fluorouracil and leucovorin combination. A randomized study. Cancer Chemother. Pharmacol. 52, 514–519 (2003). [DOI] [PubMed] [Google Scholar]
- 28. Kaneda, N. & Yokokura, T. Nonlinear pharmacokinetics of CPT‐11 in rats. Cancer Res. 50, 1721–1725 (1990). [PubMed] [Google Scholar]
- 29. Imai, T. & Ohura, K. The role of intestinal carboxylesterase in the oral absorption of prodrugs. Curr. Drug. Metab. 11, 793–805 (2010). [DOI] [PubMed] [Google Scholar]
- 30. Wright, N.A. & Irwin, M. The kinetics of villus cell populations in the mouse small intestine. I. Normal villi: the steady state requirement. Cell Tissue Kinet. 15, 595–609 (1982) [DOI] [PubMed] [Google Scholar]
- 31. Weser, E. & Hernandez, M.H. Studies of small bowel adaptation after intestinal resection in the rat. Gastroenterology 60, 69–75 (1971). [PubMed] [Google Scholar]
- 32. Bowen, J.M. et al. Development of a rat model of oral small molecule receptor tyrosine kinase inhibitor‐induced diarrhea. Cancer Biol. Ther. 13, 1269–1275 (2012). [DOI] [PMC free article] [PubMed] [Google Scholar]
- 33. Van Sebille, Y.Z. , Gibson, R.J. , Wardill, H.R. & Bowen, J.M. ErbB small molecule tyrosine kinase inhibitor (TKI) induced diarrhoea: chloride secretion as a mechanistic hypothesis. Cancer Treat. Rev. 41, 646–652 (2015). [DOI] [PubMed] [Google Scholar]
- 34. Diamanti, A. et al. Plasma citrulline as surrogate marker of intestinal inflammation in pediatric and adolescent with Crohn's disease: preliminary report. Int. J. Colorectal. Dis. 26, 1445–1451 (2011). [DOI] [PubMed] [Google Scholar]
- 35. Diamanti, A. et al. Plasma citrulline in Crohn's disease as a marker of inflammation or disease localization. J. Clin. Gastroenterol. 46, 622–623 (2012). [DOI] [PubMed] [Google Scholar]
- 36. US Food and Drug Administration, Center for Drug Evaluation and Research . NDA/BLA Multi‐Disciplinary Review and Evaluation for Ribociclib (Silver Spring, MD, US Food and Drug Administration, 2017). [Google Scholar]
Associated Data
This section collects any data citations, data availability statements, or supplementary materials included in this article.
Supplementary Materials
Figure S1. Schematic description of the pharmacokinetic models.
Figure S2. Visual predictive check analyses for population toxicokinetic model analysis.
Figure S3. Scattered plots of individual system toxicology model parameters and dose.
Figure S4. The incorporation of tolerance development improved the goodness of fit.
Figure S5. Sensitivity analysis for system toxicology model.