Abstract
Background
Animal models of diet‐induced obesity (DIO) are commonly used in medical research for mimicking human diseases. There is no universal animal model, and careful evaluation of variety of factors needs to be considered when designing new experiments. Here, we investigated the effect of 9 weeks high‐fat diet (HFD) intervention, providing 60% energy from fat, on parameters of inflammation and insulin resistance in male C57BL/6J mice.
Methods
Six weeks old mice were initiated on regular diet (RD) or HFD providing 60 kcal energy from fat for 9 weeks. Fasting blood glucose levels were measured by glucometer, and fasting plasma levels of insulin and proinflammatory cytokines by Luminex assay. Insulin sensitivity was evaluated by using QUICKI and HOMA2 indexes.
Results
HFD mice showed ~ 40% higher body weight and ~ 20% larger abdominal circumference, due to an increase in the white adipose tissue mass. Liver examination revealed increased size and higher hepatic lipid accumulation in livers from HFD mice compared to their RD counterparts. Animals from the HFD group were characterized with significantly higher presence of crown‐like structures (CLS) in WAT and higher plasma levels of proinflammatory cytokines (TNF‐α, IL‐6, leptin, MCP‐1, PAI‐1, and resistin). HFD‐fed mice also demonstrated impaired insulin sensitivity (lower QUICKI, higher HOMA‐insulin resistance (HOMA‐IR), and lower HOMA‐percent sensitivity (HOMA‐%S)) index values.
Conclusion
Male C57BL/6J mice on 9 weeks HFD providing 60 kcal energy from fat display impaired insulin sensitivity and chronic inflammation, thus making this DIO mouse model appropriate for studies of early stages of obesity‐related pathology.
Keywords: diet, high‐fat, insulin resistance, mouse model
1. INTRODUCTION
Adipose tissue is an active endocrine organ that senses nutrient status and regulates energy mobilization.1 Although genetic predisposition plays a role, the obesity is largely a result of unequal balance between energy intake and energy expenditure, as dietary fat intake is considered to be the main factor for the increase in adiposity.2 Obesity is characterized by adipocyte death, infiltration of adipose tissue macrophages (ATM) and monocytes, disturbed adipocyte differentiation and secretion, and chronic inflammation. Obesity is associated with multiple comorbidities such as liver disease, metabolic syndrome, and type 2 diabetes mellitus, among others.
Animal models of diet‐induced obesity (DIO) using high‐fat diet (HFD) regimens that mimic different physiological conditions in humans are commonly used in research. There is no universal HFD animal model. Diets vary significantly in their macro‐ and micronutrient content, and animal strains respond differently to diets. Other factors, such as age or gender of the animals, also play significant roles.3 Adipose tissue and adipocyte physiology is directly modulated by sex hormone fluctuations during the ovarian cycle. For example, estrogens affect white adipose tissue (WAT) mass, insulin sensitivity, and glucose tolerance,4 while increased testosterone levels during the follicular phase of the ovarian cycle increase fatty acid uptake.5 Thus, choosing the most appropriate animal strand, type of diet, length of dietary treatment and timing, and gender of the animals are important factors to consider when designing new experiments. It is important to note that many studies on diabetes are performed on DIO mice on HFD ranging from 16 to 20 weeks resulting in dramatic increase in animal body weight.3 This could be a major disadvantage and obtained results should be carefully considered regarding secondary to obesity complications in these mice. Thus, in some cases, shorter duration diets may be considered as more appropriate.
The aim of this study was to investigate the effect of 60% fat diet regimen for 9 weeks in male C57BL/6J mice. We evaluated morphological characteristics (body weight and abdominal circumference), WAT and brown adipose tissue (BAT) depots, liver fat accumulation, plasma levels of circulating proinflammatory cytokines, as well as insulin resistance using QUICKI and HOMA2 indexes.
2. MATERIALS AND METHODS
2.1. Animals
The in vivo experiment was performed in accordance with the National Institutes of Health (NIH) Guidelines under a protocol approved by the Institutional Animal Care and Use Committee (IACUC) of The Feinstein Institutes for Medical Research, Northwell Health, Manhasset, New York.
Six weeks old C57BL/6J DIO Control (Stock # 380056) and C57BL/6J DIO (Stock # 380050, The Jackson Laboratory) male mice were placed on isocaloric low‐fat control diet (10% kcal energy from fat) (Research Diets, Cat. # D12450B) (regular diet (RD) group) or HFD (60% kcal energy from fat) (Research Diets, Cat. # D12492) (HFD group), respectively, and at the age of 12 weeks were delivered to The Feinstein Institutes for Medical Research, where the diet regimens continued until age of 15 weeks. Full formulation and caloric information of the diets used is listed in Tables S1 and S2. Mice were euthanized by exposure to a lethal dose of CO2 followed by cervical dislocation.
2.2. Blood collection and glucose and adipokine measurements
Mice were overnight (14‐15 hours) fasted. Blood samples were taken from cheek vein in the morning, immediately before sacrifice, and glucose levels were measured by using OneTouch Verio Flex™ System (LifeScan). Regression statistics of this system are as follows: 95% CI slope = 0.97‐1.01; 95% CI intercept = −1.59‐7.55 mg/dL; standard error (Sy.x) = 14.0 mg/dL; R 2 = .98. After sacrifice, terminal blood samples were collected by cardiac puncture in tubes containing 5.4 mg EDTA (BD). Samples were placed immediately on ice for 3 hours and centrifuged at 5000 g/15 min/4°C to separate the plasma fraction, then the samples were aliquoted and immediately frozen at −86°C until further processed. Plasma levels of IL‐6, insulin, leptin, MCP‐1, PAI‐1 (total), resistin, and TNF‐α were measured by Luminex assay using MILLIPLEX Map Mouse Adipokine Magnetic Bead Panel‐Endocrine Multiplex Assay (Millipore, Cat. # MADKMAG‐71K). The assay sensitivity, precision, and accuracy were as follows: sensitivity was (minimum detectable concentration (MinDC) [pg/mL], MinDC + 2SD [pg/mL]): IL‐6 (2.3, 6.3), insulin (13.0, 27.7), leptin (4.2, 8.2), MCP‐1 (4.9, 11.9), PAI‐1 Total (4.0, 10.3), resistin (1.1, 3.7), TNF‐α (5.3, 11.0); precision (intra‐assay %CV, inter‐assay %CV) for all seven analytes was (<10%, <20%); and accuracy was (% recovery in serum matrix): IL‐6 (89%), insulin (89%), leptin (86%), MCP‐1 (83%), PAI‐1 Total (92%), resistin (77%), TNF‐α (85%).
2.3. Assessment of insulin sensitivity in mice subjects
Insulin sensitivity was assessed by using quantitative insulin sensitivity check index (QUICKI) (1/log insulin (mU/L) + log glucose (mg/dL))6 and homeostasis model assessment‐2 (HOMA2) index using online‐based calculator on the Diabetes Trials Unit of the University of Oxford website (https://www.dtu.ox.ac.uk/homacalculator/) providing values for insulin resistance (HOMA‐IR), steady‐state β‐cell function (HOMA‐%B), and insulin sensitivity (HOMA‐%S).
2.4. Tissue dissection and preparation
Animals were perfused with formaldehyde, and various adipose tissue depots (epididymal, inguinal, mesenteric, interscapular, retroperitoneal, pericardial WAT, and interscapular BAT) and livers were dissected, weighted, and stored in PBS. Samples were sent to the Histopathology Core facility of New York University School of Medicine in New York, New York for paraffin embedding, slicing and hematoxylin and eosin (H&E) staining.
2.5. Assessment of hepatic lipid accumulation
Hepatic lipid accumulation was assessed by counting the number of lipid‐containing hepatocytes. Data are presented as percentage of lipid‐containing hepatocytes per microscopic visual field.
2.6. Statistical analyses
Statistical analyses were performed using GraphPad Prism 7 software (GraphPad Software). Statistically significant difference between the means of two groups (RD and HFD) was calculated using Student's t test and two‐tailed distribution. Results were considered statistically significant if P ≤ .05. Results were presented as mean ± SEM.
3. RESULTS
3.1. Body weight and adipose tissue
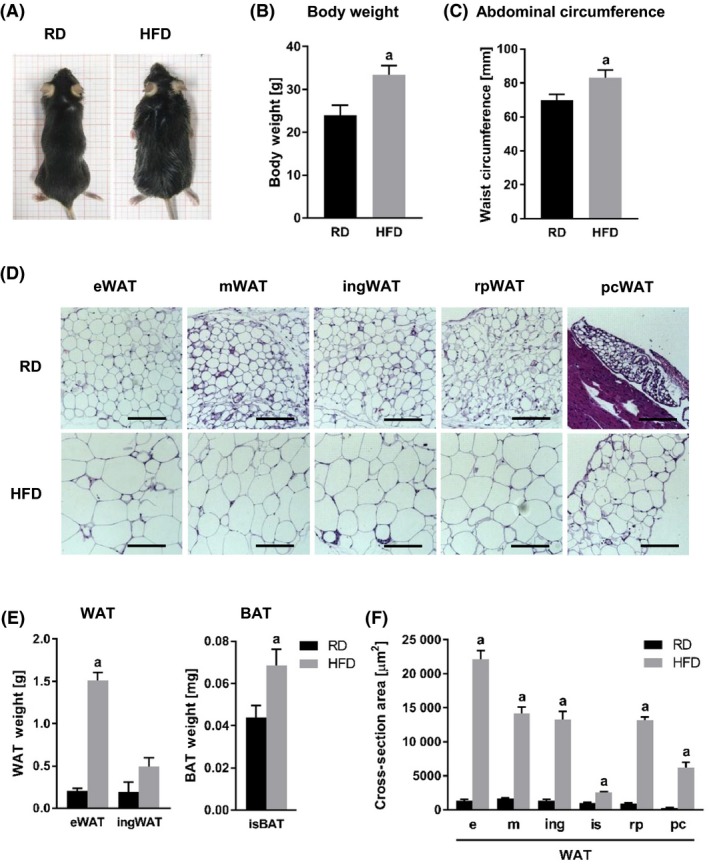
HFD‐fed mice exhibited ~ 40% increase in body weight (Table 1, and Figure 1A and B) and ~ 20% increase in their abdominal circumference (Table 1 and Figure 1C). Various WAT (epididymal WAT (eWAT), mesenteric WAT (mWAT), inguinal WAT (ingWAT), retroperitoneal WAT (rpWAT), and pericardial WAT (pcWAT)) and BAT (interscapular (isBAT)) depots were dissected and analyzed (Figure 1D). Body weight increase in the HFD group mice was mainly due to the accumulation of eWAT (Table 1 and Figure 1E). Significant increase in fat accumulation was also detected in the isBAT depot (Table 1 and Figure 1E). In all investigated WAT depots, HFD regimen resulted in significant increase in adipocyte size (Figure 1D, F, and Table 1).
Table 1.
Effect of HFD on body weight and liver
| Parameter | RD | HFD | P value |
|---|---|---|---|
| Body weight [g] | 24.05 ± 0.82 | 33.38 ± 0.75 | <.0001 |
| Abdominal circumference [mm] | 69.82 ± 1.25 | 83.09 ± 1.59 | <.0001 |
| WAT weight [g] | |||
| eWAT | 0.2039 ± 0.0315 | 1.5070 ± 0.0998 | <.0001 |
| ingWAT | 0.1929 ± 0.1143 | 0.4929 ± 0.1015 | .0733 |
| BAT weight [mg] | |||
| isBAT | 0.0440 ± 0.0055 | 0.0687 ± 0.0075 | .0186 |
| Adipocyte size [µm2] | |||
| eWAT | 1350 ± 195 | 22 154 ± 1261 | <.0001 |
| mWAT | 1688 ± 72 | 14 171 ± 993 | <.0001 |
| ingWAT | 1360 ± 180 | 13 281 ± 1183 | <.0001 |
| isWAT | 1013 ± 111 | 2549 ± 159 | <.0001 |
| rpWAT | 951 ± 130 | 13 169 ± 514 | <.0001 |
| pcWAT | 266 ± 36 | 6253 ± 758 | <.0001 |
| Liver weight [g] | 0.886 ± 0.099 | 1.183 ± 0.063 | .0494 |
| Hepatic lipid accumulation [% of total area] | 5.6 ± 0.5 | 51.8 ± 5.1 | <.0001 |
| eWAT: Number of CLS per area | 1.669 ± 0.494 | 5.201 ± 0.633 | .0020 |
Values of P ≤ .05 are marked in bold.
Abbreviations: RD, regular diet; HFD, high‐fat diet; WAT, white adipose tissue; BAT, brown adipose tissue; eWAT, epididymal WAT; ingWAT, inguinal WAT; mWAT, mesenteric WAT; isWAT, interscapular WAT; rpWAT, retroperitoneal WAT; pcWAT, pericardial WAT; isBAT, interscapular BAT.
Figure 1.

Effect of HFD on body weight and adipose tissue. A, Comparisons between RD and HFD mice in body habitus (A), body weight (B), and abdominal circumference (C). D, Cross sections of various WAT tissue depots from RD and HFD mice stained with H&E. E, Comparisons between RD and HFD mice in adipose tissue weight from different depots. F, Comparisons of adipocyte size in various WAT depots, measured as cross‐section area [µm2]. a, P < .0001. Abbreviations: RD, regular diet; HFD, high‐fat diet; WAT, white adipose tissue; BAT, brown adipose tissue; eWAT, epididymal WAT; ingWAT, inguinal WAT; mWAT, mesenteric WAT; isWAT, interscapular WAT; rpWAT, retroperitoneal WAT; pcWAT, pericardial WAT; isBAT, interscapular BAT; H&E, hematoxylin and eosin
3.2. Liver
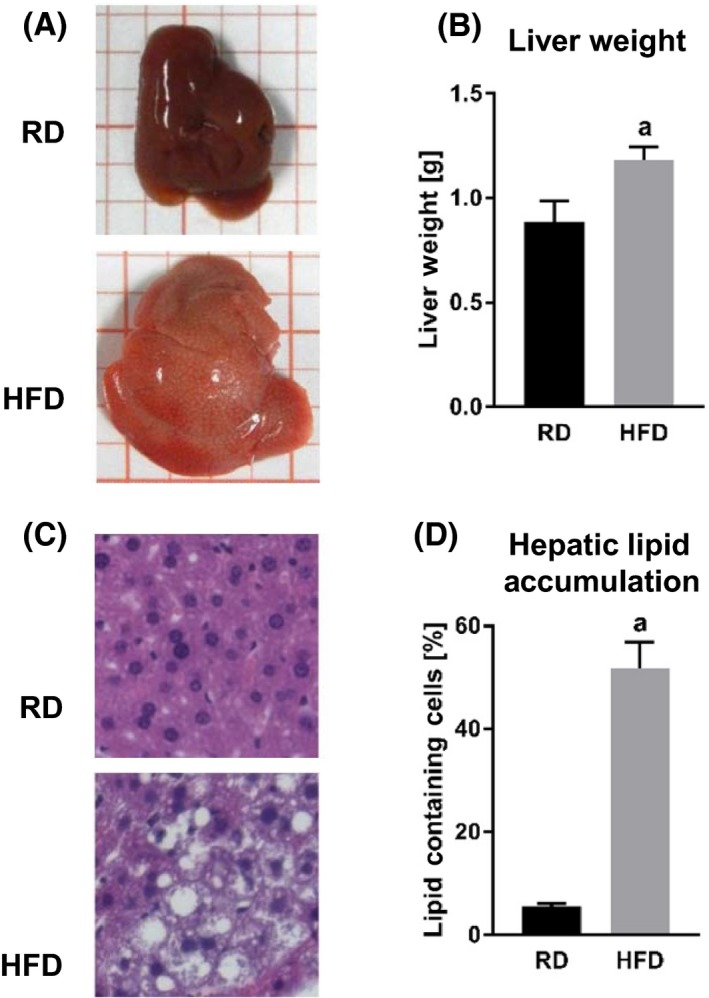
HFD‐fed mice developed larger livers (Figure 2A) that were significantly heavier than those of the RD group mice (Table 1 and Figure 2B). Visually, the livers from the HFD‐fed animals were distinguished from those of the RD group mice as pale in color (Figure 2A). Microscopic examination of tissue slides revealed higher hepatocyte lipid droplet accumulation in the livers from the HFD, compared to those from the RD group (Figure 2C and D, and Table 1).
Figure 2.

Effect of HFD on liver. Comparisons between livers from RD and HFD mice. A, Liver size and appearance. B, Liver weight. a, P = .0494. C, Liver cross sections stained with H&E. D, Hepatic lipid accumulation measured as percentage of hepatocytes containing lipids. a, P < .0001. Abbreviations: RD, regular diet; HFD, high‐fat diet
3.3. Chronic inflammation
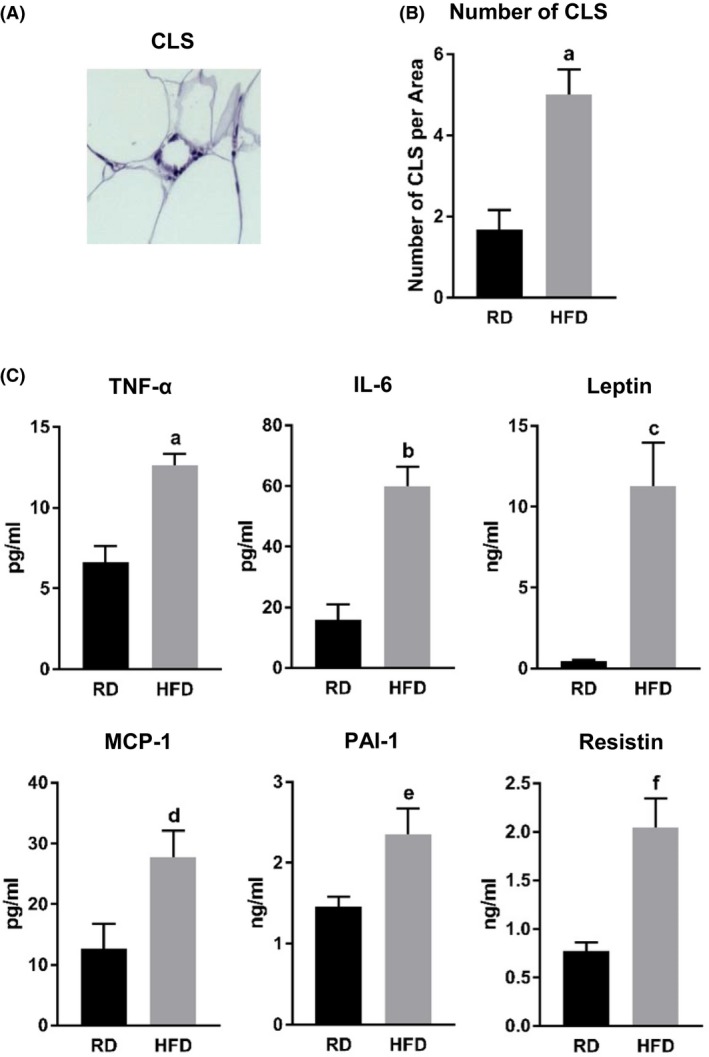
A hallmark of obesity is the higher incidence of adipocyte death and the infiltration of monocytes and macrophages forming crown‐like structures (CLS) (Figure 3A). Examination of WAT specimens exhibited higher presence of CLS in WAT from mice fed on HFD, compared to those on RD (Figure 3B and Table 1). Mice from the HFD group also showed significantly higher basal circulating levels of proinflammatory cytokines (tumor necrosis factor‐alpha (TNF‐α), interleukin‐6 (IL‐6), leptin, monocyte chemoattractant protein‐1 (MCP‐1), plasminogen activator inhibitor‐1 (PAI‐1), and resistin) (Figure 3C and Table 2).
Figure 3.

Effect of HFD on chronic inflammation. A, CLS. B, Comparisons between RD and HFD mice in number of CLS. Data are presented as number of CLS per visual microscope area. a, P = .0020. C, Fasting plasma levels of proinflammatory cytokines (TNF‐α, IL‐6, leptin, MCP‐1, PAI‐1, and resistin) measured by Luminex assay. a, P = .0209; b, P = .0002; c, P = .0024; d, P = .0328; e, P = .0151; f, P = .0008. Abbreviations: RD, regular diet; HFD, high‐fat diet; CLS, crown‐like structure; (TNF‐α), tumor necrosis factor‐alpha; IL‐6, interleukin‐6; MCP‐1, monocyte chemoattractant protein‐1; PAI‐1, plasminogen activator inhibitor‐1
Table 2.
Effect of HFD on proinflammatory cytokine expression
| Cytokine level | RD | HFD | P value |
|---|---|---|---|
| TNF‐α [pg/mL] | 6.60 ± 0.73 | 12.62 ± 0.50 | .0209 |
| IL‐6 [pg/mL] | 15.95 ± 4.97 | 59.95 ± 6.43 | .0002 |
| Leptin [ng/mL] | 0.45 ± 0.10 | 11.27 ± 2.68 | .0024 |
| MCP‐1 [pg/mL] | 12.57 ± 4.22 | 27.69 ± 4.45 | .0328 |
| PAI‐1 [ng/mL] | 1.46 ± 0.12 | 2.36 ± 0.31 | .0151 |
| Resistin [ng/mL] | 0.77 ± 0.04 | 2.04 ± 0.29 | .0008 |
Values of P ≤ .05 are marked in bold.
Abbreviations: RD, regular diet; HFD, high‐fat diet; TNF‐α, tumor necrosis factor‐alpha; IL‐6, interleukin‐6; MCP‐1, monocyte chemoattractant protein‐1; PAI‐1, plasminogen activator inhibitor‐1.
3.4. Insulin sensitivity
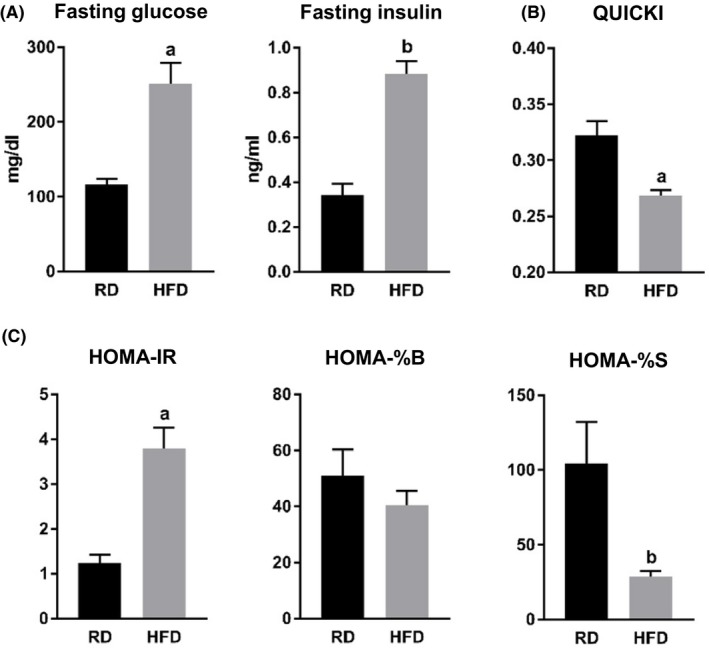
Both fasting blood glucose and plasma insulin levels were significantly elevated in the HFD group mice (Figure 4A and Table 3). Based on these measurements, we calculated insulin resistance index by using quantitative insulin sensitivity check index (QUICKI) and homeostasis model assessment (HOMA) index. HFD‐fed mice exhibited lower QUICKI and higher HOMA‐insulin resistance (HOMA‐IR) indexes (Figure 4B and C, and Table 2). Although, there was a tendency for impaired β‐cell function calculated on the basis of the HOMA index (HOMA‐% β‐cells (HOMA‐%B)), we did not detect any statistically significant difference between the two groups of animals (Figure 4C and Table 3). HFD group mice demonstrated significantly impaired insulin sensitivity based on HOMA index (HOMA‐% sensitivity (HOMA‐%S)) values (Figure 4C and Table 3).
Figure 4.

Effect of HFD on insulin sensitivity. A, Fasting blood glucose levels measured with glucometer, and fasting plasma levels of insulin measured by Luminex assay. a, P = .0015; b, P < .0001. B, QUICKI index values. a, P = .0022. C, HOMA2 index values: insulin resistance (HOMA‐IR), β‐cell function (HOMA‐%B), and insulin sensitivity (HOMA‐%S). a, P = .0003; b, P = .0189. Abbreviations: RD, regular diet; HFD, high‐fat diet; QUICKI, quantitative insulin sensitivity check index; HOMA, homeostatic model assessment; IR, insulin resistance; %B, percent β‐cells; %S, percent sensitivity
Table 3.
Effect of HFD on insulin resistance
| Parameter | RD | HFD | P value |
|---|---|---|---|
| Glucose [mg/dL] | 116.6 ± 7.2 | 251.2 ± 27.7 | .0015 |
| Insulin [ng/mL] | 0.34 ± 0.05 | 0.88 ± 0.05 | <.0001 |
| QUICKI | 0.32 ± 0.01 | 0.27 ± 0.01 | .0022 |
| HOMA‐IR | 1.23 ± 0.20 | 3.79 ± 0.47 | .0003 |
| HOMA‐%B | 50.84 ± 9.53 | 40.40 ± 5.05 | .3496 |
| HOMA‐%S | 104.40 ± 27.60 | 28.89 ± 3.46 | .0189 |
Values of P ≤ .05 are marked in bold.
Abbreviations: RD, regular diet; HFD, high‐fat diet; CLS, crown‐like structure.
4. DISCUSSION
Animal models of DIO are commonly used in research as each model mimics different physiological response. DIO models vary in the type of diet (percentage of energy from fat, sources of proteins, carbohydrates, and fats, etc), duration of feeding (from several weeks to many months), the time when the feeding is initiated (immediately after weaning or at later point), and many other factors.7, 8, 9, 10, 11, 12 Rodent HFDs consist of amino acid supplemented casein, cornstarch, sucrose, or maltodextrose, soybean oil or lard, supplemented with minerals and vitamins.13 Depending on the purpose, DIO diet formulations are characterized with different percentage fat and carbohydrate that may come from a various sources. DIO mouse models use HFDs that are designed to provide between 40% and 60% energy from fat, as these diets are administered for anywhere between 14 and 300 days.14 Duration of common diet varies from 12 to 20 weeks, resulting in adipocyte cell death following adipose tissue expansion, ATM infiltration, insulin resistance, hyperglycemia, diabetes, liver fat accumulation, hypertension, and other pathological conditions.3, 15 Longer administration of HFD (8‐16 months) lead to a dramatic increase in body weight, blood glucose, insulin, and cholesterol levels.12 Additional source of variability in these models is the fact that mice strains have diverse susceptibility and pathological responses to the diet.3, 16, 17, 18 For example, C57BL/6 mice are highly susceptible to HFD feeding, while A/J, C57BL/KsJ, SWR/J, or CAST/Ei are relatively resistant.19, 20, 21, 22 Thus, choosing the most appropriate animal strand, type of diet, length of administration, and timing are basic factors to consider when designing a new experiment.
In this study, we used C57BL/6J mice and a diet providing 60% energy from fat, for a duration of 12 weeks, thus avoiding some secondary consequences related to obesity. We observed approximately 40% increase in body weight and approximately 20% increase in abdominal circumference, due to hypertrophy and hyperplasia of the WAT. In our experiment, the mice fed HFD showed hepatic lipid accumulation and presence of chronic inflammation evidenced by higher incidence of CLS and elevated basal levels of circulating proinflammatory cytokines. These mice also manifested impaired insulin sensitivity, a consequence of the obesity. We evaluated insulin sensitivity by using two different homeostasis model assessment indexes, QUICKI and HOMA2. Both of these indexes are calculated using basal levels of glucose and insulin values, and are developed on the basis of empirical methods using human subjects. Since HOMA2 incorporates a normalizing factor specific to human subjects,23 QUICKI may be a more appropriate index in mouse studies. Nevertheless, multiple in vivo rodent studies demonstrated strong correlation of these indexes with measurements from clamp studies, demonstrating that they are applicable to mice and rats.24 Our results showed significantly lower QUICKI as well as higher HOMA‐IR index values in the HFD group mice, compared to the RD group (Figure 4B and C). Although, with our sample size, we were not able to detect any statistically significant difference in the β‐cell function (calculated on the basis of the HOMA2 index), there was a trend in β‐cell function values to be lower in mice from the HFD group, compared to RD animals (50.84 for the RD group vs 40.40 for the HFD group, P = .3496) (Figure 4C). Mice from the HFD group also demonstrated almost a 4‐fold lower values for the percentage of insulin sensitivity based on the HOMA2 calculations (Figure 4C).
The DIO mouse models have proven to be invaluable for chronic inflammation and insulin resistance studies. There is a variety of HFD mouse models of obesity with insulin resistance exhibiting different pathophysiological responses. Here we examined the effect of 9‐week HFD feeding in male C57BL/6J mice with a diet providing 60% energy from fat on the development of insulin resistance and chronic inflammation. We concluded that this animal model could be appropriate for studies which aim to investigate prevention and treatment approaches that target a relatively early stages of obesity‐related pathology.
CONFLICT OF INTEREST
None.
AUTHOR CONTRIBUTIONS
DA and VP designed the study and conducted the experiment; DA analyzed the data and wrote the initial manuscript; KT and LP critically revised the manuscript. All the authors proofread every submission and approved the manuscript.
Supporting information
ACKNOWLEDGEMENTS
This work was supported by the grants from Gerald J. and Dorothy R. Friedman New York Foundation for Medical Research.
Avtanski D, Pavlov VA, Tracey KJ, Poretsky L. Characterization of inflammation and insulin resistance in high‐fat diet‐induced male C57BL/6J mouse model of obesity. Animal Model Exp Med. 2019;2:252–258. 10.1002/ame2.12084
REFERENCES
- 1. Reilly SM, Saltiel AR. Adapting to obesity with adipose tissue inflammation. Nat Rev Endocrinol. 2017;13:633‐643. [DOI] [PubMed] [Google Scholar]
- 2. Hariri N, Thibault L. High‐fat diet‐induced obesity in animal models. Nutr Res Rev. 2010;23:270‐299. [DOI] [PubMed] [Google Scholar]
- 3. Heydemann A. An overview of murine high fat diet as a model for type 2 diabetes mellitus. J Diabetes Res. 2016;2016:2902351. [DOI] [PMC free article] [PubMed] [Google Scholar]
- 4. Blüher M. Importance of estrogen receptors in adipose tissue function. Mol Metab. 2013;2:130‐132. [DOI] [PMC free article] [PubMed] [Google Scholar]
- 5. Varlamov O, Bethea CL, Roberts CT Jr. Sex‐specific differences in lipid and glucose metabolism. Front Endocrinol (Lausanne). 2015;5:241. [DOI] [PMC free article] [PubMed] [Google Scholar]
- 6. Katz A, Nambi SS, Mather K, et al. Quantitative insulin sensitivity check index: a simple, accurate method for assessing insulin sensitivity in humans. J Clin Endocrinol Metab. 2000;85:2402‐2410. [DOI] [PubMed] [Google Scholar]
- 7. Villarroya J, Redondo‐Angulo I, Iglesias R, Giralt M, Villarroya F, Planavila A. Sirt1 mediates the effects of a short‐term high‐fat diet on the heart. J Nutr Biochem. 2015;26:1328‐1337. [DOI] [PubMed] [Google Scholar]
- 8. Carbone S, Mauro AG, Mezzaroma E, et al. A high‐sugar and high‐fat diet impairs cardiac systolic and diastolic function in mice. Int J Cardiol. 2015;198:66‐69. [DOI] [PubMed] [Google Scholar]
- 9. Roberts NW, González‐Vega M, Berhanu TK, Mull A, García J, Heydemann A. Successful metabolic adaptations leading to the prevention of high fat diet‐induced murine cardiac remodeling. Cardiovasc Diabetol. 2015;14:127. [DOI] [PMC free article] [PubMed] [Google Scholar]
- 10. Abdesselam I, Pepino P, Troalen T, et al. Time course of cardiometabolic alterations in a high fat high sucrose diet mice model and improvement after GLP‐1 analog treatment using multimodal cardiovascular magnetic resonance. J Cardiovasc Magn Reson. 2015;17:95. [DOI] [PMC free article] [PubMed] [Google Scholar]
- 11. Brainard RE, Watson LJ, DeMartino AM, et al. High fat feeding in mice is insufficient to induce cardiac dysfunction and does not exacerbate heart failure. PLoS ONE. 2013;8:e83174. [DOI] [PMC free article] [PubMed] [Google Scholar]
- 12. Calligaris SD, Lecanda M, Solis F, et al. Mice long‐term high‐fat diet feeding recapitulates human cardiovascular alterations: an animal model to study the early phases of diabetic cardiomyopathy. PLoS ONE. 2013;8:e60931. [DOI] [PMC free article] [PubMed] [Google Scholar]
- 13. Warden CH, Fisler JS. Comparisons of diets used in animal models of high‐fat feeding. Cell Metab. 2008;7:277. [DOI] [PMC free article] [PubMed] [Google Scholar]
- 14. Buettner R, Schölmerich J, Bollheimer LC. High‐fat diets: modeling the metabolic disorders of human obesity in rodents. Obesity (Silver Spring). 2007;15(4):798‐808. [DOI] [PubMed] [Google Scholar]
- 15. Collins S, Martin TL, Surwit RS, Robidoux J. Genetic vulnerability to diet‐induced obesity in the C57BL/6J mouse: physiological and molecular characteristics. Physiol Behav. 2004;81(2):243‐248. [DOI] [PubMed] [Google Scholar]
- 16. Inui A. Obesity–a chronic health problem in cloned mice? Trends Pharmacol Sci. 2003;24:77‐80. [DOI] [PubMed] [Google Scholar]
- 17. Speakman J, Hambly C, Mitchell S, Król E. Animal models of obesity. Obes Rev. 2007;8(Suppl 1):55‐61. [DOI] [PubMed] [Google Scholar]
- 18. Sato A, Kawano H, Notsu T, et al. Antiobesity effect of eicosapentaenoic acid in high‐fat/high‐sucrose diet‐induced obesity: importance of hepatic lipogenesis. Diabetes. 2010;59:2495‐2504. [DOI] [PMC free article] [PubMed] [Google Scholar]
- 19. Johnson PR, Greenwood MR, Horwitz BA, Stern JS. Animal models of obesity: genetic aspects. Annu Rev Nutr. 1991;11:325‐353. [DOI] [PubMed] [Google Scholar]
- 20. Smith BK, Andrews PK, West DB. Macronutrient diet selection in thirteen mouse strains. Am J Physiol Regul Integr Comp Physiol. 2000;278:R797‐R805. [DOI] [PubMed] [Google Scholar]
- 21. Wang CY, Liao JK. A mouse model of diet‐induced obesity and insulin resistance. Methods Mol Biol. 2012;821:421‐433. [DOI] [PMC free article] [PubMed] [Google Scholar]
- 22. Yang Y, Smith DL, Keating KD, Allison DB, Nagy TR. Variations in body weight, food intake and body composition after long‐term high‐fat diet feeding in C57BL/6J mice. Obesity (Silver Spring). 2014;22:2147‐2155. [DOI] [PMC free article] [PubMed] [Google Scholar]
- 23. Radziuk J. Insulin sensitivity and its measurement: structural commonalities among the methods. J Clin Endocrinol Metab. 2000;85:4426‐4433. [DOI] [PubMed] [Google Scholar]
- 24. Mather K. Surrogate measures of insulin resistance: of rats, mice, and men. Am J Physiol Endocrinol Metab. 2009;296:E398‐E399. [DOI] [PubMed] [Google Scholar]
Associated Data
This section collects any data citations, data availability statements, or supplementary materials included in this article.
Supplementary Materials


